29/12/2022 Daily Reports
- The EUR/USD failed to break the current range despite hitting the highest level in 13 days. The pair peaked at 1.0675 and then pulled back. It is trading at daily lows near 1.0610, still bullish in the daily chart.
- The short-lived run to 1.0675 coincided with the US dollar bottoming across the board. Afterwards, boosted by a rebound in US yields. The US 10-year yield rose from 3.82% to 3.87%, a fresh monthly high. Equity prices in the US turned negative adding some support to the greenback. The US Dollar reversed sharply during the last hour. The DXY rose from 6-day lows at 103.84 to 104.42, the strongest since Friday.
- Economic data released in the US showed mixed numbers. Pending Home Sales in November dropped unexpectedly by 4% against expectations of a 0.6% increase; compared to a year ago sales are down by 37.8%. The Richmond Fed Manufacturing Index jumped in December to 1 from -9, surpassing the market consensus of -4.
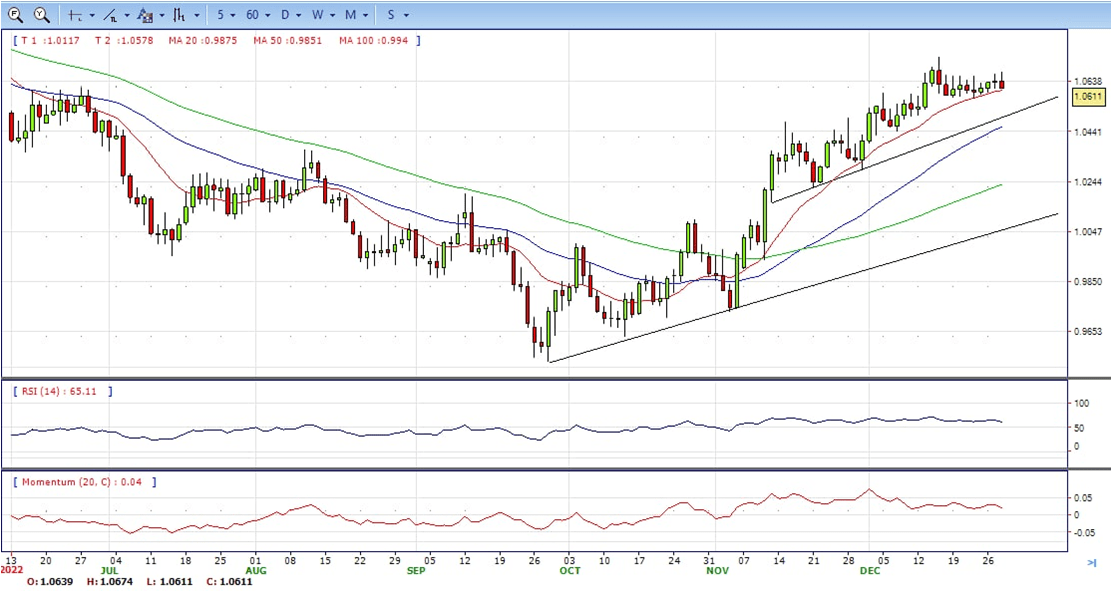
- The EUR/USD pair is trading near the 1.0610, down for the day with bullish stance in daily chart. The pair stabilized above 20 and 50 SMA, indicates bullish strength. Meanwhile, the 20 SMA continued accelerating north and developing far above longer ones, suggests bulls not exhausted yet. On upside, the immediate resistance is 1.0665, break above this level will extend the advance to 1.0740.
- Technical readings in the daily chart support the bullish stances. The RSI indicators hovering above the midline and stabilized around 61. The Momentum indicator stabilized above the midline, indicating upward potentials. On downside, the immediate support is 1.0570 and below this level will open the gate to 1.0500.
- The Pound Sterling advances sharply following a European choppy trading session, bouncing off the day’s lows around 1.2000, posing a challenge to the 1.2100 figure in the NY session. It failed to hold the gains and back to 1.2020 are to ended Wednesday, neutral to bearish in the daily chart.
- Investors’ mood is mixed amidst the North American session. The lack of US economic data, with the US Redbook released coming at 9.6% YoY, compared to the previous reading of 7.6%, failed to underpin the US Dollar. .
- Ahead into the week, the UK economic docket is empty, while the US calendar will feature Initial Jobless Claims for the week ending on December 23, ahead of the release of the Chicago PMI on Friday.
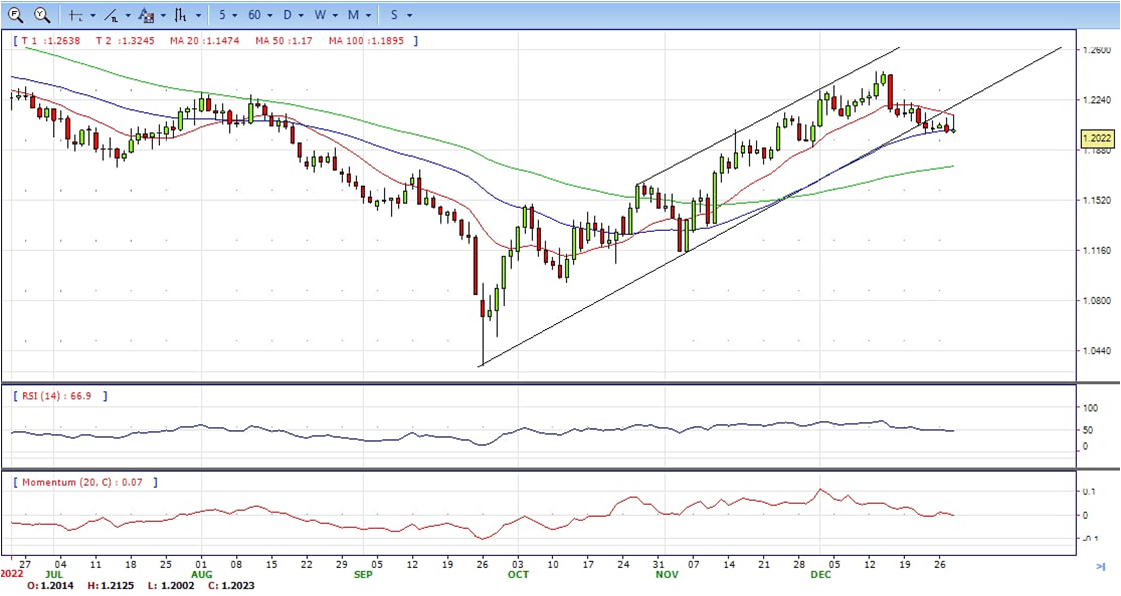
- The GBP/USD offers neutral to bearish stance in daily chart. Cable stabilized between 20 and 50 SMA, indicating neutral strength in short term. However, the 20 SMA started turning south and heading towards 50 SMA, suggests bears not exhausted yet. On upside, The immediate resistance is 1.2150 with a break above it exposing to 1.2250.
- Technical readings in the daily chart support the neutral to bearish stances. RSI indicator stabilized around 47, while the Momentum indicator stabilized near the midline, suggesting directionless potentials. On downside, the immediate support is 1.1990, unable to defend this level will resume the decline to 1.1900.


- Gold prices extended losses during the American session and printed a fresh daily low at $1,797. Currently, XAU/USD is hovering around $1,804, still bullish in the daily chart.
- The precious metal has been trading lower on Tuesday, giving away gains after a spike high to $1,835 seen on Tuesday. The moderately positive market mood, triggered by news that China is scrapping quarantine for inbound travelers has lifted the market mood in an otherwise quiet post-Christmas market.
- Furthermore, the US Dollar remains on the back foot, with the Dollar Index trading 0.2% lower on daily charts and moving right above the 104.00 level, following a moderately positive opening, which pushed the DXY to session highs at 104.35.
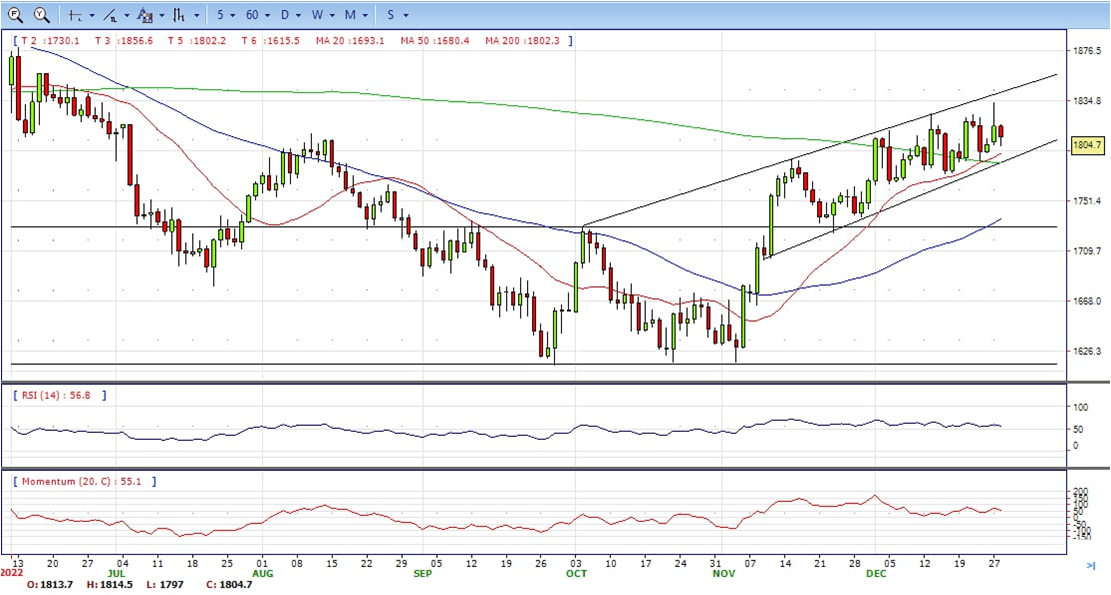
- Gold price stabilized around 1804, down for the day and bullish in the daily chart. The gold price still stabilized above 20 and 50 SMA, suggesting bullish strength in short term. Meanwhile, the 20 SMA continued accelerating north and developing above 50 SMA, indicating bulls not exhausted yet. On upside, the immediate resistance is 1838, break above this level will open the gate for more advance to 1858 area.
- From a technical perspective, the RSI indicator hold above the midline and stabilized around 55, suggesting bullish strength. The Momentum indicator stabilized above the midline, suggests upward potentials. On downside, the immediate support is 1784, below this area may resume the decline to 1784.


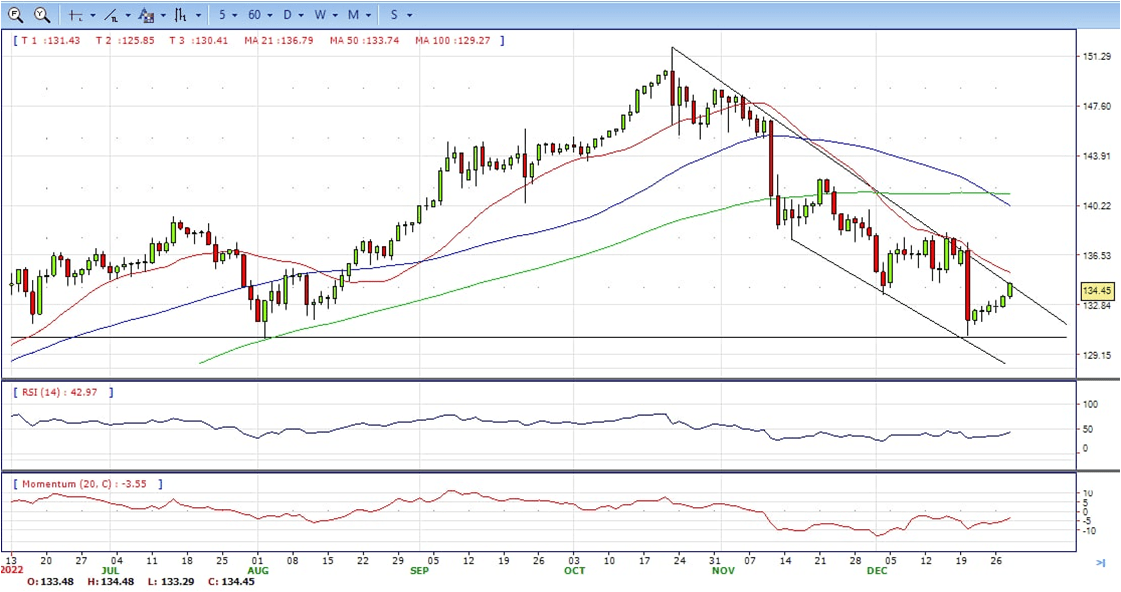
- The US Dollar has lost ground against the Japanese yen on Wednesday. The pair continued the advance after a solid market opening as the pair hit resistance at a one-week high of 134.50. It ended Wednesday near the top but still bearish in the daily chart.
- Market sentiment remains positive on Wednesday, boosted by the announcement that China is planning to scrap restrictions on inbound travelers, which is expected to trigger a strong rebound in the country’s economic growth.
- On the other hand, the Dollar is trading moderately lower in a thinned post-Christmas week. The US Dollar Index eases about 0.1% on the day, trading around 104.20 at the moment of writing, at a short distance to the six-month low at 103.40 seen two weeks ago.
- The USD/JPY pair stabilized around 134.45, up for the day and bearish in the daily chart. The price maintains the downward slope and develops below all main SMAs, suggests bearish strength in short term. Meanwhile, 20 SMA continued accelerating south and developing below longer ones, indicating bears not exhausted. On upside, overcome 134.60 may encourage bulls to challenge 135.70, break above that level will open the gate to 136.70.
- Technical indicators suggest the bearish strength. RSI stabilized around 44, while the Momentum indicator continued developing below the midline, suggests downward potentials. On downside, the immediate support is 133.40, break below this level will open the gate to 132.40 area.
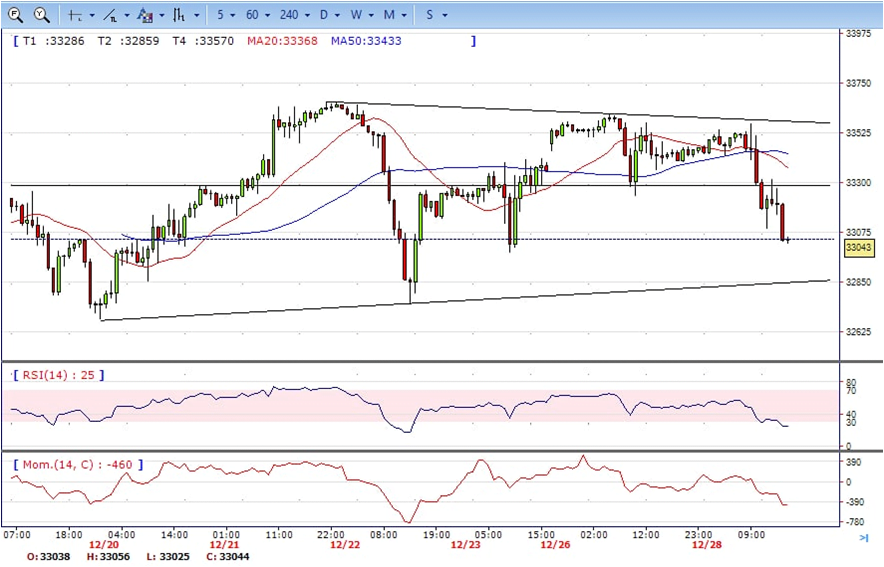
- DJI under the strong sell pressure, tumble from intraday high 33570 area to low 33025, lost more than 500 pips and end Wednesday near the bottom, down for the day and bearish in the daily chart. The price stabilize below 20 and 50 SMA, suggest bearish strength in short term. Meanwhile, 20 SMA continue accelerating south and developing below 50 SMA, suggest bears not exhausted yet. On upside, overcome 33300 may encourage bulls to challenge 33570, break above this level will open the gate to 34000.
- Technical indicators suggest the bearish strength. RSI stabilize at around 28, while the Momentum indicator stabilize in negative territory, suggest downward potentials. On downside, the immediate support is 33000, break below this level will open the gate for more decline to 32680 area.
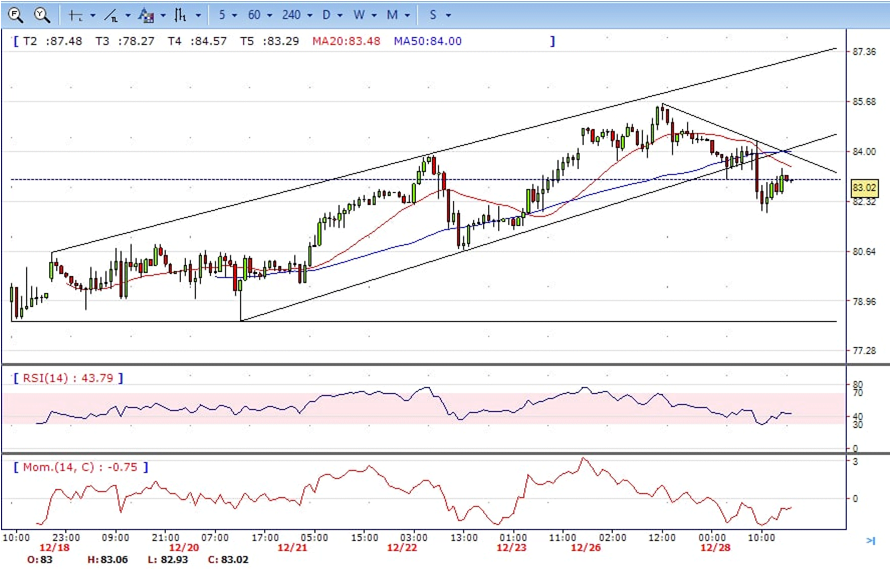
- Brent under the sell pressure, retreat from intraday high 85.00 area to low 81.92. It bounce from there and recover some losses and end Wednesday at around 83.20, down for the day and bearish in the hourly chart. The price stabilize below 20 SMA and 50 SMA, suggests bearish strength in short term. Meanwhile, the 20 SMA continue accelerating south and developing below 50 SMA, indicating bears not exhausted yet. On upside, overcome 84.40 may encourage bulls to challenge 85.60, break above this level will open the gate to 87.30.
- Technical indicators suggest the bearish movement, hovering below the midline. RSI stabilize at around 44, while the Momentum indicator stabilize in negative territory, suggest downward potentials. On downside, the immediate support is 81.90, break below this level will open the gate for more decline to 80.70 area.