03/07/2023 Daily Reports
- The EUR/USD rebounded further after US consumer inflation data and climbed above 1.0900, hitting fresh daily highs, boosted by a weaker US dollar. The greenback pulled back after the report, and commodities and US equities futures rose.
- The US Bureau of Economic Analysis reported on Friday that inflation, as measured by the change in PCE Price Index, fell to 3.8% YoY in May from 4.3% in April, below the market consensus of 4.6%. The Fed’s preferred measure, the Core PCE, also fell from 4.7% to 4.6%. As a result of the report, the US Dollar weakened. The DXY retreated from weekly highs above 103.50 towards 103.00, and US Treasury yields dropped back to neutral territory for the day. The US 10-year yield fell from three-month highs at 3.89% to 3.84%.
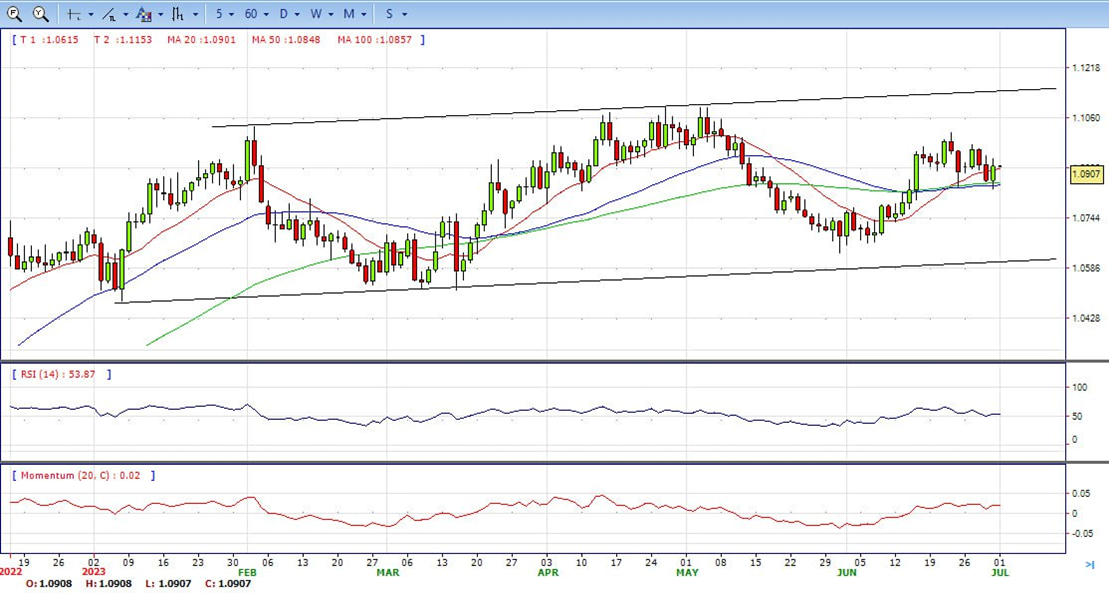
- The EUR/USD pair is trading near the 1.0900, up for the day with bullish stance in daily chart. The pair stabilized below 20 SMA, indicates bearish strength. However, the 20 SMA continued accelerating north and developing above 50 and 200 SMA, suggests bulls not exhausted yet. On upside, the immediate resistance is 1.0940, break above this level will extend the advance to 1.1010.
- Technical readings in the daily chart support the neutral to bullish stance. The RSI indicator stabilizes around 53. The Momentum indicator holds above the midline, indicating upward potentials. On downside, the immediate support is 1.0830 and below this level will open the gate to 1.0730.
- GBP/USD recovered lost ground on the last day of the week, month, and quarter, rising more than 0.80% after hitting a daily low of 1.2599. Upbeat data from the UK and inflation edging lower in the US boosted the Pound Sterling, set to finish the month with gains of 1.9%. At the time of writing, the GBP/USD is trading at 1.2700.
- The latest inflation report in the US eased some pressure on the Fed as the central bank struggles to curb sticky inflation. The Fed’s preferred gauge for inflation, the Core PCE, rose less than expected, coming at 0.3% MoM, below the prior’s month 0.4%, while annual-based figures diminished to 4.6% from 4.7%. Headline inflation rose by 3.8% YoY, below April’s 4.4%, while PCE climbed 0.1% month-over-month, lower than 0.4% in the previous report.
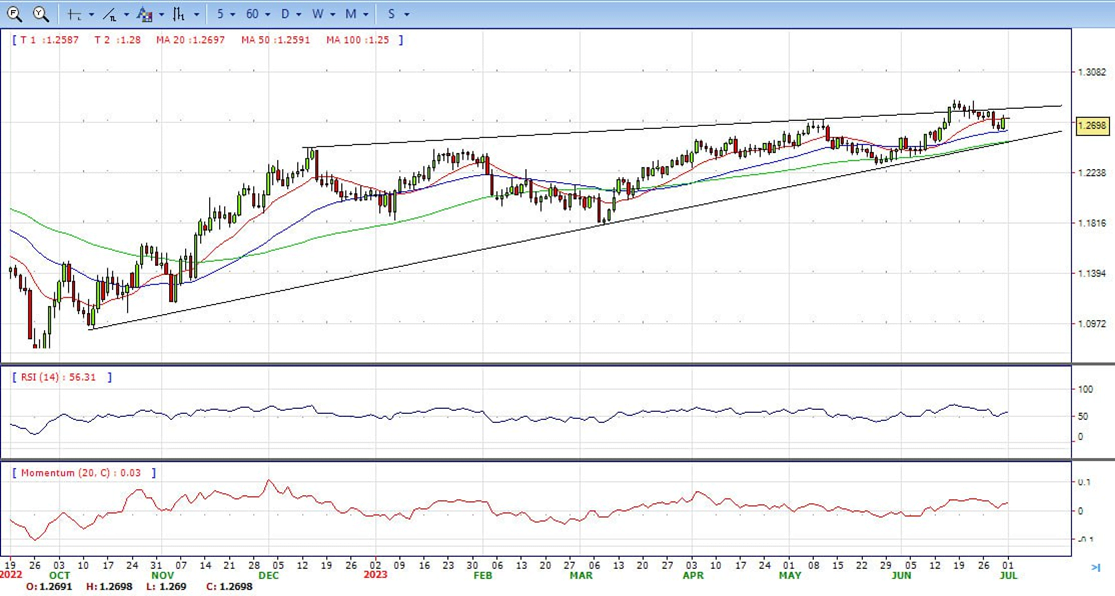
- The GBP/USD offers bullish stance in daily chart. Cable stabilizes above 20 and 50 SMA, indicating bullish strength in short term. Meanwhile, the 20 and 50 SMA continued accelerating north and developing above longer ones, suggests bulls not exhausted yet. On upside, the immediate resistance is 1.2730 with a break above it exposing to 1.2850.
- Technical readings in the daily chart support the bullish stances. RSI indicator stabilizes around 57, while the Momentum indicator stabilizes above the midline, suggesting upward potentials. On downside, the immediate support is 1.2590, unable to defend this level will resume the decline to 1.2480.


- On Friday, the gold spot XAU/USD traded with nearly 0.50% gains, jumping near the $1,920 area. Soft Personal Consumer Expenditures from the US fuelled a decline in US yields and, thereby, a weaker US Dollar, which boosted the yellow metal. Moreover, the Gold’s short-term trajectory will be determined by bets on the next Fed decision, which will have an impact with crucial labour market data to be released next week.
- After the US Bureau of Economic Analysis showed the Core PCE, the Federal Reserve’s preferred measure of inflation, unexpectedly decelerated to 4.6% YoY in May. As attention now shifts to labour market data, Investors are trying to decipher the next moves by the Fed after Chair Powell commented that FOMC foresee additional hikes, driven by a hot labour market.
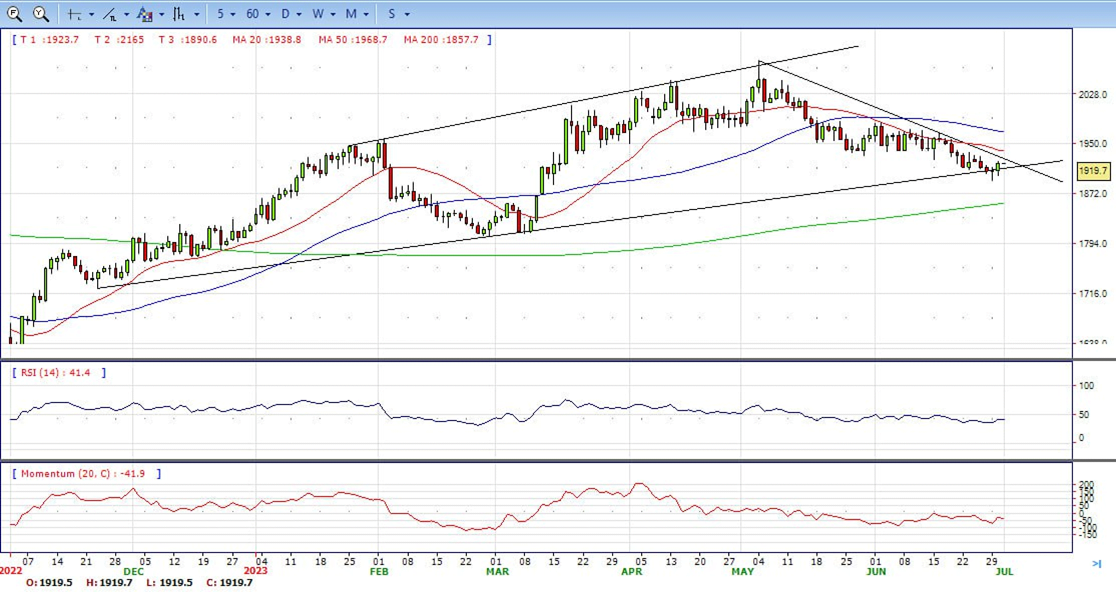
- Gold price stabilized around 1920, up for the day and bearish in the daily chart. The gold price stabilizes below 20 SMA, suggesting bearish strength in short term. Meanwhile, the 20 SMA continued accelerating south and developing below 50 SMA, indicates bears not exhausted yet. On upside, the immediate resistance is 1922, break above this level will open the gate for more advance to 1938 area.
- From a technical perspective, the RSI indicator holds below the midline and stabilizes around 41, on a bearish strength. While the Momentum indicator also stabilized in the negative territory, suggests downward potentials. On downside, the immediate support is 1890, below this area may resume the decline to 1860.


- USD/JPY retreats from YTD high at 145.07 as Japanese authorities warned that “excessive yen weakening” could trigger action by Japanese authorities. That spooked USD/JPY buyers, which have been riding a rally that witnessed a 13% depreciation of the JPY during the year. The USD/JPY is trading at 144.29, down 0.31%, as Wall Street closes.
- The US Dollar remains pressured by an inflation report released by the Department of Commerce. The US Federal Reserve (Fed) preferred gauge for inflation, the Core PCE eased from highs around 4.7% YoY to 4.6% in May, while headline PCE decelerated at a faster pace, with monthly data slowing to 0.1% from 0.4% in April, and annually based numbers at 3.8% from 4.4%.
- The USD/JPY pair stabilized around 144.29, down for the day and bullish in the daily chart. The price stabilizes above 20 and 50 SMA, suggests bullish strength in short term. Meanwhile, 20 SMA continued accelerating north and developing above longer ones, indicating bulls not exhausted. On upside, overcome 145.00 may encourage bulls to challenge 146.60, break above that level will open the gate to 148.80.
- Technical indicators suggest the bullish strength. RSI stabilizes around 70, while the Momentum indicator stabilizes above the midline, suggests upward potentials. On downside, the immediate support is 144.00, break below this level will open the gate to 142.60 area.

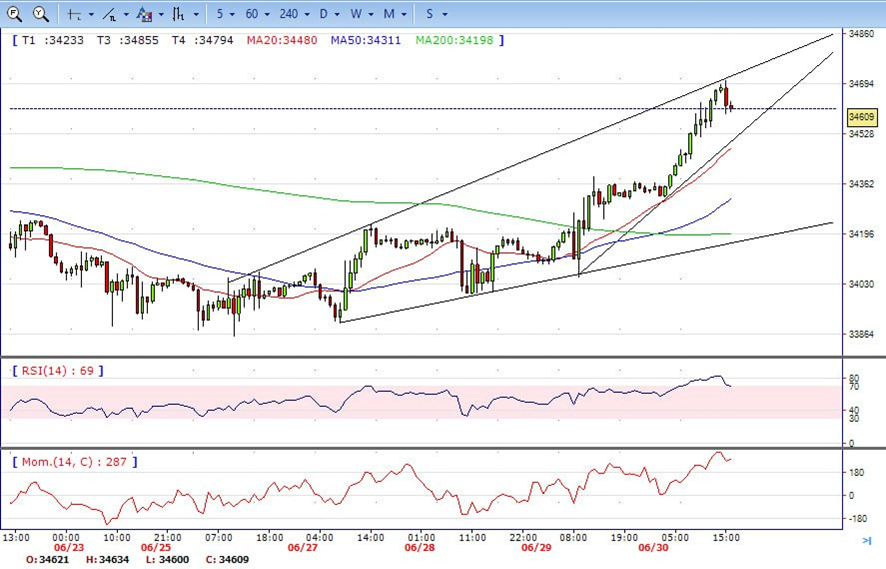
- DJI continued the advance on Friday, traded from intraday low 34350 level to high 34705. It ended the day around 34610, up on the day and stabilized above all main SMAs, suggests bullish strength. Meanwhile, 20 and 50 SMA continued accelerating north and heading towards 200 SMA, suggests bulls not exhausted yet. On upside, overcome 34710 may encourage bulls to challenge 34900, break above that level will open the gate to 35230.
- Technical indicators suggest the bullish movement. RSI stabilizes around 69, while the Momentum indicator stabilizes above the midline, suggests upward potentials. On downside, the immediately support is 34300, break below this level will open the gate for more decline to 34000 area.
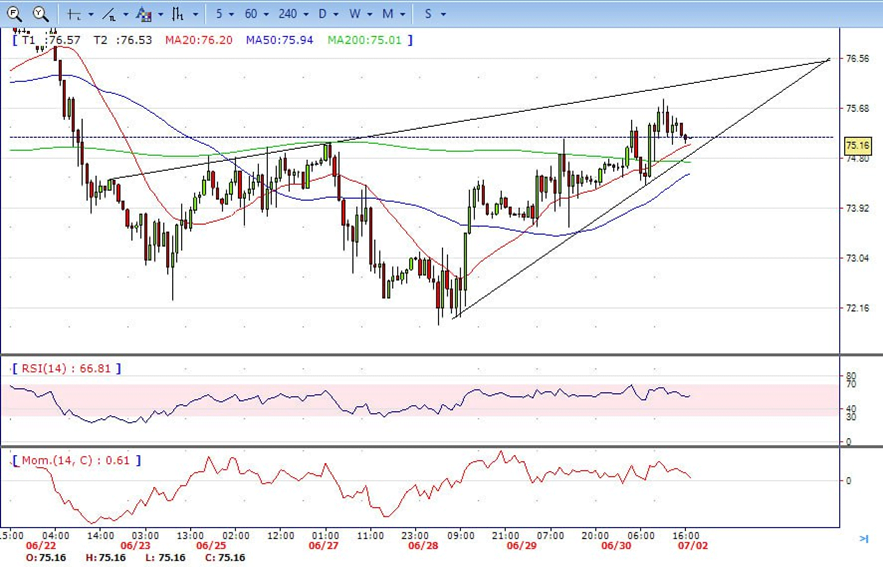
- Brent consolidated with gains on Friday, traded from intraday low 74.30 level to high 75.90. It then retreated modestly and ended the day around 75.15, up for the day and stabilized above 20 SMA, indicates bullish sign in the hourly chart. Meanwhile, the 20 SMA continued accelerating north and heading towards longer ones, indicates bulls not exhausted yet. On upside, overcome 76.00 may encourage bulls to challenge 77.30, break above that level will open the gate to 78.00.
- Technical indicators suggest bullish movement, hovering above the midline. RSI stabilizes at 55, while the Momentum indicator stabilizes in positive territory, suggests upward potentials. On downside, the immediately support is 74.30, break below this level will open the gate for more decline to 73.40 area.