04/07/2023 Daily Reports
- At the start of the new trading week, the Euro manages to bounce off earlier lows and encourages EUR/USD to retake the 1.0900 yardstick and above as markets in the old continent draw to a close on Monday.
- Meanwhile, the US Dollar gives away part of the earlier move higher and returns to the sub-103.00 region when tracked by the USD Index, all against the backdrop of declining US yields across the curve, the improvement in the appetite for the risk-linked galaxy and ahead of the Independence Day holiday on Tuesday.
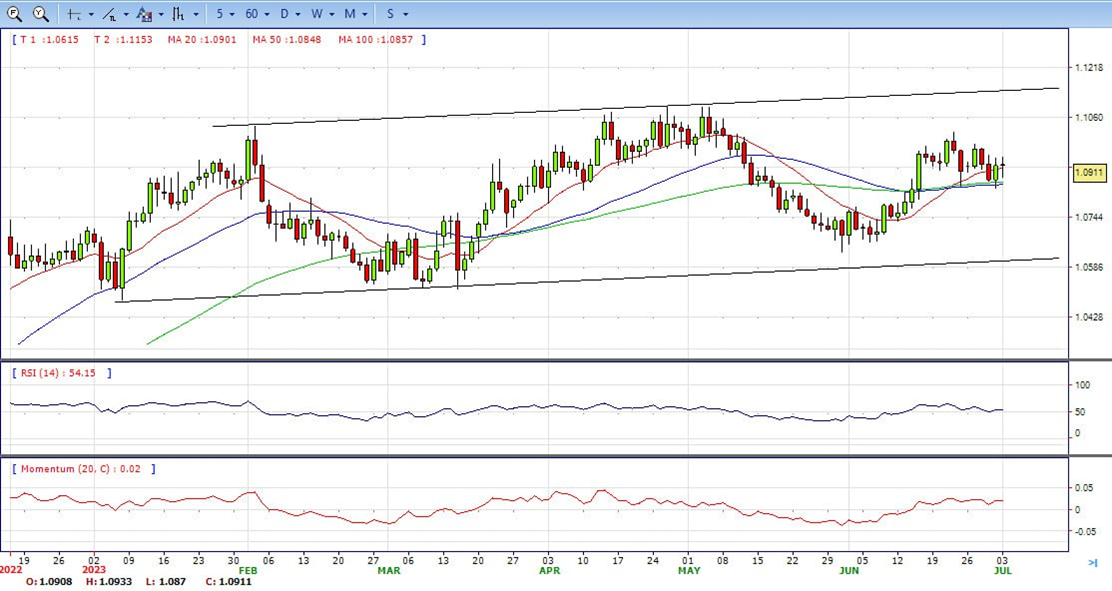
- The EUR/USD pair is trading near the 1.0910, slightly up for the day with bullish stance in daily chart. The pair stabilized below 20 SMA, indicates bearish strength. However, the 20 SMA continued accelerating north and developing above 50 and 200 SMA, suggests bulls not exhausted yet. On upside, the immediate resistance is 1.0940, break above this level will extend the advance to 1.1010.
- Technical readings in the daily chart support the neutral to bullish stance. The RSI indicator stabilizes around 53. The Momentum indicator holds above the midline, indicating upward potentials. On downside, the immediate support is 1.0830 and below this level will open the gate to 1.0730.
- GBP/USD stayed firm at the beginning of the year’s second half, at around the 1.2690s area; post-data release in the US showed manufacturing activity slowed down. Meanwhile, UK data portrayed a slight improvement but remained in recessionary territory. At the time of writing, the GBP/USD is trading at 1.2690, almost unchanged.
- ISM revealed its June Manufacturing PMI poll, which showed that business activity is deteriorating further, as data stood at contractionary territory at 46.0, below May’s 46.9 and estimates of 47.0. The data highlighted that input prices continued to slow down, signalling inflation edges down amidst 500 basis points of rate increases by the US Federal Reserve.
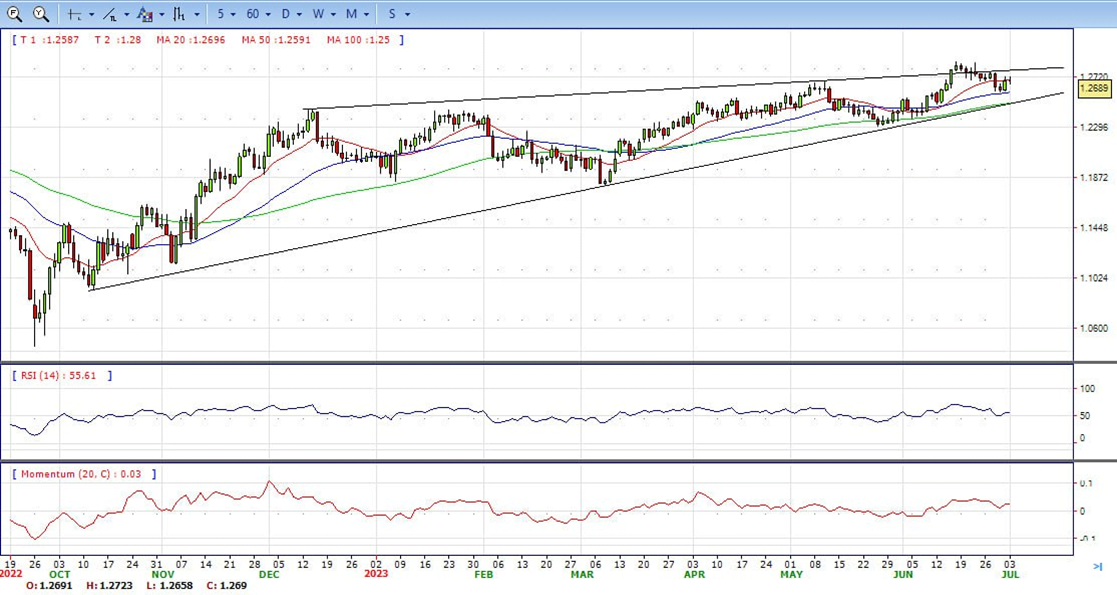
- The GBP/USD offers bullish stance in daily chart. Cable stabilizes above 20 and 50 SMA, indicating bullish strength in short term. Meanwhile, the 20 and 50 SMA continued accelerating north and developing above longer ones, suggests bulls not exhausted yet. On upside, the immediate resistance is 1.2730 with a break above it exposing to 1.2850.
- Technical readings in the daily chart support the bullish stances. RSI indicator stabilizes around 57, while the Momentum indicator stabilizes above the midline, suggesting upward potentials. On downside, the immediate support is 1.2590, unable to defend this level will resume the decline to 1.2480.


- Following the release of weaker-than-expected US economic data, Gold price jumped to $1,931, reaching the highest level in a week. The weaker data triggered a decline of the US Dollar and boosted Treasury bonds. Following the report, XAU/USD jumped to $1,931 but failed to hold above $1,930. It is currently hovering around $1,921, almost unchanged for the day.
- The US ISM Manufacturing PMI dropped from 46.9 to 46.0, falling short of expectations for a modest recovery to 47.2. The Prices Paid Index also fell, declining from 44.2 to 41.8, while Employment dropped from 51.4 to 41.8. These numbers indicate ongoing problems in the manufacturing sector and softer price pressures, which weighed on the US dollar. As a result, the DXY fell to 102.75, testing Friday’s lows, while the 10-year US bond yield pulled back from 3.86% and bottomed at 3.78%.
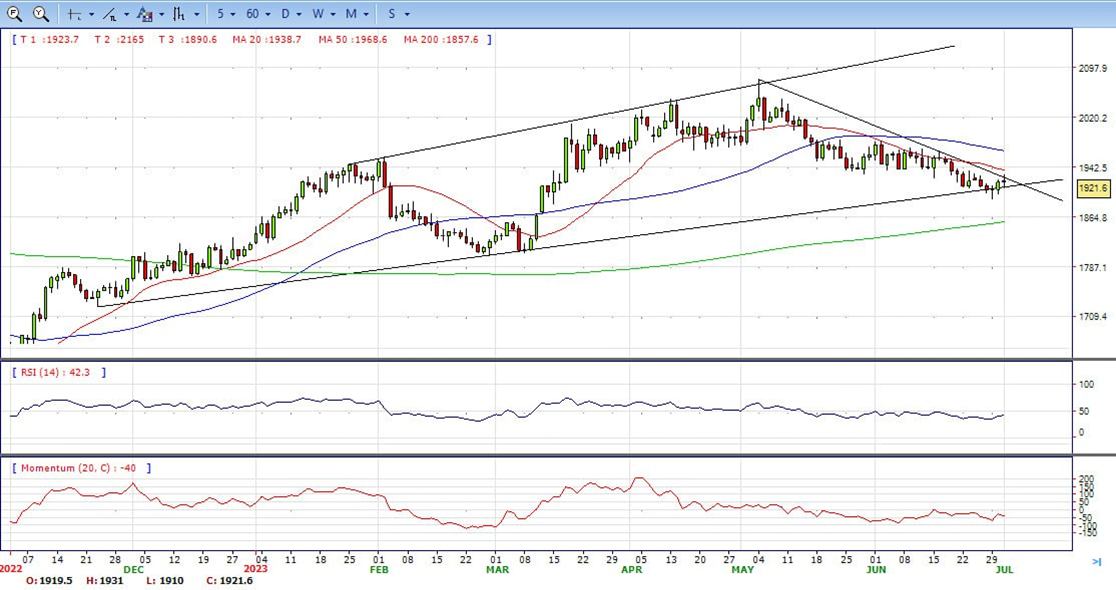
- Gold price stabilized around 1921, unchanged for the day and bearish in the daily chart. The gold price stabilizes below 20 SMA, suggesting bearish strength in short term. Meanwhile, the 20 SMA continued accelerating south and developing below 50 SMA, indicates bears not exhausted yet. On upside, the immediate resistance is 1922, break above this level will open the gate for more advance to 1938 area.
- From a technical perspective, the RSI indicator holds below the midline and stabilizes around 43, on a bearish strength. While the Momentum indicator also stabilized in the negative territory, suggests downward potentials. On downside, the immediate support is 1890, below this area may resume the decline to 1860.


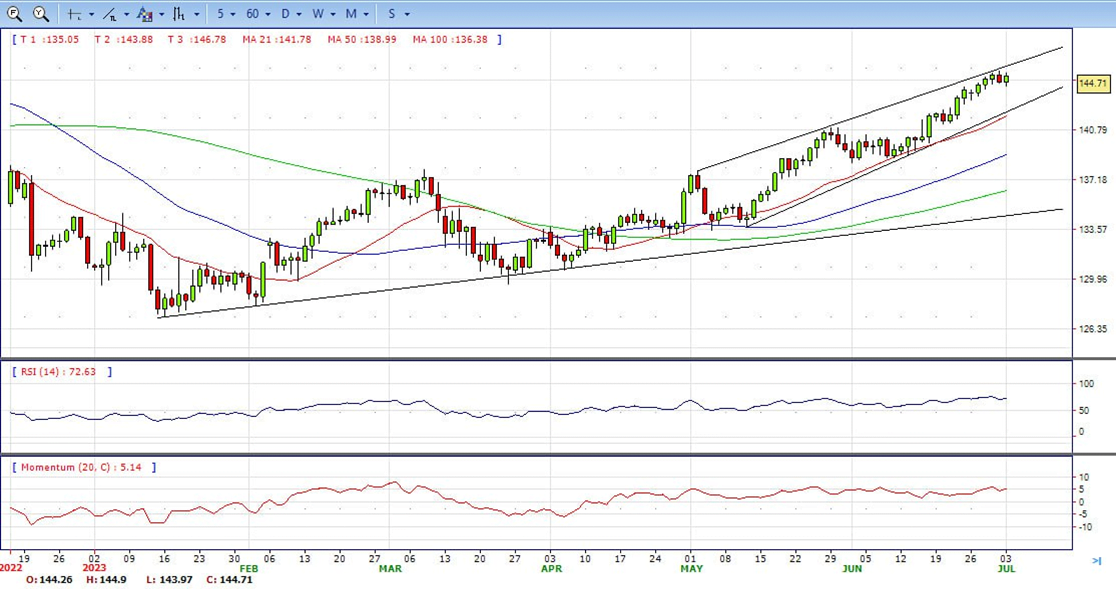
- USD/JPY is up some 0.3% on the day trading at around 144.70 having travelled up from a low of 143.98 to a high of 144.91 so far. At this juncture, the Yen that’s under intervention watch after the Japanese finance minister warned last week of excessive moves in the currency market.
- Data on the day in the US from the Institute for Supply Management showed that manufacturing PMI dropped to 46.0 from 46.9 in May, the lowest reading since May 2020. It marked the eighth straight month that the PMI has been below the 50 threshold indicating contraction. Consequently, USD/JPY’s current bullish trend could continue to decelerate as we have seen over the last few days.
- The USD/JPY pair stabilized around 144.70, up for the day and bullish in the daily chart. The price stabilizes above 20 and 50 SMA, suggests bullish strength in short term. Meanwhile, 20 SMA continued accelerating north and developing above longer ones, indicating bulls not exhausted. On upside, overcome 145.00 may encourage bulls to challenge 146.60, break above that level will open the gate to 148.80.
- Technical indicators suggest the bullish strength. RSI stabilizes around 72, while the Momentum indicator stabilizes above the midline, suggests upward potentials. On downside, the immediate support is 144.00, break below this level will open the gate to 142.60 area.
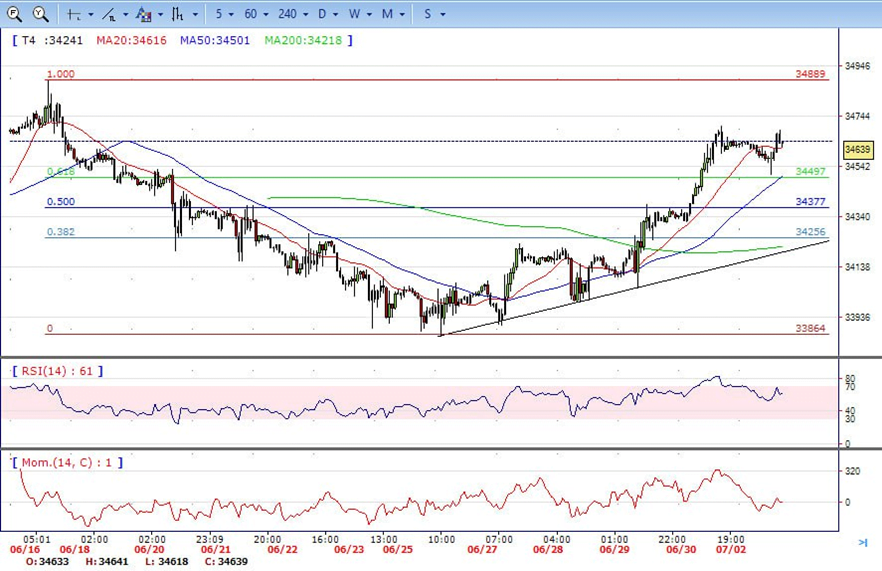
- DJI consolidated in the familiar range on Monday due to US holiday, traded from intraday low 34510 level to high 34688. It ended the day around 34640, unchanged for the day and stabilized above all main SMAs, suggests bullish strength. Meanwhile, 20 and 50 SMA continued accelerating north and heading towards 200 SMA, suggests bulls not exhausted yet. On upside, overcome 34710 may encourage bulls to challenge 34900, break above that level will open the gate to 35230.
- Technical indicators suggest the bullish movement. RSI stabilizes around 61, while the Momentum indicator stabilizes above the midline, suggests upward potentials. On downside, the immediately support is 34300, break below this level will open the gate for more decline to 34000 area.
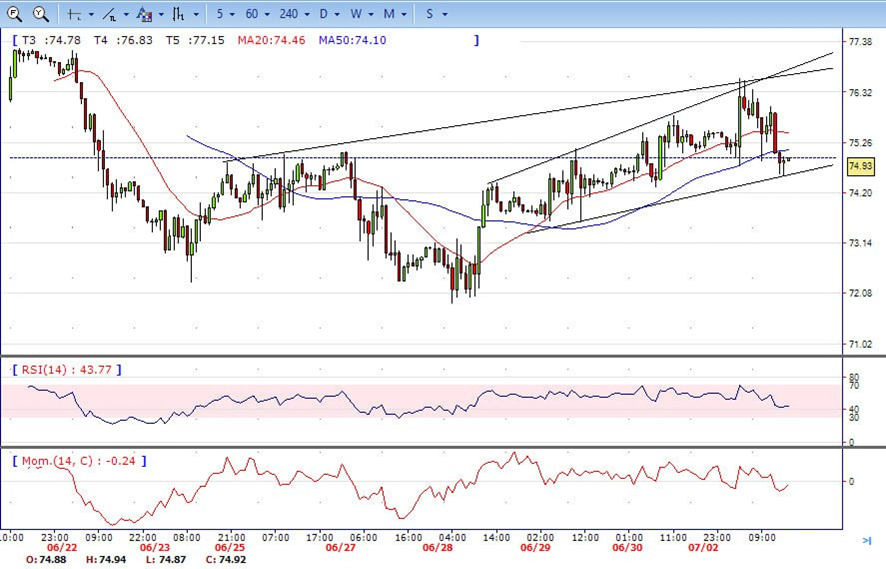
- Brent jumped to high 76.60 on Monday, but failed to hold the gains and back to 74.95 to end the day. Currently, the price stabilized below 20 SMA, indicates bearish sign in the hourly chart. Meanwhile, the 20 SMA started turning south and heading towards longer ones, indicates bears not exhausted yet. On upside, overcome 76.60 may encourage bulls to challenge 77.30, break above that level will open the gate to 78.00.
- Technical indicators suggest bearish movement, hovering below the midline. RSI stabilizes at 44, while the Momentum indicator stabilizes in negative territory, suggests downward potentials. On downside, the immediately support is 74.30, break below this level will open the gate for more decline to 73.40 area.