30/06/2023 Daily Reports
- The Euro now rapidly gives away the earlier optimism and forces EUR/USD to accelerate the breakdown of the 1.0900 hurdle and print new lows for the current week in the 1.0860 zone on Thursday.
- Indeed, the pair makes another U-turn, this time to the downside, as better-than-estimated results from US fundamentals lend unexpected legs to the Greenback and lift the USD Index to new 2-week peaks near 103.40. The now sour sentiment in the risk complex comes after central bank chiefs expressed hawkish sentiments at the ECB Forum in Portugal on Wednesday, highlighting that current policy measures are still not adequately restrictive. Despite this, the market appears to be at ease with the belief that the Fed will implement two additional interest rate hikes, potentially back-to-back, signalling the nearing conclusion of the tightening cycle.
- The EUR/USD pair is trading near the 1.0870, down for the day with bullish stance in daily chart. The pair stabilized below 20 SMA, indicates bearish strength. However, the 20 SMA continued accelerating north and developing above 50 and 200 SMA, suggests bulls not exhausted yet. On upside, the immediate resistance is 1.0940, break above this level will extend the advance to 1.1010.
- Technical readings in the daily chart support the neutral to bullish stance. The RSI indicator stabilizes around 50. The Momentum indicator holds above the midline, indicating upward potentials. On downside, the immediate support is 1.0840 and below this level will open the gate to 1.0800.

- GBP/USD drops sharply in the North American session following the release of outstanding data in the US, painting an optimistic economic outlook and cementing the case for additional tightening by the US Fed. Therefore, the greenback is rising, underpinned by elevated US Treasury bond yields. At the time of writing, the GBP/USD is trading at 1.2614, down 0.18%.
- The US Dollar is the primary driver of the session as data continues to surprise market participants. The US’s Gross Domestic Product was revised upwards to a 2% YoY advance, above estimates of 1.3%. At the same time, a measure of the jobs market, Initial Jobless Claims dropped the most in 20 months, to 239K, below estimates of 265K, which could trigger another hike by the Fed to cool demand.
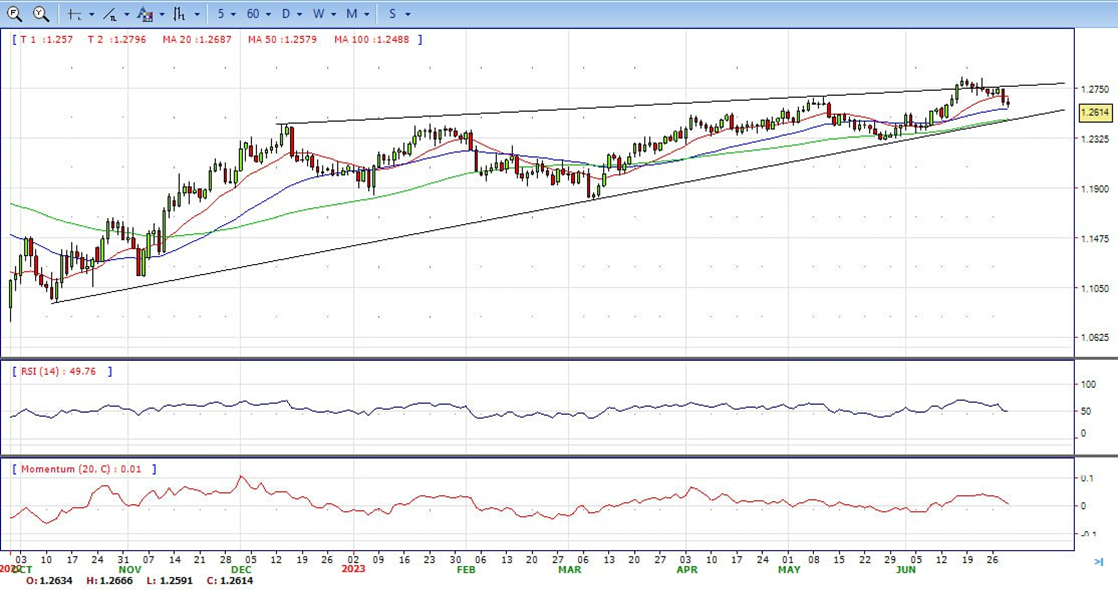
- The GBP/USD offers neutral stance in daily chart. Cable stabilizes between 20 and 50 SMA, indicating neutral strength in short term. Meanwhile, the 20 and 50 SMA started turning flat but continued developing above longer ones, suggests bulls not exhausted yet. On upside, the immediate resistance is 1.2700 with a break above it exposing to 1.2850.
- Technical readings in the daily chart support the neutral stances. RSI indicator stabilizes around 50, while the Momentum indicator stabilizes near the midline, suggesting directionless potentials. On downside, the immediate support is 1.2590, unable to defend this level will resume the decline to 1.2480.


- Gold price recovers some ground after sliding below the $1900 figure for the first time since March 15, 2023, gains some 0.09%, after upbeat economic data from the US increased speculations the Fed would proceed with additional rate hikes. The XAU/USD is trading at $1908 after hitting a daily low of $1893.
- The US economic calendar revealed outstanding figures for the US economy. The GDP for the first quarter was upward revised from 1.3% to 2%, while jobs data reflected the robustness of the labor market. Initial Jobless Claims for the week ending June 24 came at 239K, well below estimates of 265K, snapping three weeks of readings above the 260K mark.
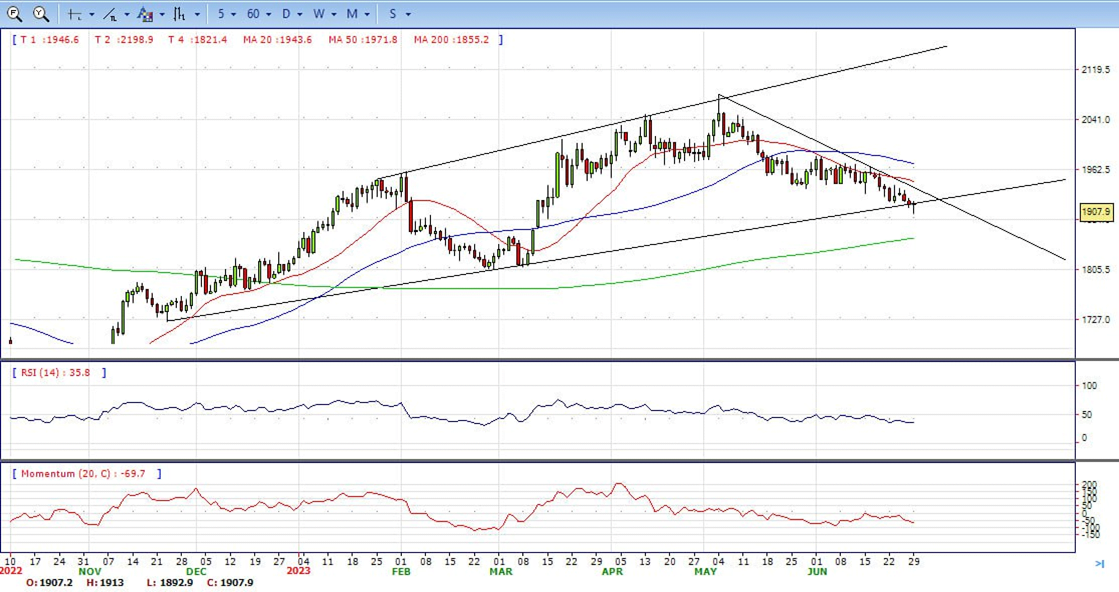
- Gold price stabilized around 1908, down for the day and bearish in the daily chart. The gold price stabilizes below 20 SMA, suggesting bearish strength in short term. Meanwhile, the 20 SMA continued accelerating south and developing below 50 SMA, indicates bears not exhausted yet. On upside, the immediate resistance is 1917, break above this level will open the gate for more advance to 1938 area.
- From a technical perspective, the RSI indicator holds below the midline and stabilizes around 36, on a bearish strength. While the Momentum indicator also stabilized in the negative territory, suggests downward potentials. On downside, the immediate support is 1890, below this area may resume the decline to 1860.


- The USD/JPY pair is moving towards 145.00, trading at its highest level since mid-November. The US Dollar was boosted by positive data, while Treasury bonds experienced a sell-off.
- On Thursday, data showed an upward revision to US growth figures in Q1 GDP from 1.3% to 2%. The weekly Jobless Claims report showed Initial Claims dropped more than expected to the lowest level in four weeks at 239K. These figures added to recent evidence of a robust US economy and raised expectations of more rate hikes from the Federal Reserve. On Friday, consumer inflation data is due.
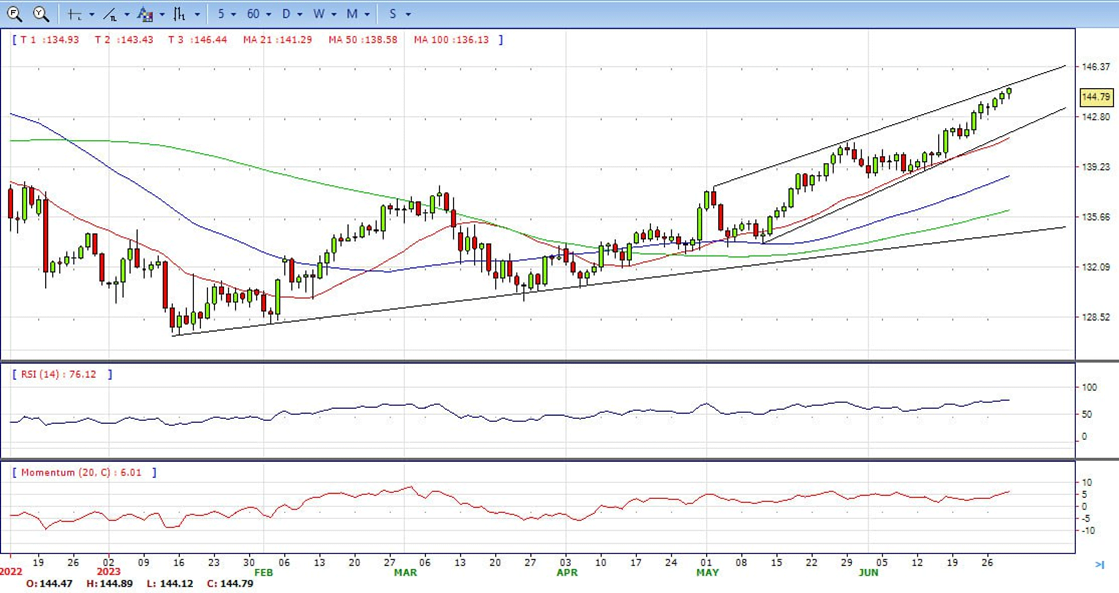
- The USD/JPY pair stabilized around 144.80, up for the day and bullish in the daily chart. The price stabilizes above 20 and 50 SMA, suggests bullish strength in short term. Meanwhile, 20 SMA continued accelerating north and developing above longer ones, indicating bulls not exhausted. On upside, overcome 145.00 may encourage bulls to challenge 146.60, break above that level will open the gate to 148.80.
- Technical indicators suggest the bullish strength. RSI stabilizes around 75, while the Momentum indicator stabilizes above the midline, suggests upward potentials. On downside, the immediate support is 144.00, break below this level will open the gate to 142.60 area.
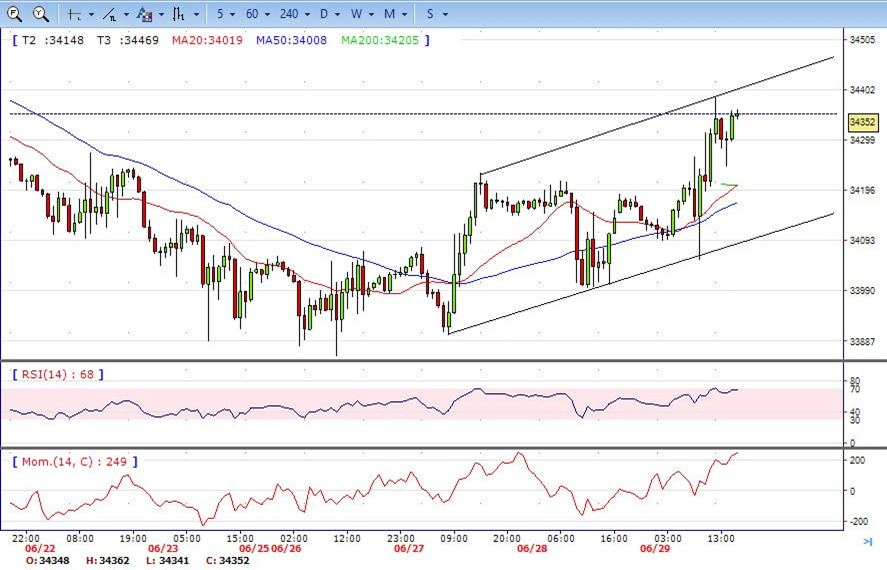
- DJI continued the advance on Thursday, traded from intraday low 34050 level to high 34387. It ended the day around 34340, up on the day and stabilized above all main SMAs, suggests bullish strength. Meanwhile, 20 and 50 SMA continued accelerating north and heading towards 200 SMA, suggests bulls not exhausted yet. On upside, overcome 34400 may encourage bulls to challenge 34600, break above that level will open the gate to 34900.
- Technical indicators suggest the bullish movement. RSI stabilizes around 67, while the Momentum indicator stabilizes above the midline, suggests upward potentials. On downside, the immediately support is 34250, break below this level will open the gate for more decline to 34000 area.
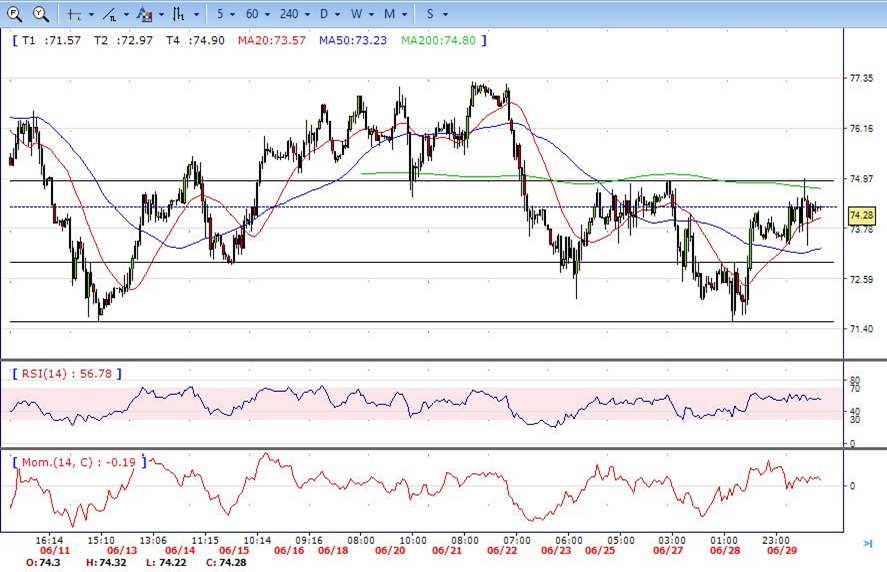
- Brent consolidated in the familiar range on Thursday, traded from intraday low 73.40 level to high 75.00. It then retreated modestly and ended the day around 74.30, up for the day and stabilized above 20 SMA, indicates bullish sign in the hourly chart. Meanwhile, the 20 SMA continued accelerating north and heading towards longer ones, indicates bulls not exhausted yet. On upside, overcome 74.20 may encourage bulls to challenge 75.00, break above that level will open the gate to 76.00.
- Technical indicators suggest bullish movement, hovering above the midline. RSI stabilizes at 57, while the Momentum indicator stabilizes in positive territory, suggests upward potentials. On downside, the immediately support is 73.40, break below this level will open the gate for more decline to 71.50 area.