29/06/2023 Daily Reports
- EUR/USD snaps two days of straight gains drop on hawkish remarks by the US Fed Chair Jerome Powell, who shared a panel with the ECB President Christine Lagarde. Even though both policymakers struck hawkish remarks, the greenback finished with the upper hand. At the time of writing, the EUR/USD is trading at 1.0918, down 0.40%, after hitting a weekly high of 1.0976 on Tuesday.
- Wall Street is trading mixed, with the Dow Jones being the outlier, registering losses of 0.15%. Fed Chair Powell and ECB’s Lagarde shared a panel on Wednesday where policymakers talked about monetary policy. The ECB President Christine Lagarde said there is ground to cover, and if the baseline scenario stands, the European Central Bank will pull the trigger in July. She added that core inflation was not dropping as expected and did not comment on the September meeting.
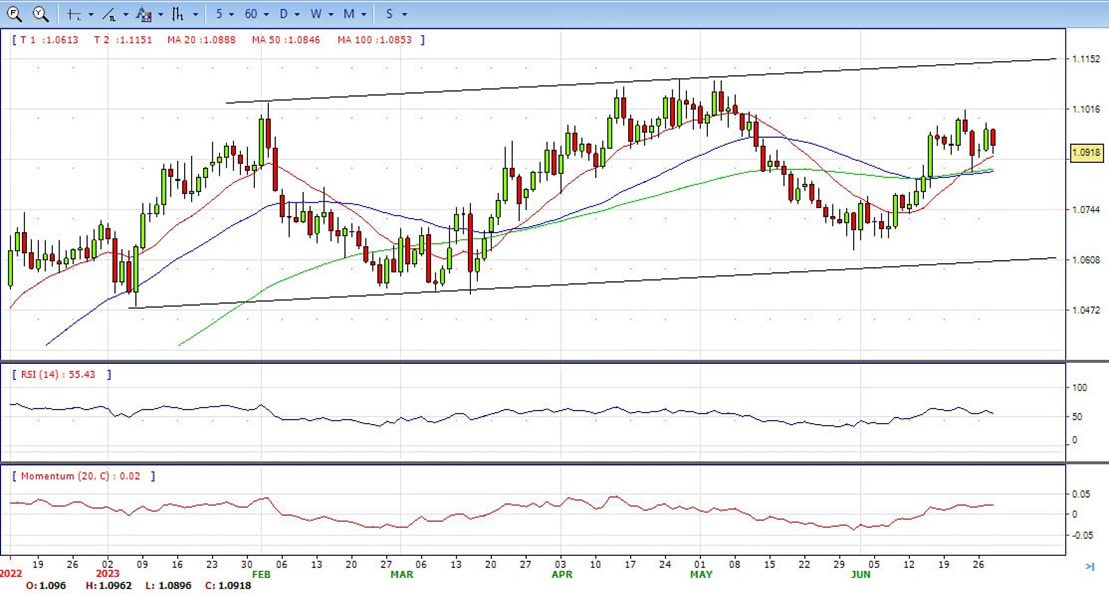
- The EUR/USD pair is trading near the 1.0920, down for the day with bullish stance in daily chart. The pair stabilized above all main SMAs, indicates bullish strength. Meanwhile, the 20 SMA continued accelerating north and heading towards 50 and 200 SMA, suggests bulls not exhausted yet. On upside, the immediate resistance is 1.1010, break above this level will extend the advance to 1.1100.
- Technical readings in the daily chart support the bullish stance. The RSI indicator stabilizes around 55. The Momentum indicator holds above the midline, indicating upward potentials. On downside, the immediate support is 1.0840 and below this level will open the gate to 1.0800.
- The Pound Sterling has displayed a vertical fall as investors are worried that the continuation of policy tightening by the BoE would further dampen the economic outlook of the United Kingdom. The GBP/USD pair is going through a rough phase as more interest rate hikes by the BoE are reasonable considering that UK’s inflation is showing no signs of softening.
- The speech from BoE Governor Andrew Bailey will remain in focus as investors are keen to know the consequences of higher interest rates on the United Kingdom economy and cues about the interest rate guidance. In comparison with developed economies, inflationary pressures in the British economy are extremely persistent and investors are losing their confidence in BoE policymakers and government.
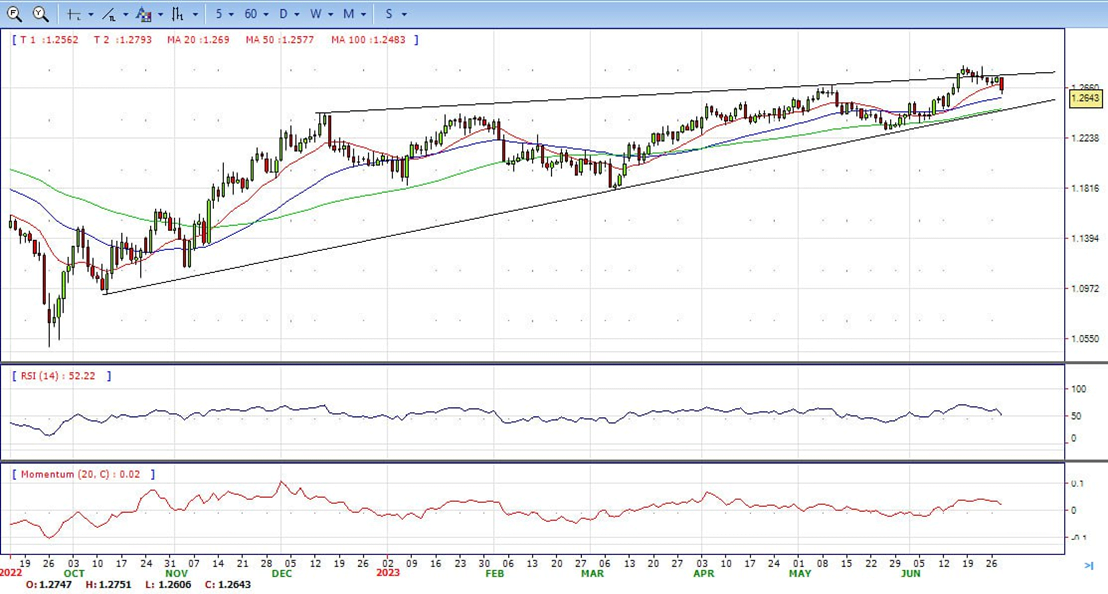
- The GBP/USD offers neutral to bullish stance in daily chart. Cable stabilizes between 20 and 50 SMA, indicating neutral strength in short term. Meanwhile, the 20 and 50 SMA started turning flat but continued developing above longer ones, suggests bulls not exhausted yet. On upside, the immediate resistance is 1.2700 with a break above it exposing to 1.2850.
- Technical readings in the daily chart support the neutral to bullish stances. RSI indicator stabilizes around 50, while the Momentum indicator stabilizes above the midline, suggesting upward potentials. On downside, the immediate support is 1.2600, unable to defend this level will resume the decline to 1.2480.


- Gold price has challenged the crucial support of $1,910.00 in the US session. The precious metal is declining towards the psychological support of $1,900.00 as investors are expecting hawkish interest rate guidance from Federal Reserve chair Jerome Powell.
- Fed Chair Powell said that policy “has not been restrictive for long,” emphasizing that most of the dot plot still sees two more increases. He added, “US economy is quite resilient and latest data consistent with that” and added the Fed needs to see more softening in the labor market. His comments boosted the greenback, as the US Dollar Index climbs 0.45%, at 102.970 shy of piercing the 103.000 marl. Meanwhile, expectations for a 25 bps rate hike in July jumped, as shown by the CME FedWatch Tool, with odds at 84.3%, above June’s 27 76.9%.
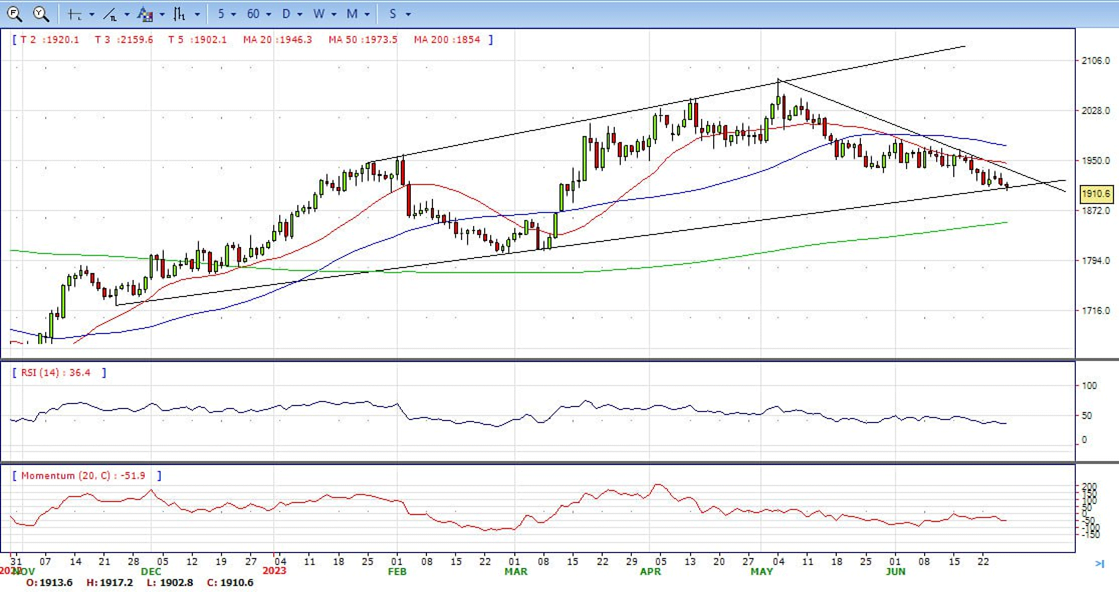
- Gold price stabilized around 1910, down for the day and bearish in the daily chart. The gold price stabilizes below 20 SMA, suggesting bearish strength in short term. Meanwhile, the 20 SMA continued accelerating south and developing below 50 SMA, indicates bears not exhausted yet. On upside, the immediate resistance is 1938, break above this level will open the gate for more advance to 1960 area.
- From a technical perspective, the RSI indicator holds below the midline and stabilizes around 37, on a bearish strength. While the Momentum indicator also stabilized in the negative territory, suggests downward potentials. On downside, the immediate support is 1900, below this area may resume the decline to 1885.


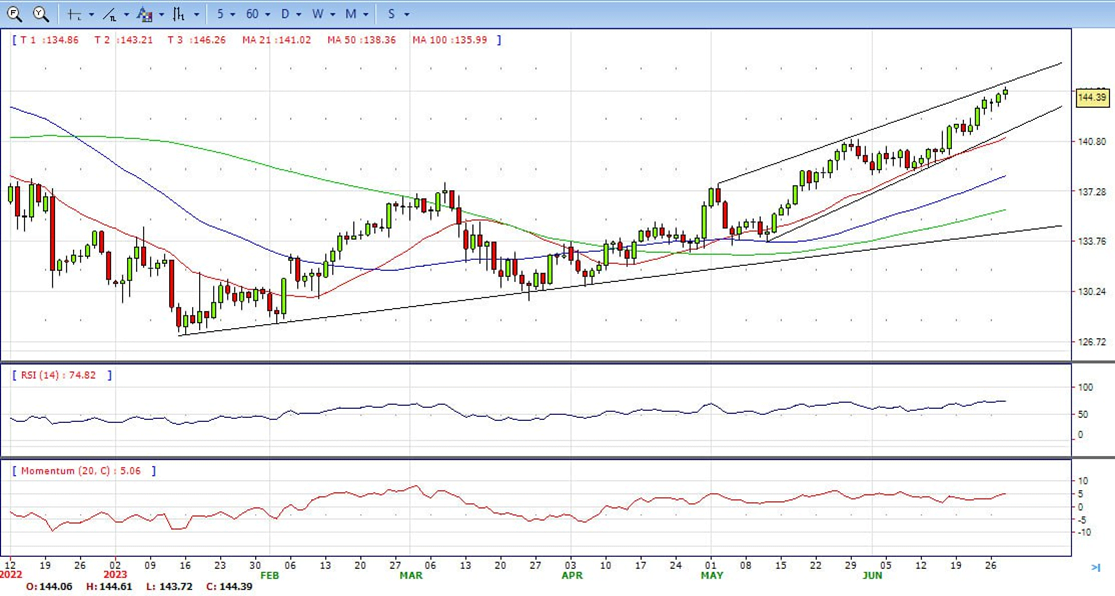
- The USD/JPY is rising swiftly towards the crucial resistance of 145.00 in the early New York session. The asset has been fuelled with immense strength as the US Dollar Index has printed a fresh three-day high at 102.90.
- The US Dollar Index has jumped strongly supported by hawkish guidance from Fed Powell and firmer US Durable Goods Orders data. US Census Bureau reported that Durable Goods Orders have expanded by 1.7% while the street was anticipating a contraction of 1%. May’s Durables data has outperformed April’s figure of 1.2%.
- The USD/JPY pair stabilized around 144.40, up for the day and bullish in the daily chart. The price stabilizes above 20 and 50 SMA, suggests bullish strength in short term. Meanwhile, 20 SMA continued accelerating north and developing above longer ones, indicating bulls not exhausted. On upside, overcome 145.00 may encourage bulls to challenge 146.60, break above that level will open the gate to 148.80.
- Technical indicators suggest the bullish strength. RSI stabilizes around 74, while the Momentum indicator stabilizes above the midline, suggests upward potentials. On downside, the immediate support is 142.60, break below this level will open the gate to 141.20 area.
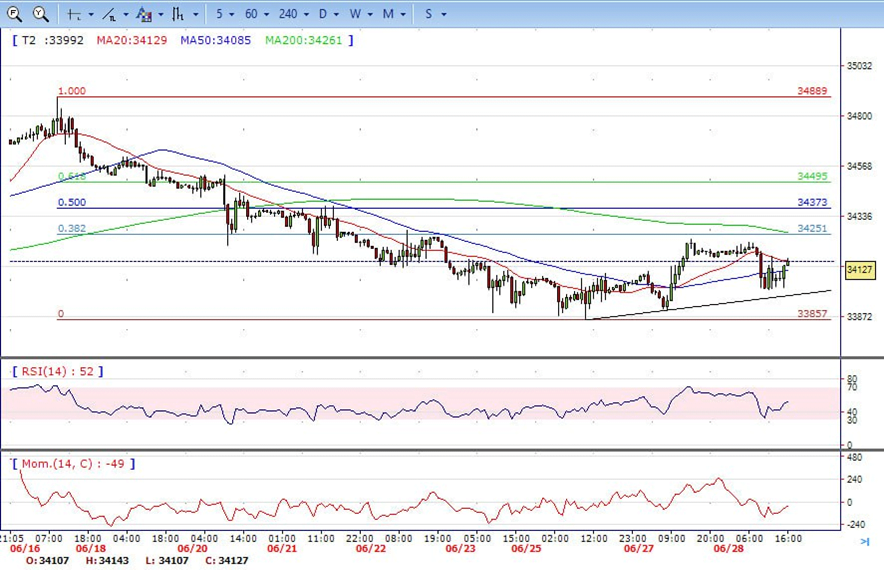
- DJI consolidated with mild losses on Wednesday, traded from intraday high 34230 level to low 34000. It ended the day around 34130, modestly down and stabilized between 50 and 200 SMA, suggests neutral strength. However, 20 SMA started turning south and continued developing below 200 SMA, suggests bears not exhausted yet. On upside, overcome 34250 may encourage bulls to challenge 34400, break above that level will open the gate to 34530.
- Technical indicators suggest the neutral to bearish movement. RSI stabilizes around 52, while the Momentum indicator stabilizes below the midline, suggests downward potentials. On downside, the immediately support is 34000, break below this level will open the gate for more decline to 33850 area.
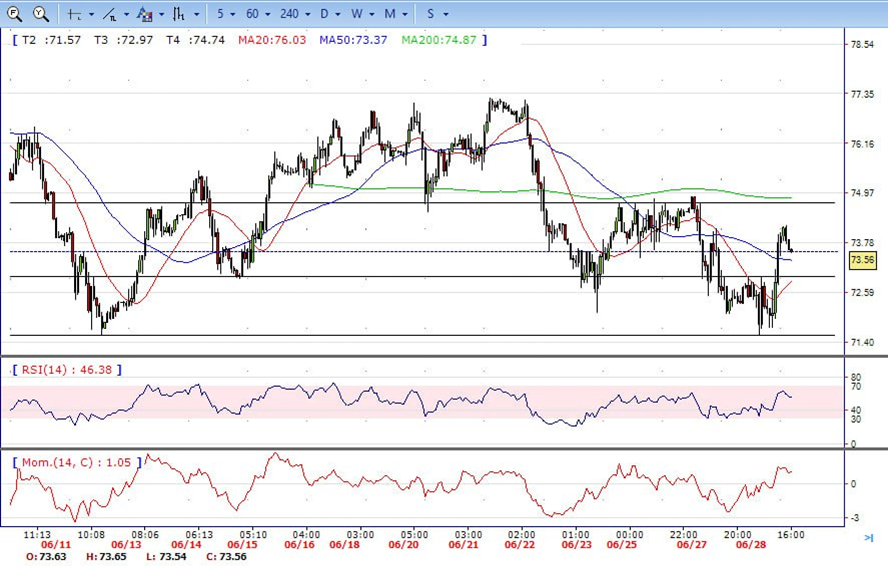
- Brent made a strong rally, climbed from intraday low 71.50 level to high 74.20. It then retreated modestly and ended the day around 73.55, up for the day and stabilized above 20 SMA, indicates bullish sign in the hourly chart. Meanwhile, the 20 SMA started turning north and heading towards longer ones, indicates bulls not exhausted yet. On upside, overcome 74.20 may encourage bulls to challenge 75.00, break above that level will open the gate to 76.00.
- Technical indicators suggest bullish movement, hovering above the midline. RSI stabilizes at 56, while the Momentum indicator stabilizes in positive territory, suggests upward potentials. On downside, the immediately support is 71.50, break below this level will open the gate for more decline to 70.00 area.