28/12/2022 Daily Reports
- The EUR/USD has recovered 1.0611, reaching the lowest level since last Thursday and then bounced sharply to the upside, approaching daily highs as equity prices in Wall Street rebounded. It ended the day at around 1.0645, bullish in the daily chart.
- The improvement in risk sentiment sent the US Dollar down across the board. The DXY is hovering around 104.00, down by 0.25% in the day. In Wall Street ,the Dow Jones is unchanged and the Nasdaq falls by more than 1.4%.
- US and European bond yields area higher on Tuesday, off highs. The US-year yield peaked at 3.83%, the highest in a month. The German 10-year matched the 2022 high at 2.53%. The divergence between both bonds is at levels not seen since October 2020 and is supporting the Euro.
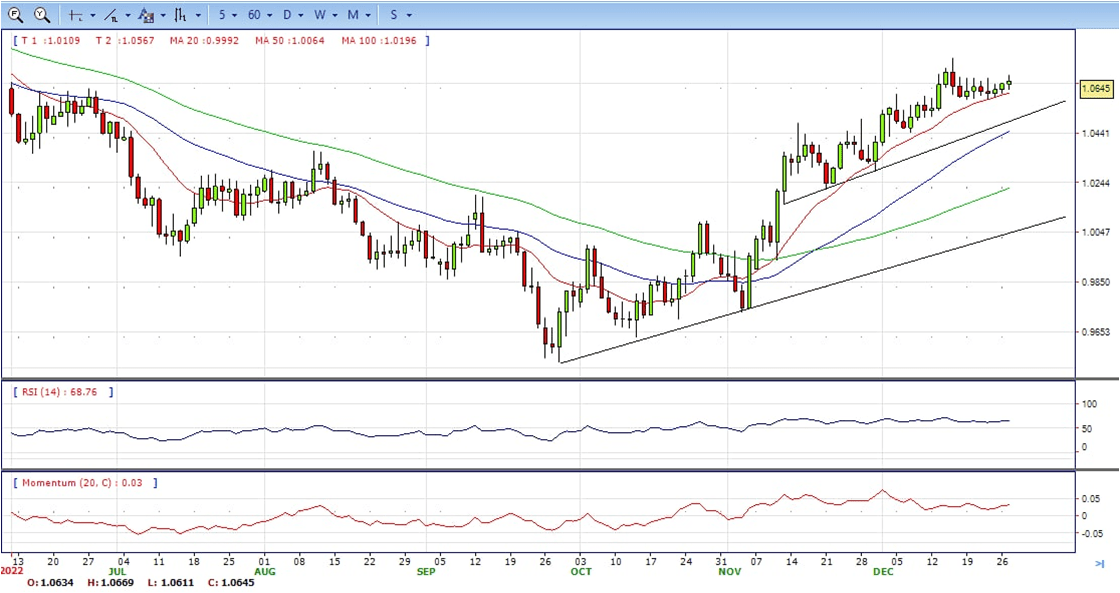
- The EUR/USD pair is trading near the 1.0645, up for the day with bullish stance in daily chart. The pair stabilized above 20 and 50 SMA, indicates bullish strength. Meanwhile, the 20 SMA continued accelerating north and developing far above longer ones, suggests bulls not exhausted yet. On upside, the immediate resistance is 1.0665, break above this level will extend the advance to 1.0740.
- Technical readings in the daily chart support the bullish stances. The RSI indicators hovering above the midline and stabilized around 65. The Momentum indicator stabilized above the midline, indicating upward potentials. On downside, the immediate support is 1.0570 and below this level will open the gate to 1.0500.
- The Pound is performing a sharp U-turn on Tuesday, The pair’s run-up from last Friday’s lows at 1.2020 has been capped at 1.2110 earlier today, before giving away most of the ground taken on the previous days and returning to 1.2025 so far, neutral to bearish in the daily chart.
- The Pound Sterling has failed to capitalize on the positive market mood seen on Tuesday. News that Chinese authorities will scrap quarantine requirements for inbound travelers has been welcomed by investors, which reflects on the advances in the world’s major stock markets.
- Furthermore, the US Dollar is trimming losses after a negative opening, weighed by the positive market mood and increasing hopes that the US Federal Reserve will soften its monetary tightening path in 2023.
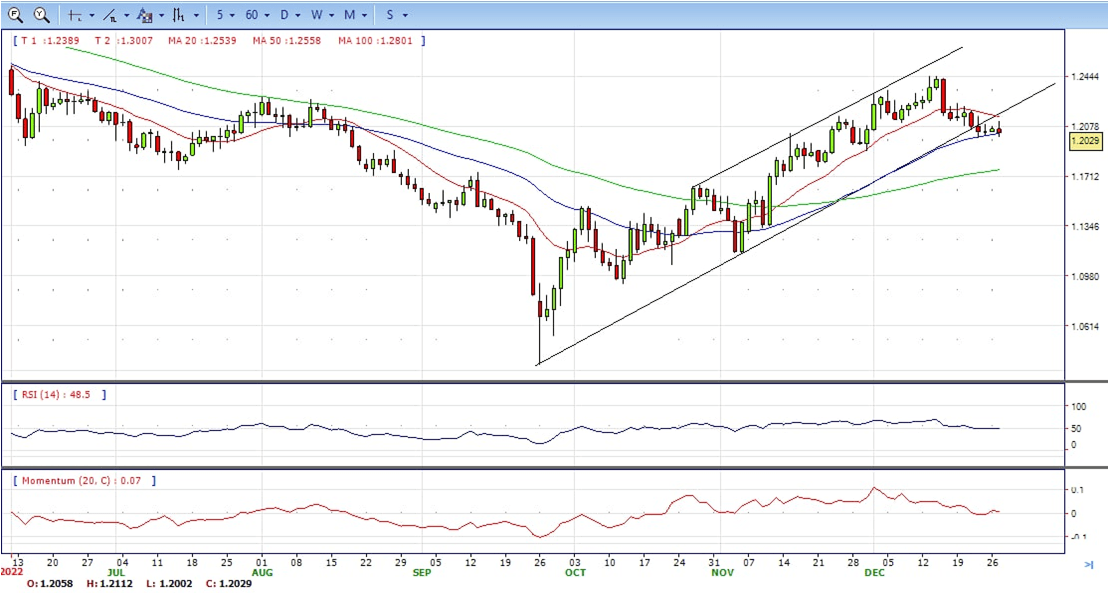
- The GBP/USD offers neutral to bearish stance in daily chart. Cable stabilized between 20 and 50 SMA, indicating neutral strength in short term. However, the 20 SMA started turning south and heading towards 50 SMA, suggests bears not exhausted yet. On upside, The immediate resistance is 1.2150 with a break above it exposing to 1.2250.
- Technical readings in the daily chart support the neutral stances. RSI indicator stabilized around 49, while the Momentum indicator stabilized near the midline, suggesting directionless potentials. On downside, the immediate support is 1.1990, unable to defend this level will resume the decline to 1.1900.


- XAU/USD jumped to a fresh three-week high of $1,833.3 a troy ounce following Wall Street’s opening amid a better market mood maintaining market players in risk-on mode. It ended Friday at around $1818, still bullish in the daily chart.
- Market participants welcome news that US inflation keeps receding, according to the core PCE Price Index released last Friday. Another catalyst for the upbeat mood came from China, as the country is further easing COVID-related restrictions.
- In the US calendar, the focus will be on the US Goods Trade Balance, Housing prices, and the Dallas Fed Manufacturing Index, although the impact on currencies is likely to be limited.
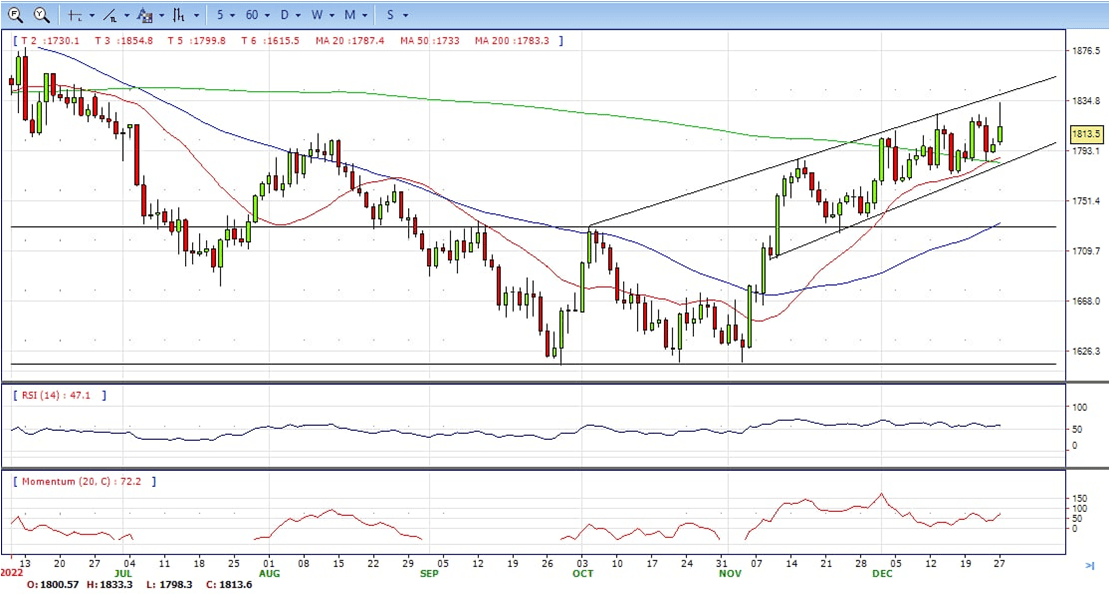
- Gold price stabilized around 1818, up for the day and bullish in the daily chart. The gold price still stabilized above 20 and 50 SMA, suggesting bullish strength in short term. Meanwhile, the 20 SMA continued accelerating north and developing above 50 SMA, indicating bulls not exhausted yet. On upside, the immediate resistance is 1838, break above this level will open the gate for more advance to 1858 area.
- From a technical perspective, the RSI indicator hold above the midline and stabilized around 60, suggesting bullish strength. The Momentum indicator stabilized above the midline, suggests upward potentials. On downside, the immediate support is 1784, below this area may resume the decline to 1784.


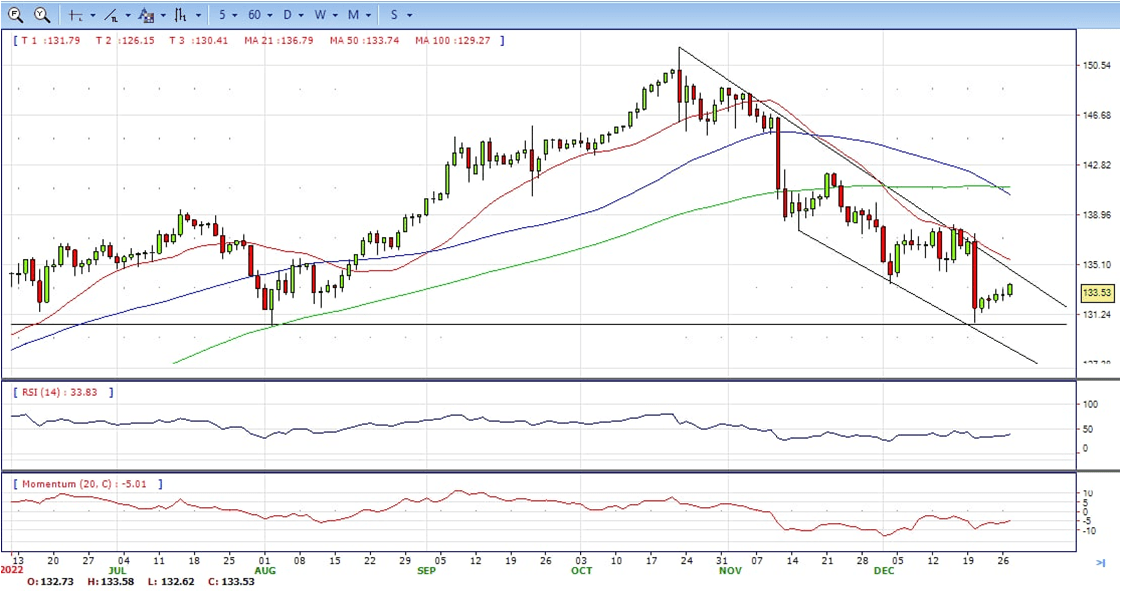
- The US Dollar seems to be shrugging off the previous soft tone, with the USD/JPY pushing higher in Tuesday, to breach recent highs at 133.15 and hit fresh one-week highs near 133.60, but still bearish in the daily chart.
- The Governor of the Bank of Japan, Haruhiko Kuroda dismissed on Monday any chance of a near-term exit from the bank’s ultra-expansive monetary policy, increasing negative pressure on the Japanese Yen. Such speculation has been going on in the markets since the bank relaxed its yield curve control.
- In a thin post-Christmas market, Japanese figures have been mixed, with employment data showing slightly better than expected readings, while retail consumption eased to 2.6% in November, below the consensus 2.8% and the 4.4% reading seen in October.
- The USD/JPY pair stabilized around 133.55, up for the day and bearish in the daily chart. The price maintains the downward slope and develops below all main SMAs, suggests bearish strength in short term. Meanwhile, 20 SMA continued accelerating south and developing below longer ones, indicating bears not exhausted. On upside, overcome 133.60 may encourage bulls to challenge 134.60, break above that level will open the gate to 135.70.
- Technical indicators suggest the bearish strength. RSI stabilized around 40, while the Momentum indicator continued developing below the midline, suggests downward potentials. On downside, the immediate support is 132.40, break below this level will open the gate to 131.50 area.
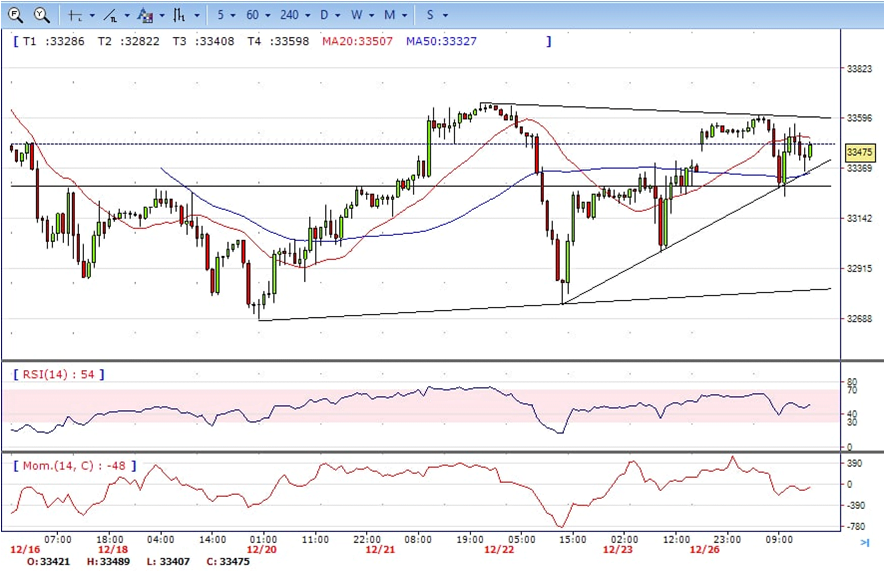
- DJI still in the familiar range, opened gap up to high 33610 due to Chinese Covid restriction ease. It then trimmed all the gains, tumbled to low 33240 and ended Tuesday at around 33440, unchanged for the day and neutral to bearish in the daily chart. The price stabilized between 20 and 50 SMA, suggests neutral strength in short term. Meanwhile, 20 SMA started turning south and heading towards 50 SMA , suggests bears not exhausted yet. On upside, overcome 33660 may encourage bulls to challenge 34000, break above this level will open the gate to 34240.
- Technical indicators suggests the neutral to bearish strength. RSI stabilized at around 48, while the Momentum indicator stabilized in negative territory, suggests downward potentials. On downside, the immediate support is 33240, break below this level will open the gate for more decline to 32980 area.
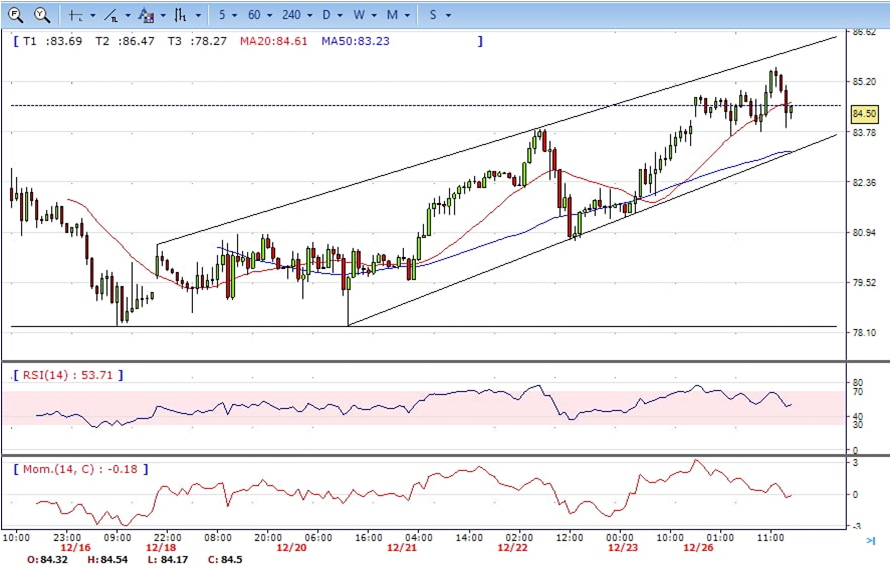
- Brent continue the advance, gap up and hit intraday high 85.60. It trim some gains in NY session and end Tuesday at around 84.50, up for the day and bullish in the hourly chart. The price stabilized near 20 SMA and far above 50 SMA, suggests bullish strength in short term. Meanwhile, the 20 SMA continued accelerating north and far above 50 SMA, indicating bulls not exhausted yet. On upside, overcome 86.00 may encourage bulls to challenge 88.50, break above this level will open the gate to 89.40.
- Technical indicators suggest the bullish movement, hovering above the midline. RSI stabilized at around 55, while the Momentum indicator stabilized in positive territory, suggests upward potentials. On downside, the immediate support is 83.60, break below this level will open the gate for more decline to 82.00 area.