28/04/2023 Daily Reports
- EUR/USD fades the initial upbeat mood and retreats to the boundaries of 1.1000 the figure on the back of the marked bounce in the Greenback on Thursday.
- The move lower in the pair came soon after advanced US GDP Growth Rate saw the economy expand less than estimated by 1.1% YoY and 4.0% inter-quarter in the January-March period. In addition, Initial Claims rose by 230K in the week to April 22. Earlier in the session, the Consumer Confidence measured by the European Commission in the broader Euroland matched the preliminary reading at -17.5 in April.
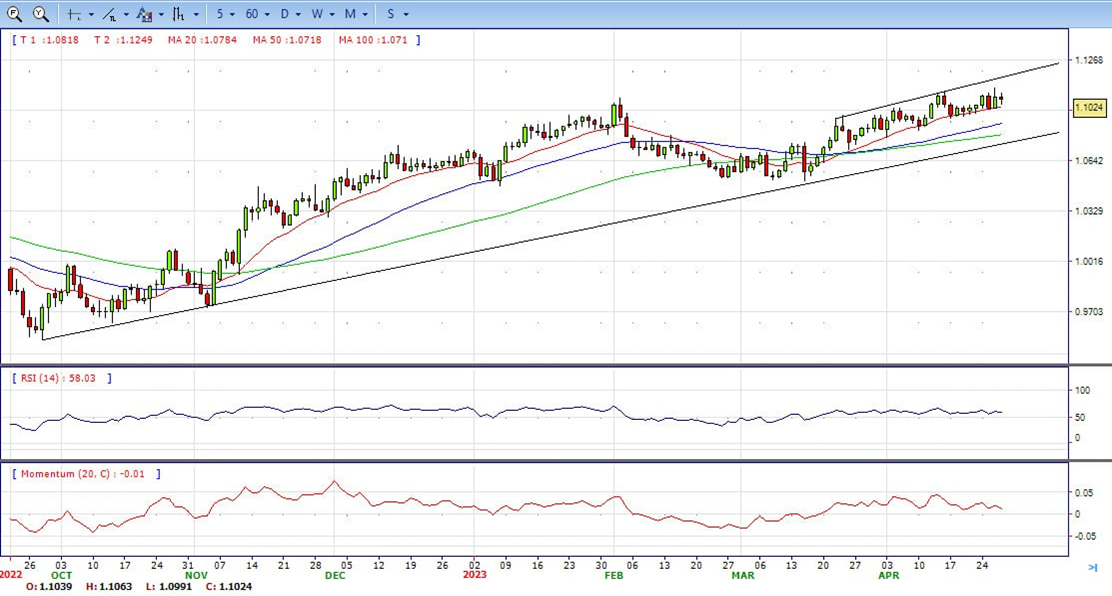
- The EUR/USD pair is trading near the 1.1024, slightly down for the day with bullish stance in daily chart. The pair stabilized above 20 and 50 SMA, indicates bullish strength. Meanwhile, the 20 SMA continued accelerating north and heading towards 50 and 200 SMA, suggests bulls not exhausted yet. On upside, the immediate resistance is 1.1100, break above this level will extend the advance to 1.1180.
- Technical readings in the daily chart support the bullish stance. The RSI indicator stabilizes around 59. The Momentum indicator holds above the midline, indicating bullish potentials. On downside, the immediate support is 1.0960 and below this level will open the gate to 1.0900.
- The GBP/USD pair struggles to gain any meaningful traction on Thursday and oscillates in a narrow trading band through the first half of the European session. The pair is currently placed just above mid-1.2400s, nearly unchanged for the day, though the downside seems cushioned amid subdued US Dollar (USD) price action.
- The uncertainty over the Federal Reserve’s rate-hike path, along with a slight recovery in the global risk sentiment, fail to assist the safe-haven buck to capitalize on the overnight bounce from a nearly two-week low and lend support to the GBP/USD pair. Fresh concerns about banking contagion risks in the United States, along with the debt ceiling standoff and looming recession fears, have been fuelling speculations about an imminent rate cut by the Fed later this year.
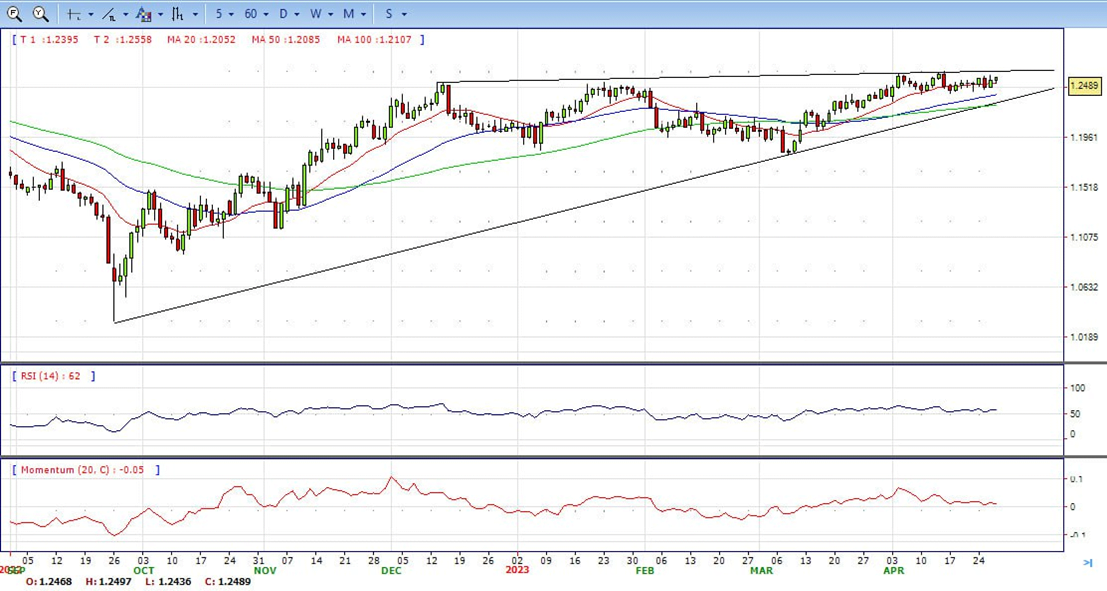
- The GBP/USD offers bullish stance in daily chart. Cable stabilizes above 20 and 50 SMA, indicating bullish strength in short term. Meanwhile, the 20 SMA continued accelerating north and developing far above longer ones, suggests bulls not exhausted yet. On upside, the immediate resistance is 1.2550 with a break above it exposing to 1.2660.
- Technical readings in the daily chart support the bullish stances. RSI indicator stabilizes around 57, while the Momentum indicator stabilizes above the midline, suggesting upward potentials. On downside, the immediate support is 1.2340, unable to defend this level will resume the decline to 1.2270.


- Gold price dropped sharply following the release of US Q1 GDP growth data. XAU/USD hit levels above $2,000 and then lost almost $20, falling to the $1,980 area.
- Economic data from the US showed the economy grew at an annualized rate of 1.1% during the first quarter, below the 2% of market consensus and under the 2.6% of the previous quarter. The Core PCE rose 4.9%, above the expected 4.7%. The GDP deflator also exceeded expectations at 4% versus 3.7%. A different report showed a decline in Jobless Claims. The numbers showed slower growth and persistent inflation. US yields rose after the economic figures. The 2-year Treasury yield climbed above 4% to 4.03% while the 10-year spiked to 3.49% and then pulled back. The US Dollar Index turned positive for the day, rising above 101.60. Wall Street futures remained in positive territory.
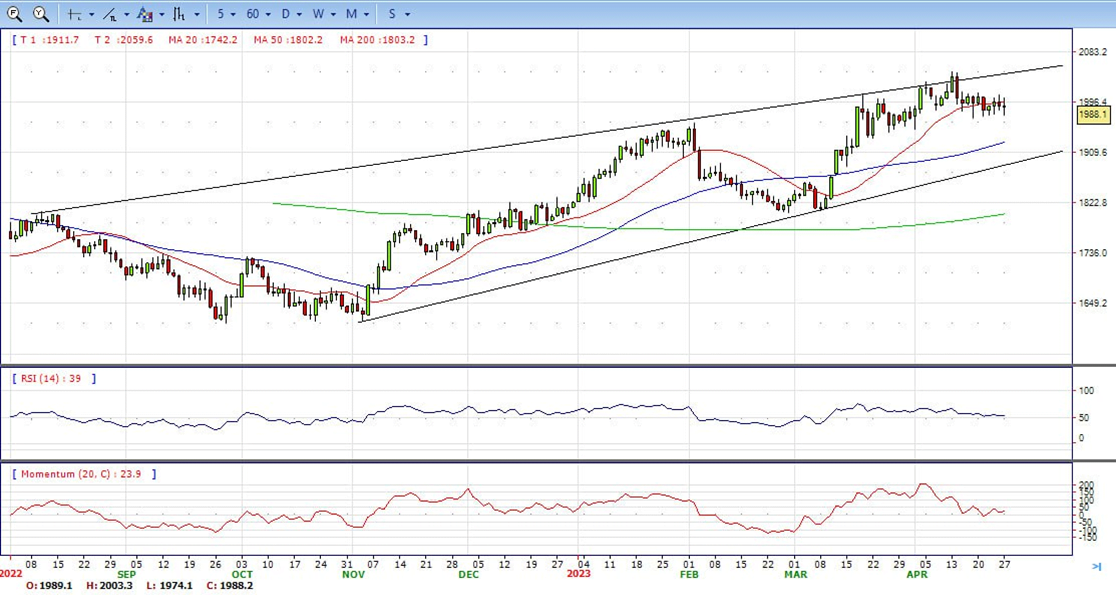
- Gold price stabilized around 1988, unchanged for the day and neutral to bullish in the daily chart. The gold price stabilizes below 20 SMA, suggesting bearish strength in short term. Meanwhile, the 20 SMA started turning flat but continued developing far above 50 and 200 SMA, indicates bulls not exhausted yet. On upside, the immediate resistance is 2015, break above this level will open the gate for more advance to 2032 area.
- From a technical perspective, the RSI indicator holds above the mid-line and stabilizes around 52, on a bullish strength. The Momentum indicator hold near the midline, suggests directionless potentials. On downside, the immediate support is 1969, below this area may resume the decline to 1950.


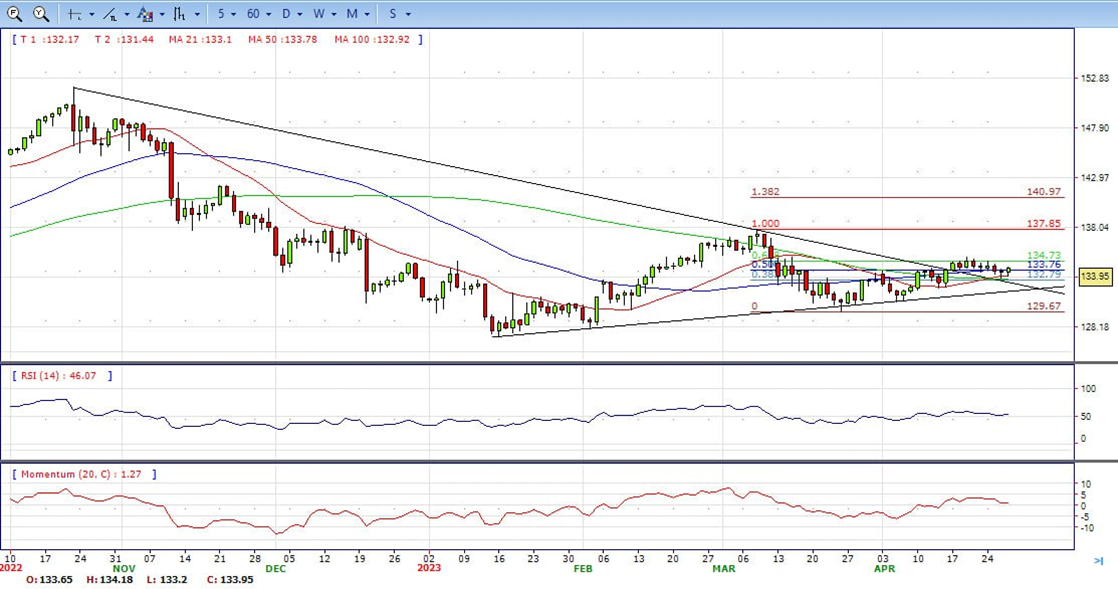
- The USD/JPY pair rebounds over 80 pips from the daily low touched during the early North American session and climbs to the 134.00 mark, a fresh daily high following the release of the US GDP report.
- The US Bureau of Economic Analysis reported this Thursday that the economic growth decelerated from 2.6% annualized pace to 1.1% during the January-March period, missing estimates for a reading of 2.0%. That said, the price index component – the Core Personal Consumption Expenditure – rose more than expected, by 4.9% during the reported period and pointed to a further pickup in price pressures, reaffirming bets for another 25 bps lift-off at the next FOMC meeting in May. This remains supportive of a further rise in the US Treasury bond yields, which continues to act as a tailwind for the US Dollar and lends support to the USD/JPY pair.
- The USD/JPY pair stabilized around 133.90, up for the day and bullish in the daily chart. The price stabilizes above 20 and 50 SMA, suggests bullish strength in short term. However, 20 SMA started turning flat but continued developing below longer ones, indicating bears not exhausted. On upside, overcome 135.15 may encourage bulls to challenge 137.00, break above that level will open the gate to 138.00.
- Technical indicators suggest the bullish strength. RSI stabilizes around 53, while the Momentum indicator stabilizes above the midline, suggests upward potentials. On downside, the immediate support is 133.00, break below this level will open the gate to 132.00 area.
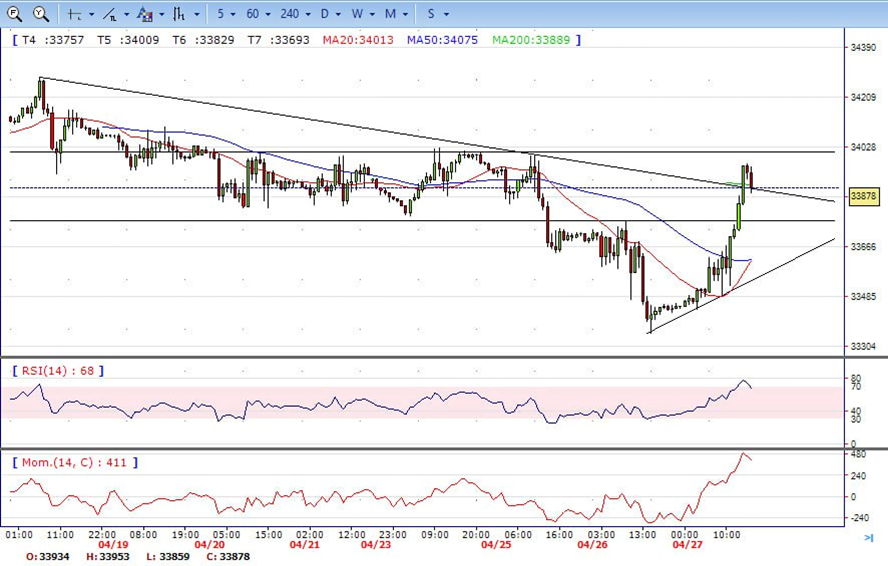
- DJI made a strong rally on Thursday, jumped from intraday low 33400 area to high 33960 level. It retreated modestly in the last hour of US session and ended the day around 33870. Right now market is standing above 20 and 50 SMA, suggests bullish strength. Meanwhile, 20 SMA started turning north and heading towards longer ones, suggests bulls not exhausted yet. On upside, overcome 34020 may encourage bulls to challenge 34280, break above that level will open the gate to 34560.
- Technical indicators suggest the bullish movement. RSI stabilizes around 68, while the Momentum indicator stabilizes above the midline, suggests upward potentials. On downside, the immediately support is 33730, break below this level will open the gate for more decline to 33350 area.
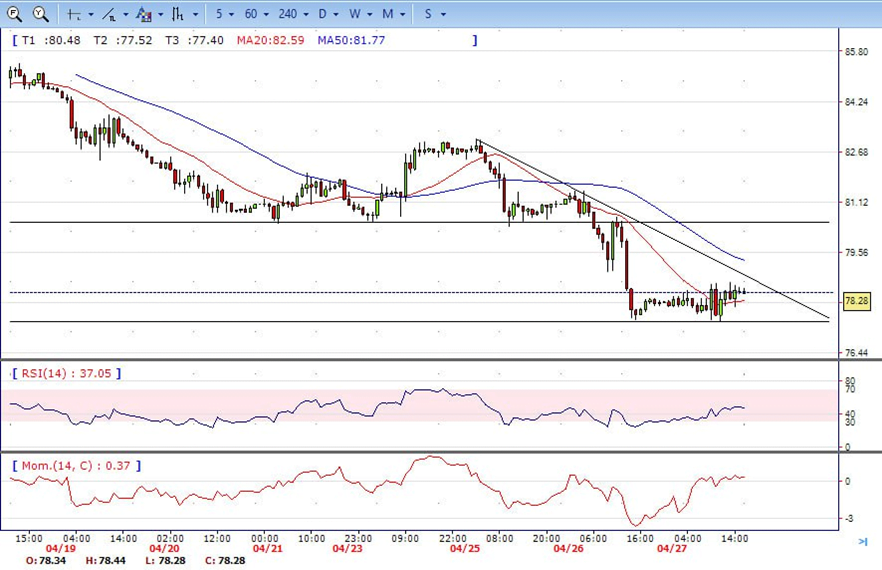
- Brent consolidated in the familiar range, traded between high 78.60 to low 77.40 and ended Thursday around 78.30, up for the day and indicates neutral to bullish sign in the hourly chart. Meanwhile, the 20 SMA started turning north and heading towards longer ones, indicates bulls not exhausted yet. On upside, overcome 79.00 may encourage bulls to challenge 80.50, break above that level will open the gate to 81.50.
- Technical indicators also suggest neutral to bullish movement, hovering above the midline. RSI stabilizes at 48, while the Momentum indicator stabilizes in positive territory, suggests upward potentials. On downside, the immediately support is 77.40, break below this level will open the gate for more decline to 74.30 area.