EUR/USD
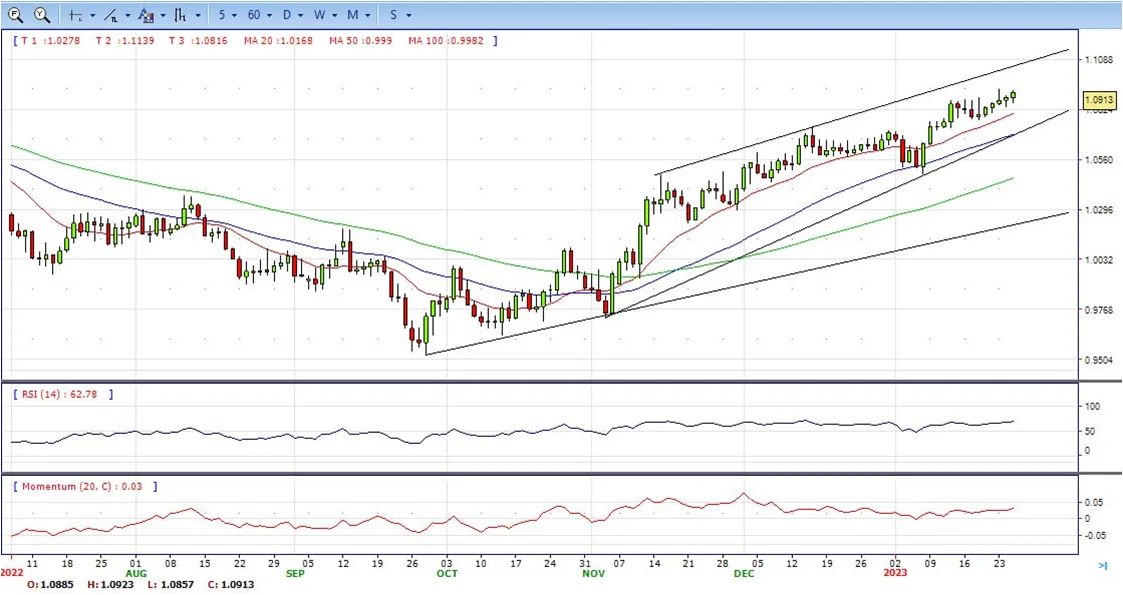
- The European currency now looks to extend the bounce off earlier lows in the 1.0860/55 band vs. the greenback and lifts EUR/USD back to the boundaries of 1.0900 the figure on Wednesday.
- EUR/USD so far advances for the sixth session in a row in a context dominated by alternating risk appetite trends, as investors – and global assets in general – remain prudent ahead of the upcoming FOMC and ECB events next week.
- Also collaborating with the optimism around the euro and reinforcing the view that Germany – and the Euroland – could avoid a recession, the German Business Climate improved to 90.2 during January.
- The EUR/USD pair is trading near the 1.0915, up for the day with bullish stance in daily chart. The pair still stabilized above 20 and 50 SMA, indicates bullish strength. Meanwhile, the 20 SMA continued accelerating north and developing far above longer ones, suggests bulls not exhausted yet. On upside, the immediate resistance is 1.0930, break above this level will extend the advance to 1.1000.
- Technical readings in the daily chart support the bullish stance. The RSI indicator is above 70. The Momentum indicator stabilizes in positive territory, indicating bullish potentials. On downside, the immediate support is 1.0760 and below this level will open the gate to 1.0710.
Open A Demo
CDO has wide range of tools, professional and friendly support for clients to achieve their financial markets trading goals. Open a live account now to enjoy this experience with virtual deposit.
GBP/USD
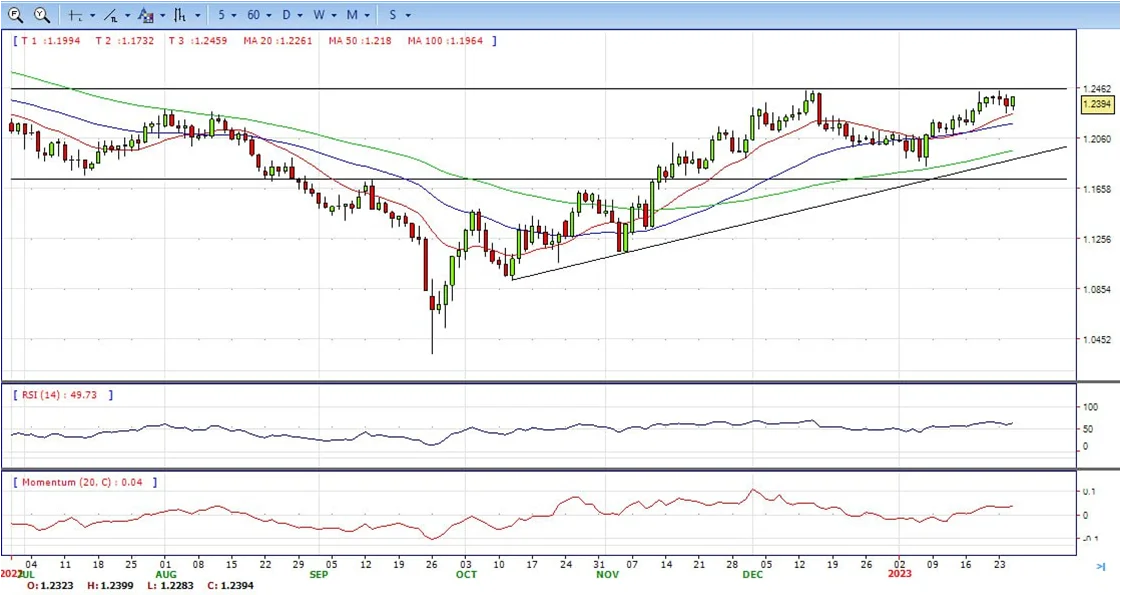
- The GBP/USD solidly climbs and trims two days of consecutive losses after hitting a weekly low of 1.2263 on Wednesday. Risk aversion is the game’s name, while the US Dollar is pairing some of its earlier losses, underpinned by US bond yields rising. The GBP/USD is trading at 1.2390, clinging to gains of 0.43%.
- During the European session, the GBP/USD slid to the lows of the day at 1.2282 amidst news that the UK’s PPI for December cooled the most since April 2020, which would ease pressures for the Bank of England. Input prices paid by factories dropped -1.1% MoM, while the year-over-year data dropped 1.5% from 18% to 16.5%. Regarding Output prices, it fell -0.8% MoM beneath estimates for a 0.1% gain, while on an annual basis, it fell to 14.7% from 16.2%.
- Meanwhile, the greenback has continued to weaken across the G8 FX board, as shown by the US Dollar Index, down 0.15%, staying at 101.767. Contrarily, US Treasury bond yields, paired with earlier losses, sit at 3.465%.
- The GBP/USD offers bullish stance in daily chart. Cable stabilizes above 20 and 50 SMA, indicating bullish strength in short term. Meanwhile, the 20 and 50 SMA continues accelerating north and developing above 200 SMA, suggests bulls not exhausted yet. On upside, The immediate resistance is 1.2450 with a break above it exposing to 1.2670.
- Technical readings in the daily chart support the bullish stances. RSI indicator stabilizes around 62, while the Momentum indicator stabilizes above the midline, suggesting upward potentials. On downside, the immediate support is 1.2250, unable to defend this level will resume the decline to 1.2150.

CDO TRADER
CDO TRADER, our cutting-edge trading platform, follows the technology from the forefront with new features added continuously. Moreover, CDO TRADER is now available for Android and iOS! So it allows you to trade on the go!
XAU/USD
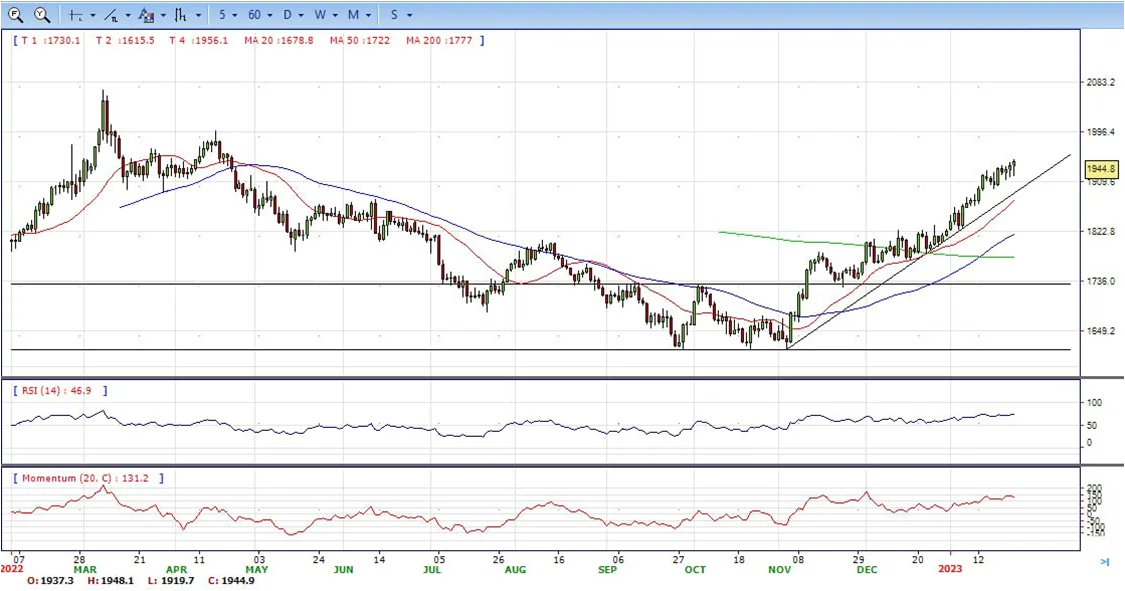
- Gold price continued the advance, surged to high above 1945 area for the first time in more than 9 months. It hold near the top, still bullish in the daily chart.
- Wall Street extends its losses at the open, following a warning that Microsoft sales in cloud services might slow down. Other big tech companies are feeling the pain of higher interest rates in the United States (US) as the US Federal Reserve (Fed) tightened 400 basis points, its monetary policy, since March 2022, to curb high inflationary pressures.
- The US Dollar Index (DXY), a gauge for measurement of the buck’s value vs. a basket of peers, losses 0.10% down at 101.828, undermined by a gloomy economic outlook in the US. The US 10-year Treasury bond yield eases one and a half bps and yields 3.44%.
- Gold price stabilized around 1945, up for the day and bullish in the daily chart. The gold price still stabilized above 20 and 50 SMA, suggesting bullish strength in short term. Meanwhile, the 20 and 50 SMA continued accelerating north and developing above 200 SMA, indicating bulls not exhausted yet. On upside, the immediate resistance is 1958, break above this level will open the gate for more advance to 1982 area.
- From a technical perspective, the RSI indicator holds above the mid-line and stabilizes around 73, still on a bullish strength. The Momentum indicator continues developing in positive territory, suggests more upside potentials. On downside, the immediate support is 1911, below this area may resume the decline to 1895.
MetaTrader 4
MT4 has user friendly interface that is providing simplicity and efficiency. The traders can perform trading strategies for different products like Forex and CFD. MetaTrader 4 has over 50 built-in indicators, also it’s the tool that predicts trends and defines the appropriate entry and exit points.

USD/JPY
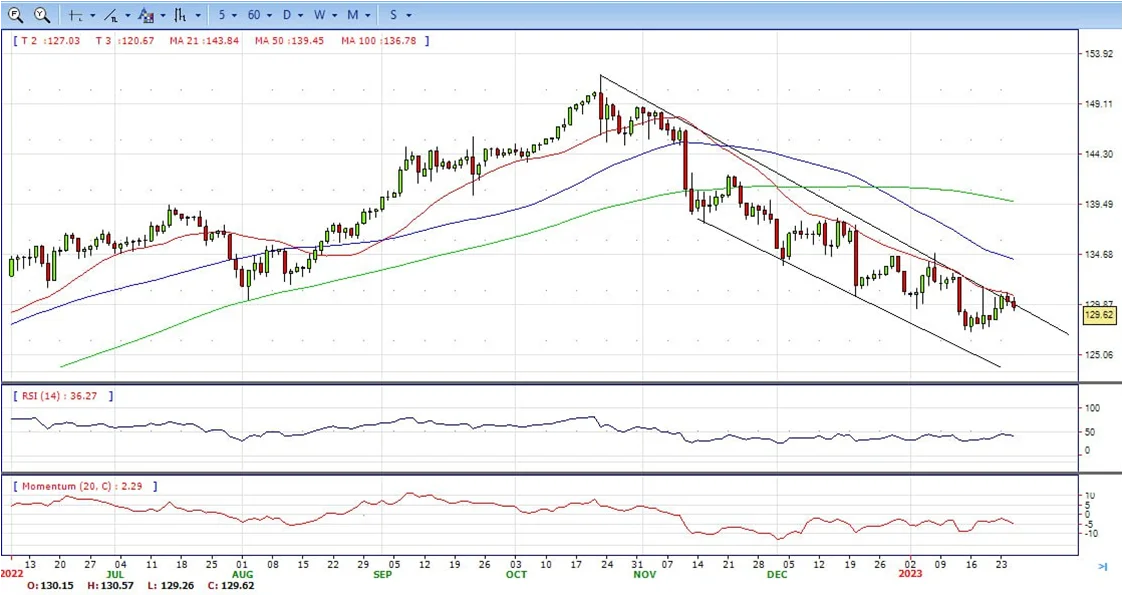
- The USD/JPY pair attracts some sellers near the 130.60 area and turns lower for the second successive day on Wednesday. The pair maintains its offered tone heading into the North American session and is currently placed near the daily low, around the 129.60 region.
- A combination of factors provides a modest lift to the Japanese Yen, which, in turn, is seen exerting some downward pressure on the USD/JPY pair. Despite the BoJ dovish decision last week, market participants seem convinced that high inflation may invite a more hawkish stance from the central bank later this year. Apart from this, a fresh wave of the global risk-aversion trade benefits the JPY’s relative safe-haven status.
- The market sentiment remains fragile amid looming recession risks, fueled by worries about the economic headwinds stemming from the worst yet COVID-19 outbreak in China and the protracted Russia-Ukraine war. Moreover, the latest report by World Bank noted that the global economy is now in its steepest slowdown following a post-recession recovery since 1970. This, in turn, is seen weighing on investors’ sentiment and driving some haven flow to the JPY.
- The USD/JPY pair stabilized around 129.60, down for the day and bearish in the daily chart. The price maintains the downward slope and develops below all main SMAs, suggests bearish strength in short term. Meanwhile, 20 SMA continued accelerating south and developing below longer ones, indicating bears not exhausted. On upside, overcome 131.10 may encourage bulls to challenge 131.60, break above that level will open the gate to 133.00.
- Technical indicators still suggest the bearish strength. RSI fell to 41, while the Momentum indicator stabilize in negative territory, suggests downward potentials. On downside, the immediate support is 129.00, break below this level will open the gate to 128.00 area.
DJI
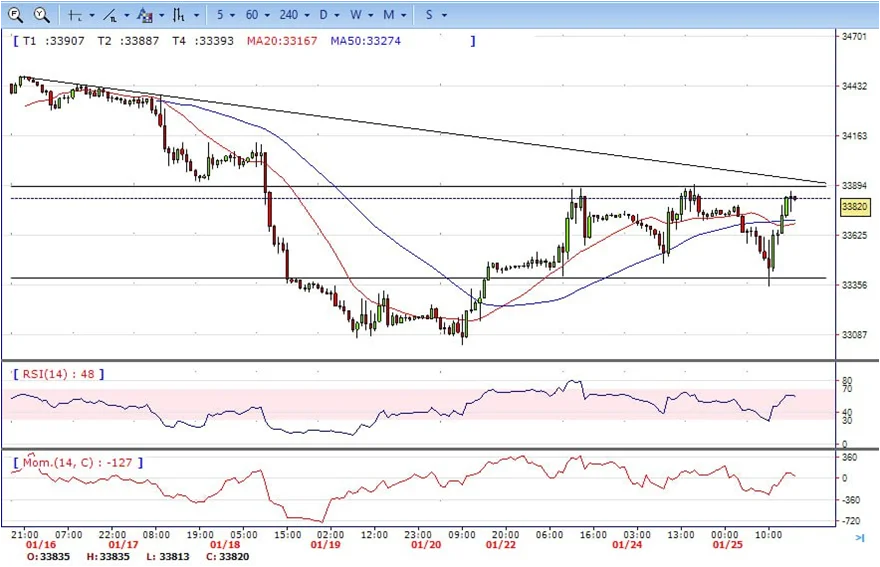
- DJI fell to low 33347 area on the first half of the day, then changed the direction to upside, climbed to high 33860 and ended Wednesday nearby, indicates bullish sign in the hourly chart. Right now market is standing above 20 and 50 SMAs, suggests a bullish strength. Meanwhile, 20 SMA continued accelerating north and heading towards 200 SMA, suggests bulls not exhausted yet. On upside, overcome 33900 may encourage bulls to challenge 34130, break above that level will open the gate to 34500.
- Technical indicators also suggest the bullish movement, developing above the mid-line. RSI stabilized around 59, while the Momentum indicator hovering well above the mid-line, suggests upside potentials. On downside, the immediately support is 33350, break below this level will open the gate for more decline to 33000 area.
BRENT
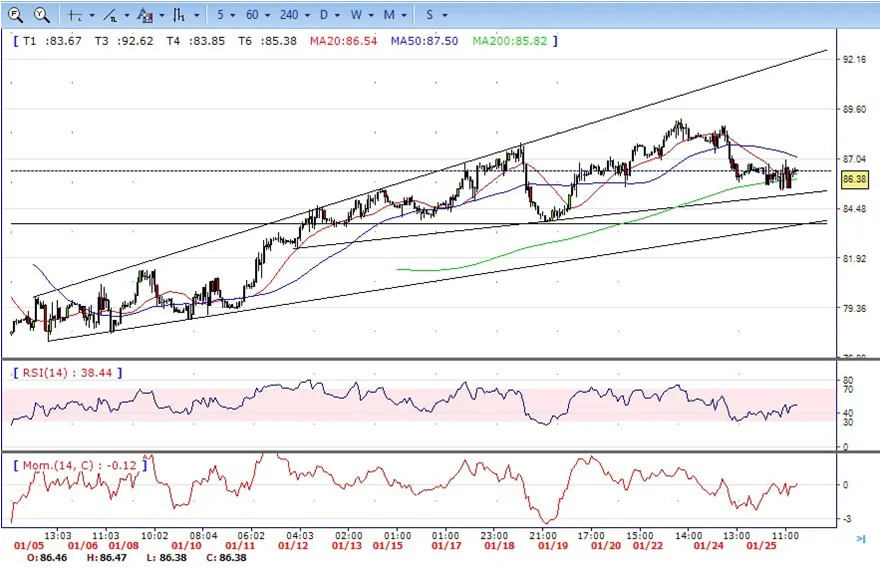
- The Brent under the sell pressure on Wednesday, failed to recovered 87.00 area after hit intraday low 85.37. It almost unchanged for the day. The price struggled near 20 SMA, suggests neutral strength in the hourly chart. Meanwhile, the 20 SMA continued developing between 50 and 200 SMA with no clear direction, indicates directionless movement. On upside, overcome 87.00 may encourage bulls to challenge 89.20, break above that level will open the gate to 90.50.
- Technical indicators also suggest directionless movement, hovering near the midline. RSI drops to 50, while the Momentum index stabilizes near the midline, suggests neutral potentials. On downside, the immediately support is 85.30, break below this level will open the gate for more decline to 83.70 area.
Contact Us
Please, fill the form to get an assistance.


