

21/02/2023 Daily Reports
- EUR/USD trades without direction in the sub-1.0700 region at the beginning of the week due to US President holiday.
- Presidents’ Day has delivered a slow morning for markets, albeit one with a slight positive bias to Asian and European equities, that helps risk sentiment more broadly and in so doing, has prevented the Dollar from rising any further today.
- In terms of USD sentiment, February has clearly offered something of a sea-change relative to last month. It is the expectation that this has further to run. Given that the FOMC is likely to take the top of the target range for the Fed Funds to 5.5%, investors see scope for the USD to remain well supported into the middle of the year.
- The EUR/USD pair is trading near the 1.0685, unchanged for the day with bearish stance in daily chart. The pair still stabilized below 20 and 50 SMA, indicates bearish strength. Meanwhile, the 20 SMA started turning south and heading towards longer ones, suggests bears not exhausted yet. On upside, the immediate resistance is 1.0800, break above this level will extend the advance to 1.0930.
- Technical readings in the daily chart support the bearish stance. The RSI indicator stabilizes around 45. The Momentum indicator holds below the midline, indicating downward potentials. On downside, the immediate support is 1.0610 and below this level will open the gate to 1.0470.

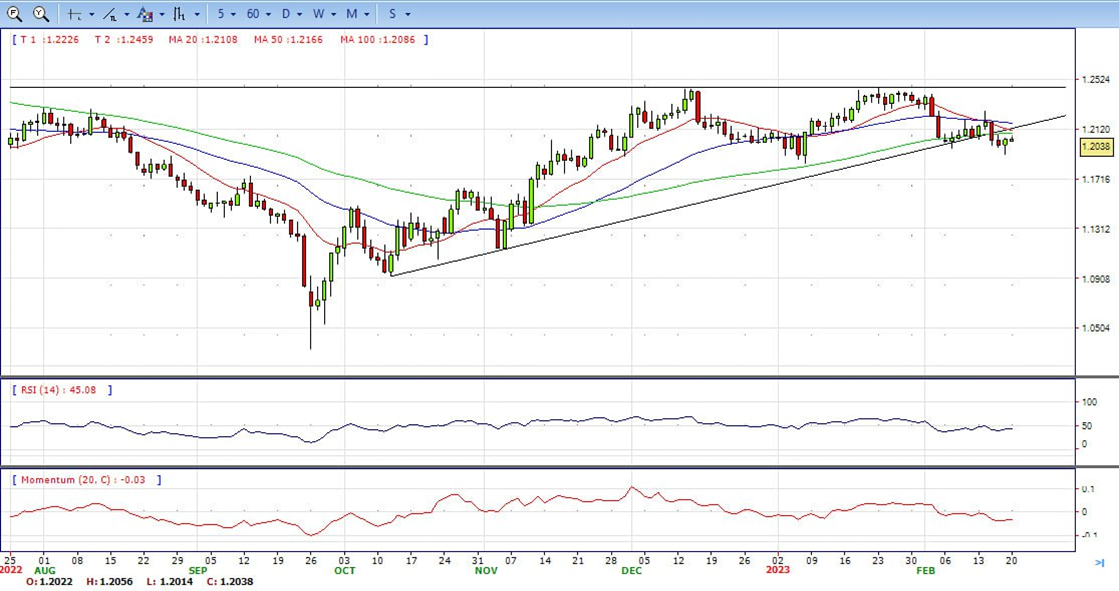
GBP/USD corrected from the low 1.19s on Friday, denting the bear’s dominance ahead of a US holiday on Monday as traders squared up into the long weekend. At the time of writing, GBP/USD is trading near 1.2040 and remains in consolidation between the day’s low of 1.2014 and 1.2056.
Against the backdrop of looming recession risks, fresh geopolitical tensions continue to weigh on investors’ sentiment and benefit the Greenback’s relative safe-haven status. Adding to this, firming expectations that the Fed will stick to its hawkish stance provide a modest lift to the USD.
In fact, the markets are now pricing in at least a 25 bps lift-off at each of the next two FOMC policy meetings in March and May. The bets were reaffirmed by the US CPI and PPI data last week, which showed that inflation isn’t coming down quite as fast as hoped. In contrast, the softer-than-expected UK consumer inflation figures fuelled speculations that the BoE current rate-hiking cycle might be nearing the end.
The GBP/USD offers bearish stance in daily chart. Cable stabilizes below 20 and 50 SMA, indicating bearish strength in short term. Meanwhile, the 20 SMA continued accelerating south and heading towards longer ones, suggests bears not exhausted yet. On upside, The immediate resistance is 1.2080 with a break above it exposing to 1.2190.
Technical readings in the daily chart support the neutral to bearish stances. RSI indicator stabilizes around 44, while the Momentum indicator stabilizes below the midline, suggesting downward potentials. On downside, the immediate support is 1.1910, unable to defend this level will resume the decline to 1.1840.


- Gold price advances after hitting a six-week low at around $1,819 and aims toward $1,842, above its opening price by 0.30%. At the time of writing, the XAU/USD is at $1,841.30, bolstered by a soft US Dollar (USD) undermined by falling US Treasury bond yields.
- Last week’s economic data out of the US keeps traders nervous, as they begin to price in a more aggressive Fed. Uncertainty over where the Federal Funds Rate (FFR) will peak triggered the second consecutive week in which US equities finished lower.
- This was reflected in the jump in US Treasury bond yields, which closed the week at 3.822% – eight basis points (bps) above the previous week, thus also underpinning the Greenback. The US Dollar Index climbed above the 104.000 mark. Nevertheless, in Monday’s session, the DXY has fallen 0.03% so far, to 103.849.
- Gold price stabilized around 1841, unchanged for the day and bearish in the daily chart. The gold price stabilized below 20 and 50 SMA, suggesting bearish strength in short term. Meanwhile, the 20 SMA started turning south and heading towards longer ones, indicating bears not exhausted yet. On upside, the immediate resistance is 1860, break above this level will open the gate for more advance to 1891 area.
- From a technical perspective, the RSI indicator holds below the mid-line and stabilizes around 39, on a bearish strength. The Momentum indicator hold below the midline, suggests downward potentials. On downside, the immediate support is 1818, below this area may resume the decline to 1800.


- The USD/JPY pair edges lower on the first day of a new week and remains on the defensive through the early North American session. The pair is currently placed around the 134.00 mark, though the setup warrants some caution before positioning for an extension of Friday’s pullback from a nearly two-month high.
- The cautious market mood, amid looming recession risks and geopolitical tensions, underpins the safe-haven JPY and acts as a headwind for the USD/JPY pair. That said, the underlying bullish sentiment surrounding the US Dollar, bolstered by expectations that the Fed will stick to its hawkish stance to tame inflation, should continue to lend support to the major.
- In the meantime, relatively lighter trading volumes on the back of the Presidents’ Day holiday in the US, could lead to an extension of the USD/JPY pair’s range-bound price action on Monday.
- The USD/JPY pair stabilized around 134.20, slightly up for the day and bullish in the daily chart. The stabilizes above 20 and 50 SMA, suggests bullish strength in short term. Meanwhile, 20 SMA continued accelerating north and heading towards longer ones, indicating bulls not exhausted. On upside, overcome 135.10 may encourage bulls to challenge 136.70, break above that level will open the gate to 138.20.
- Technical indicators suggest the bullish strength. RSI stabilizes around 59, while the Momentum indicator stabilizes in the positive territory, suggests upward potentials. On downside, the immediate support is 133.50, break below this level will open the gate to 132.50 area.

- DJI retreated modestly on the first day of the new week. It then bounced from intraday low 33737 and ended the day around 33785, slightly down for the day and indicates bearish sign in the hourly chart. Right now market is standing below 20 SMA, suggests bearish strength. Meanwhile, 20 SMA started turning south and heading towards longer one, suggests bears not exhausted yet. On upside, overcome 34100 may encourage bulls to challenge 34370, break above that level will open the gate to 34550.
- Technical indicators suggest the bearish movement, developing below the mid-line. RSI stabilizes around 47, while the Momentum indicator stabilizes in the negative territory, suggests downward potentials. On downside, the immediately support is 33500, break below this level will open the gate for more decline to 33350 area.

- The Brent advanced modestly after dropped to intraday low 83.06 area. It climbed to high 84.30 and ended the day around 83.93. The price currently stabilizes above 20 and 50 SMA, suggests bullish strength in the hourly chart. Meanwhile, the 20 SMA started turning north and heading towards longer ones, indicates bulls not exhausted yet. On upside, overcome 84.30 may encourage bulls to challenge 85.70, break above that level will open the gate to 87.00.
- Technical indicators also suggest bullish movement, hovering above the midline. RSI climbs to 53, while the Momentum indicator stabilizes in positive territory, suggests upward potentials. On downside, the immediately support is 83.00, break below this level will open the gate for more decline to 81.80 area.


