

20/06/2023 Daily Reports
- The European currency maintains the offered stance well in place at the beginning of the week and motivates EUR/USD to recede to daily lows in the 1.0925/20 band on the back of the decent recovery in the US Dollar.
- Indeed, sellers remain in control of the sentiment around the euro on Monday, forcing spot to give away part of last week’s gains to the 1.0970 region, or multi-week highs, as investors continue to adjust to the recent hawkish messages from both the ECB and the Federal Reserve at their meetings on June 14 and June 15, respectively.
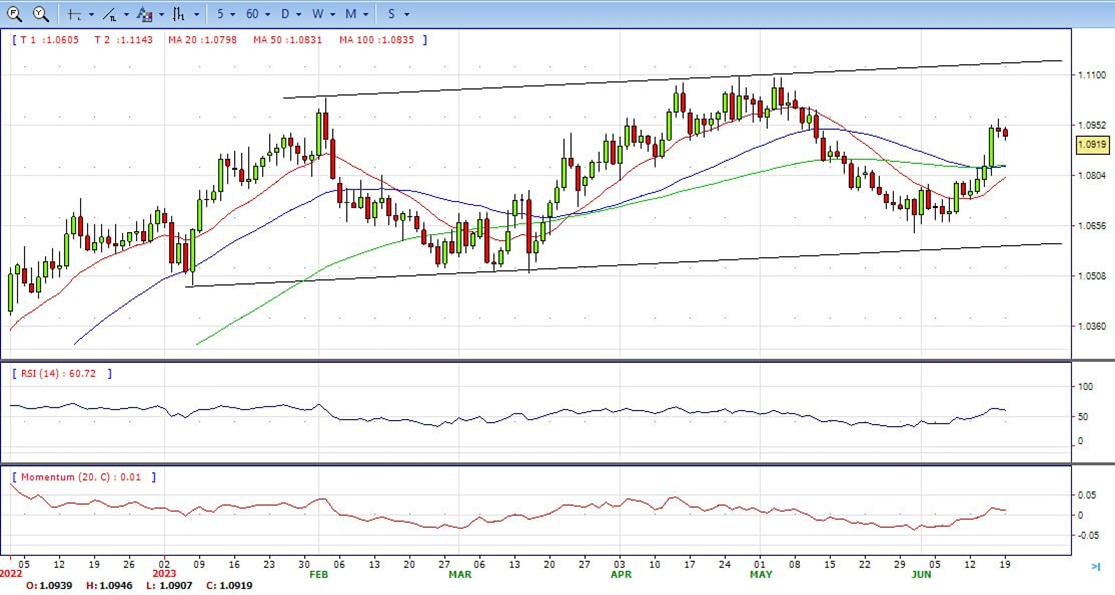
- The EUR/USD pair is trading near the 1.0920, modestly down for the day with bullish stance in daily chart. The pair stabilized above all main SMAs, indicates bullish strength. Meanwhile, the 20 SMA started turning north and heading towards 50 and 200 SMA, suggests bulls not exhausted yet. On upside, the immediate resistance is 1.0970, break above this level will extend the advance to 1.1010.
- Technical readings in the daily chart support the bullish stance. The RSI indicator stabilizes around 60. The Momentum indicator holds above the midline, indicating upward potentials. On downside, the immediate support is 1.0860 and below this level will open the gate to 1.0800.
- GBP/USD reverses its course late in the European session amidst a low-volume trading day in the FX space, with US markets closed due to a holiday. A risk-off impulse weighs on the GBP, which is set to outperform the greenback, as the BoE is expected to deliver a rate hike on Thursday. The GBP/USD is trading at 1.2780, down a modest 0.23%.
- European equities closed with losses. The GBP/USD is at the mercy of the BoE’s decision to raise rates after being questioned by politicians to deliver price stability amidst inflationary levels last seen 40 years ago. Nevertheless, it should be said that April’s inflation has shown signs of easing from around 10.1% to 8.7% YoY. Still, the core reading depicts inflation is broadening amongst the Consumer Price Index (CPI) basket components, as it ticks from 6.2% to 6.8% YoY.
- The GBP/USD offers bullish stance in daily chart. Cable stabilizes above 20 and 50 SMA, indicating bullish strength in short term. Meanwhile, the 20 and 50 SMA started turning flat but continued developing above longer ones, suggests bulls not exhausted yet. On upside, the immediate resistance is 1.2850 with a break above it exposing to 1.3000.
- Technical readings in the daily chart support the bullish stances. RSI indicator stabilizes around 68, while the Momentum indicator stabilizes above the midline, suggesting upward potentials. On downside, the immediate support is 1.2760, unable to defend this level will resume the decline to 1.2630.


- Gold price trades with minimal losses amidst a quiet US session due to a holiday in the US. Therefore as US markets are closed, thin liquidity conditions drive price action. At the time of writing, XAU/USD is trading at $1950 after hitting a daily high of $1958.7.
- As US markets remain closed, XAU/USD trading is dictated by yield performance on last Friday’s session. The 10-year benchmark note rate sits at 3.767%, while US real yields, calculated with the nominal yield minus inflation expectations, sit at 1.547%, still below the 2023 high of 1.719%. With US bond yields remaining higher, XAU/USD would likely remain pressured, as high yields, usually mean a stronger USD.
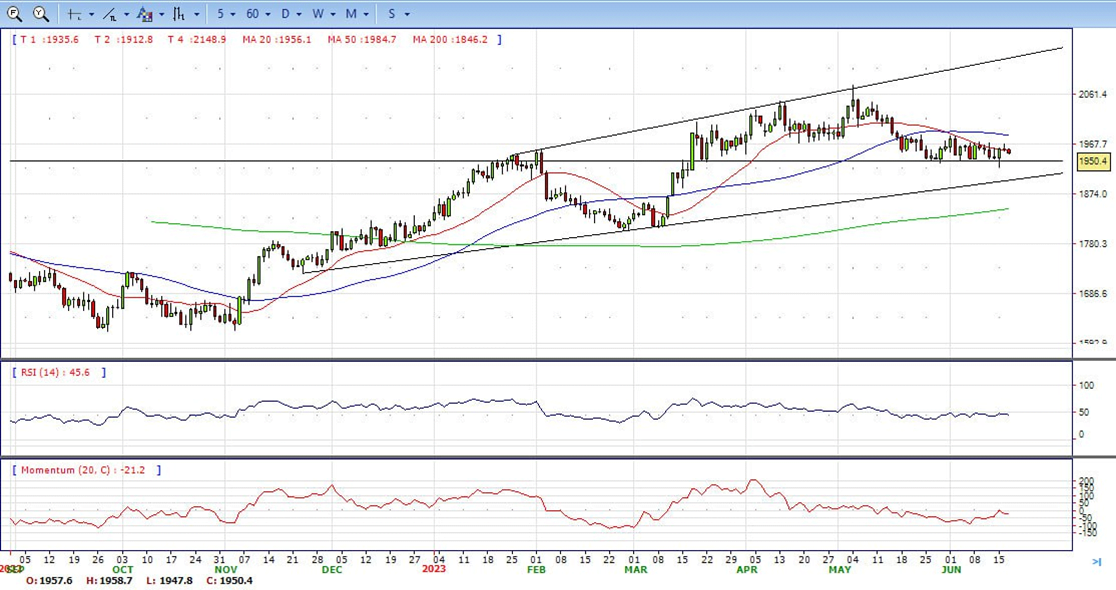
- Gold price stabilized around 1950, down for the day and bearish in the daily chart. The gold price stabilizes below 20 SMA, suggesting bearish strength in short term. Meanwhile, the 20 SMA started turning flat but continued developing below 50 SMA, indicates bears not exhausted yet. On upside, the immediate resistance is 1985, break above this level will open the gate for more advance to 2000 area.
- From a technical perspective, the RSI indicator holds below the midline and stabilizes around 45, on a bearish strength. While the Momentum indicator also stabilized in the negative territory, suggests downward potentials. On downside, the immediate support is 1925, below this area may resume the decline to 1900.


- The USD/JPY slightly advanced on Monday to the 142.00 area. US traders are celebrating Juneteenth and markets are relatively quiet. Investors seem to be consolidating gains after the USD/JPY pair increased more than 100 pips on Friday.
- Last Wednesday, Jerome Powell stated that the Fed opted for a hike pause, and that officials needed additional information to assess its implications on monetary policy. In that sense, US Housing data to be released on Tuesday, followed by Jobless Claims and S&P PMIs on Thursday and Friday, respectively, may impact their expectations regarding the next July meeting. In addition, Chair Powell’s testimony before Congress on Wednesday may trigger some reaction in USD price dynamics.
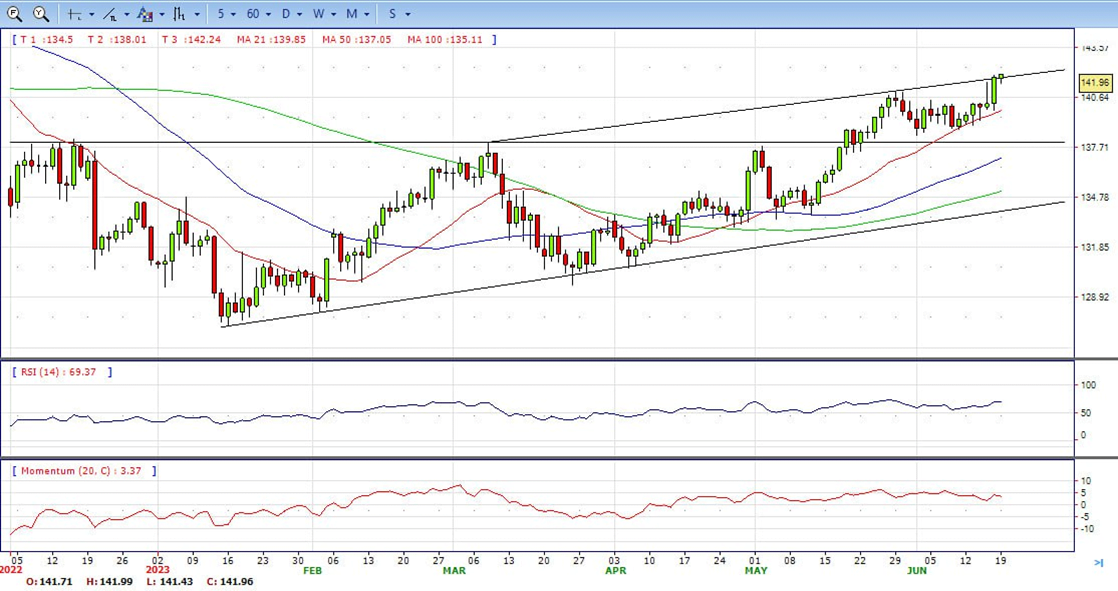
- The USD/JPY pair stabilized around 141.97, up for the day and bullish in the daily chart. The price stabilizes above 20 and 50 SMA, suggests bullish strength in short term. Meanwhile, 20 SMA continued accelerating north and developing above longer ones, indicating bulls not exhausted. On upside, overcome 142.00 may encourage bulls to challenge 144.00, break above that level will open the gate to 145.50.
- Technical indicators suggest the bullish strength. RSI stabilizes around 69, while the Momentum indicator stabilizes above the midline, suggests upward potentials. On downside, the immediate support is 140.80, break below this level will open the gate to 139.80 area.
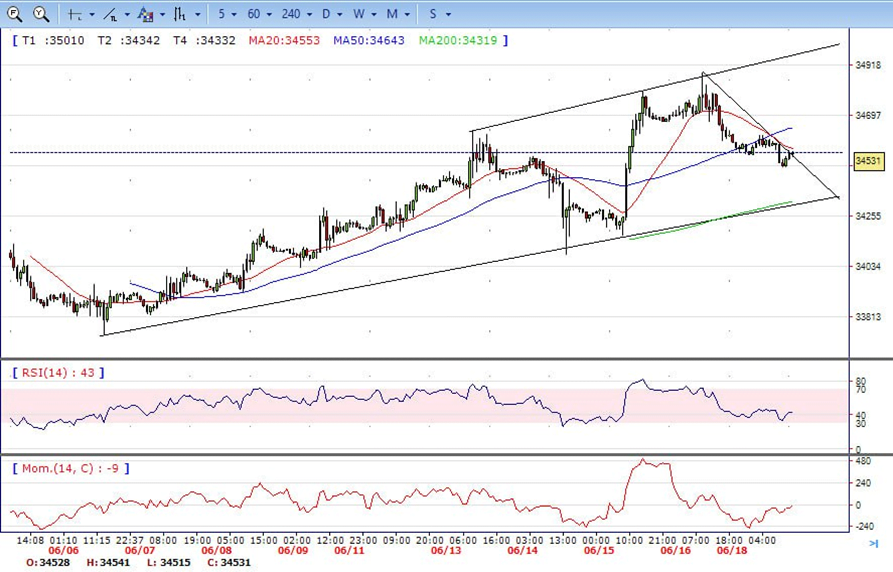
- DJI slightly down on Monday due to US holiday. It declined to 34470 area and then trimmed some losses and ended the day around 34530, below 20 SMA, suggests bearish strength. Meanwhile, 20 SMA continued accelerating south and heading towards longer ones, suggests bears not exhausted yet. On upside, overcome 34900 may encourage bulls to challenge 35250, break above that level will open the gate to 35500.
- Technical indicators suggest the bearish movement. RSI stabilizes around 43, while the Momentum indicator stabilizes below the midline, suggests downward potentials. On downside, the immediately support is 34320, break below this level will open the gate for more decline to 34000 area.
- Brent consolidated in the familiar range on Monday due to US holiday, traded between intraday low 75.30 area to intraday high 76.93 level. It ended the day around 76.10, modestly down for the day and indicates bullish sign in the hourly chart. Meanwhile, the 20 SMA continued accelerating north and developing above longer ones, indicates bulls not exhausted yet. On upside, overcome 77.00 may encourage bulls to challenge 78.50, break above that level will open the gate to 79.50.
- Technical indicators also suggest bullish movement, hovering above the midline. RSI stabilizes at 52, while the Momentum indicator stabilizes above the midline, suggests upward potentials. On downside, the immediately support is 75.00, break below this level will open the gate for more decline to 74.00 area.


