20/02/2023 Daily Reports
- EUR/USD drops to multi-week lows in the 1.0610 region at the end of the week, it then trimmed all the losses and ended the day near 1.0700, still bearish in the daily chart.
- The pair saw its losses accelerate in past hours in response to the persistent hawkish narrative from Fed speakers – this time Mester and Bullard – while the firmer-than-expected results from the US docket also added to the renewed strength in the buck.
- Data wise in the Euroland, Producer Prices in Germany contracted at a monthly 1.0% in January and rose 17.8% over the last twelve months. In addition, France’s final figures saw the CPI rise 0.4% MoM in January and 6.0% vs. the same month of 2022. Later in the session, EMU’s Current Account results are also due.
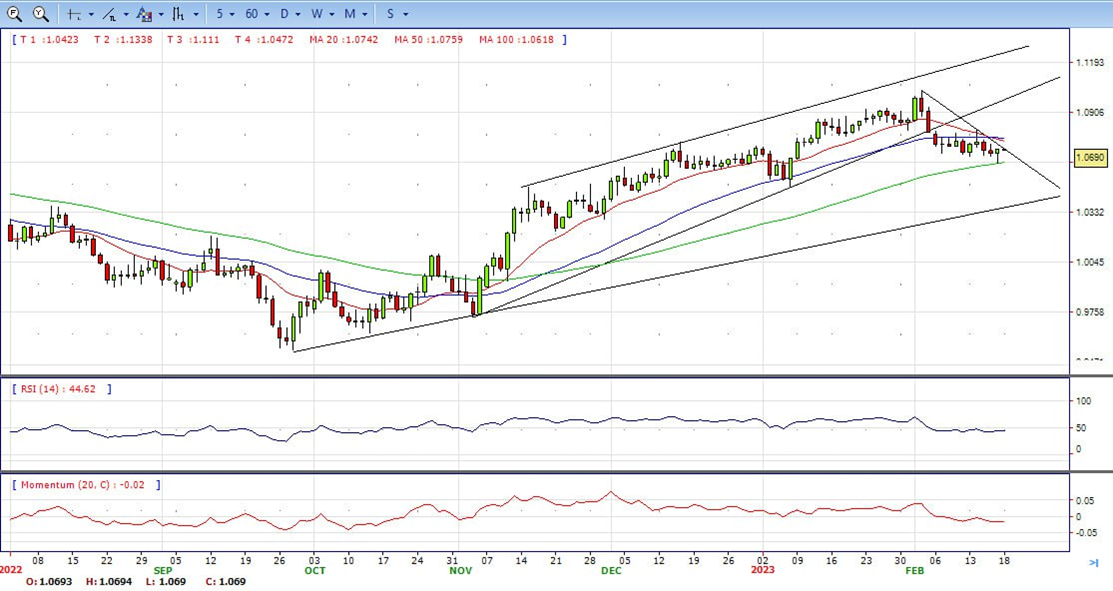
- The EUR/USD pair is trading near the 1.0695, unchanged for the day with bearish stance in daily chart. The pair still stabilized below 20 and 50 SMA, indicates bearish strength. Meanwhile, the 20 SMA started turning south and heading towards longer ones, suggests bears not exhausted yet. On upside, the immediate resistance is 1.0800, break above this level will extend the advance to 1.0930.
- Technical readings in the daily chart support the bearish stance. The RSI indicator stabilizes around 45. The Momentum indicator holds below the midline, indicating downward potentials. On downside, the immediate support is 1.0610 and below this level will open the gate to 1.0470.
The GBP/USD is staging a recovery after diving to fresh February lows around 1.1914 in the mid-North American session, bolstered by overall USD weakness. At the time of writing, the GBP/USD is exchanging hands near the 1.2030 figure, above its opening price by 0.30%.
Data from both sides of the Atlantic kept the GBP/USD pressured. A UK inflation report on Tuesday contributed to speculations that the BoE would not hike rates as aggressively as expected. That, alongside softer than expected CPI for January in the US, which exceeded estimates by bank analysts, incremented the likelihood of further tightening by the US Fed.
Another factor that influenced investors’ reaction was the Philadelphia Fed Manufacturing Index, which collapsed, but comments in the poll by business executives commented that input prices jumped for the first time in 10 months. Given the backdrop, money market futures are pricing in a more hawkish Federal Reserve.
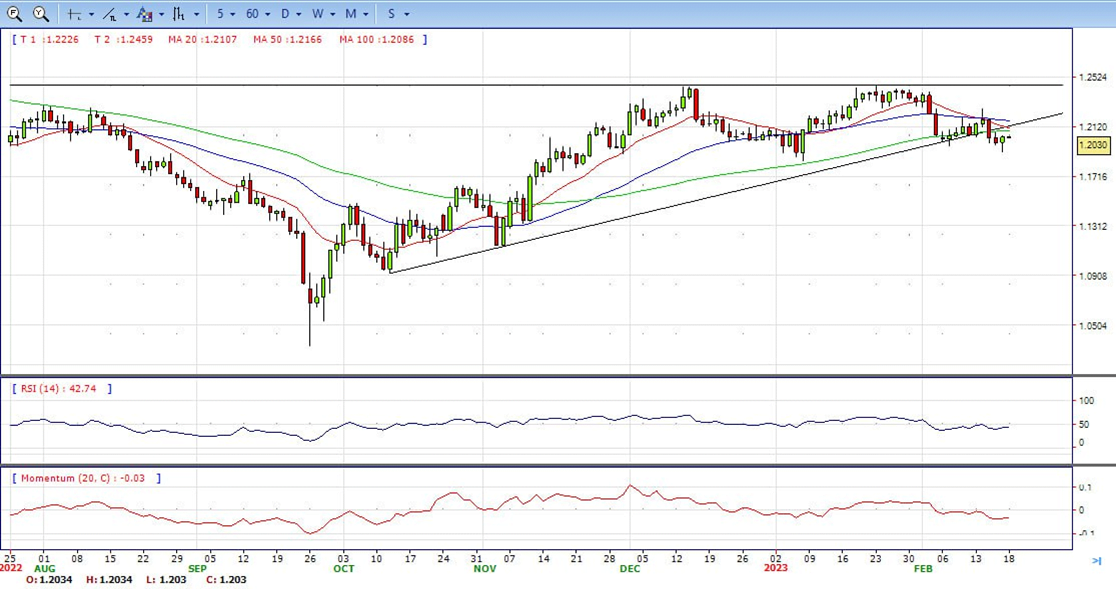
The GBP/USD offers bearish stance in daily chart. Cable stabilizes below 20 and 50 SMA, indicating bearish strength in short term. Meanwhile, the 20 SMA continued accelerating south and heading towards longer ones, suggests bears not exhausted yet. On upside, The immediate resistance is 1.2080 with a break above it exposing to 1.2190.
Technical readings in the daily chart support the neutral to bearish stances. RSI indicator stabilizes around 44, while the Momentum indicator stabilizes below the midline, suggesting downward potentials. On downside, the immediate support is 1.1910, unable to defend this level will resume the decline to 1.1840.


- Gold spot price tumbled for the third day of the week, down almost 0.65% in the aftermath of incoming US economic data, which turned sentiment sour on speculations that further Fed tightening is on it’s way. At the time of writing, the XAU/USD is trading at $1,841.80.
- US equities are trading with losses on risk aversion. Economic data revealed an uptick in inflationary pressures in the US on St Valentine’s Day. Although the US Consumer Price Index for January came in short of the previous month’s readings, the data still exceeded forecasts.
- Given this backdrop, the US Fed job on inflation is not yet done. A message reiterated by Fed officials on Thursday, including Cleveland Fed President Loretta Mester and St. Louis Fed James Bullard. All in all it’s a bad sign for Gold.
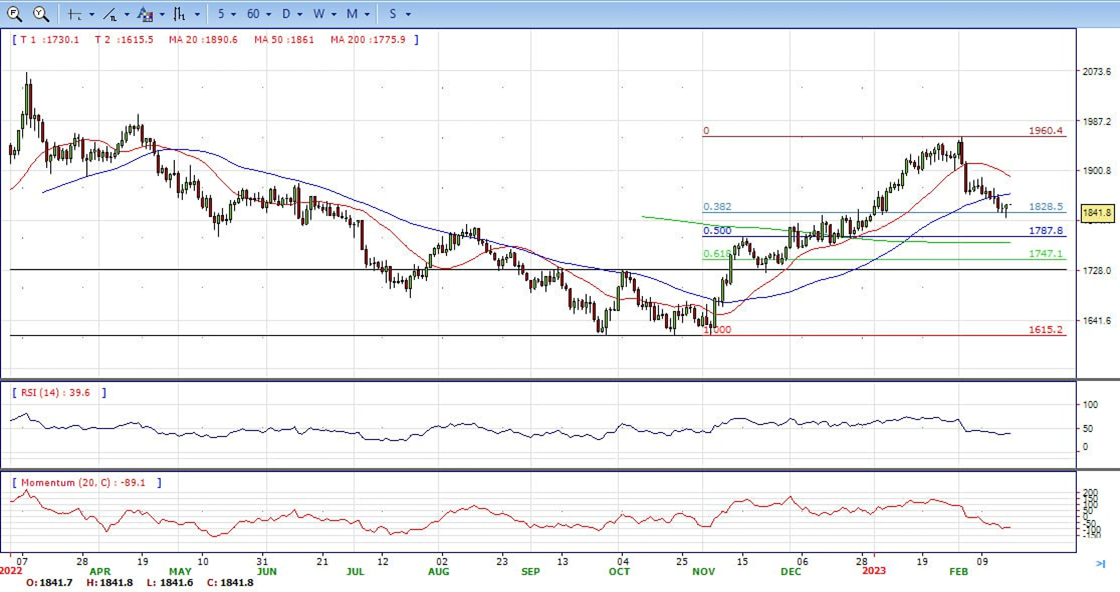
- Gold price stabilized around 1841, slightly up for the day and bearish in the daily chart. The gold price stabilized below 20 and 50 SMA, suggesting bearish strength in short term. Meanwhile, the 20 SMA started turning south and heading towards longer ones, indicating bears not exhausted yet. On upside, the immediate resistance is 1860, break above this level will open the gate for more advance to 1891 area.
- From a technical perspective, the RSI indicator holds below the mid-line and stabilizes around 39, on a bearish strength. The Momentum indicator hold below the midline, suggests downward potentials. On downside, the immediate support is 1818, below this area may resume the decline to 1800.


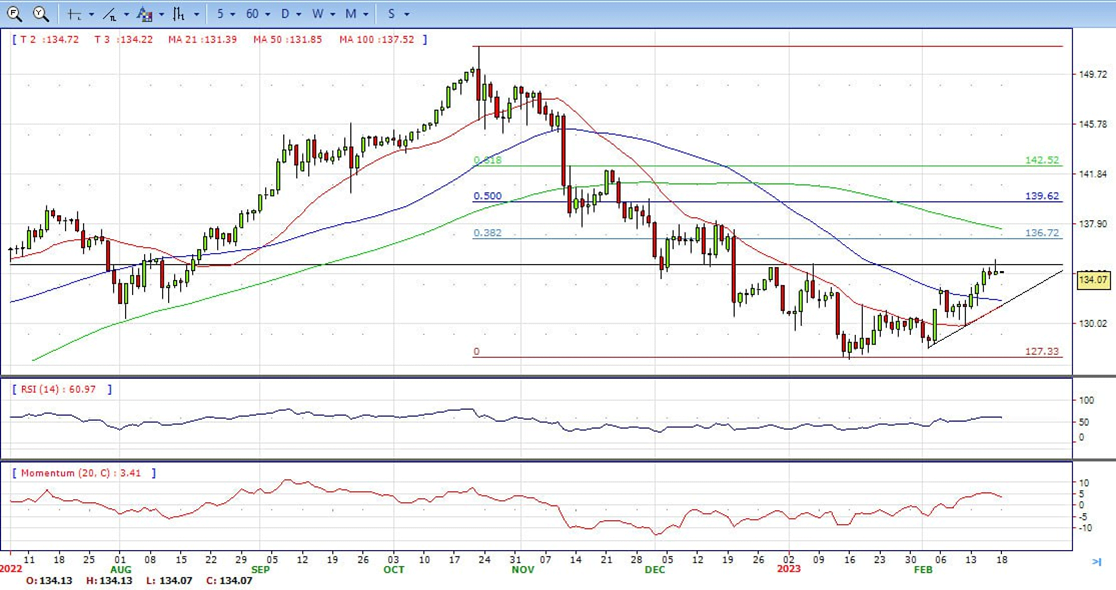
- The USD/JPY pair gains strong positive traction on the last day of the week and climbs to a nearly two-month high heading into the North American session. The pair is currently placed around the 135.00 psychological mark and seems poised to build on the recent appreciating move witnessed over the past two weeks or so.
- The JPY weakens across the board amid the uncertainty over the path of monetary policy under new BoJ Governor Kazuo Ueda. The US Dollar, on the other hand, hits a fresh six-week high amid expectations that the Fed will stick to its hawkish stance in the wake of stubbornly high inflation. This turns out to be a key factor pushing the USD/JPY pair higher.
- In fact, the yield on the benchmark 10-year US government bond climbs to the highest level since late December. This results in the widening of the US-Japan rate differential, which is seen driving flows away from the JPY and providing an additional boost to the USD/JPY pair. That said, a combination of factors could limit losses for the JPY and cap the upside for the major.
- The USD/JPY pair stabilized around 134.07, slightly up for the day and bullish in the daily chart. The stabilizes above 20 and 50 SMA, suggests bullish strength in short term. Meanwhile, 20 SMA continued accelerating north and heading towards longer ones, indicating bulls not exhausted. On upside, overcome 135.10 may encourage bulls to challenge 136.70, break above that level will open the gate to 138.20.
- Technical indicators suggest the bullish strength. RSI stabilizes around 60, while the Momentum indicator stabilizes in the positive territory, suggests upward potentials. On downside, the immediate support is 132.50, break below this level will open the gate to 131.50 area.
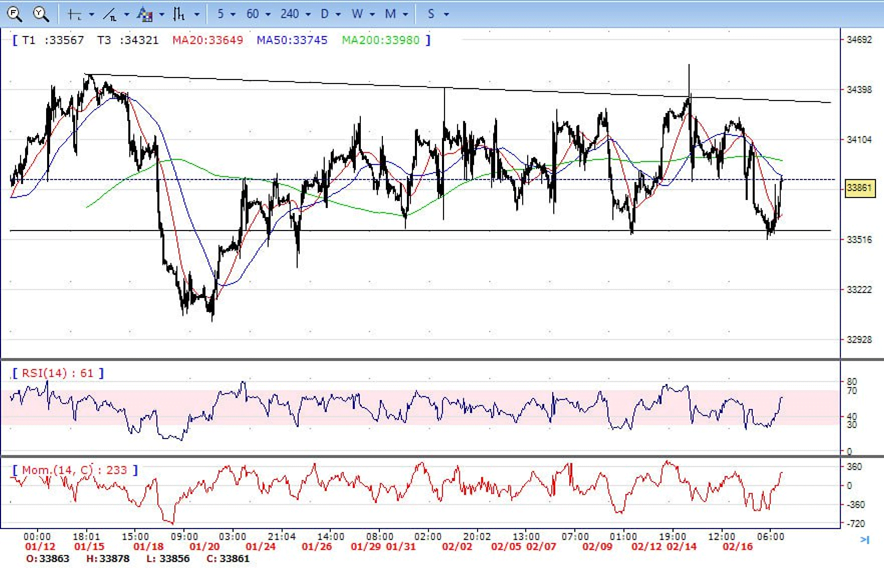
- DJI plunged to the daily low near 33510 area on the first half of the day. It then bounced from here and ended the day around 33860, up for the day and indicates neutral to bullish sign in the hourly chart. Right now market is standing above 20 SMA, suggests bullish strength. Meanwhile, 20 SMA started turning north and heading towards longer one, suggests bulls not exhausted yet. On upside, overcome 34100 may encourage bulls to challenge 34370, break above that level will open the gate to 34550.
- Technical indicators suggest the bullish movement, developing above the mid-line. RSI stabilizes around 62, while the Momentum indicator stabilizes in the positive territory, suggests upward potentials. On downside, the immediately support is 33500, break below this level will open the gate for more decline to 33350 area.
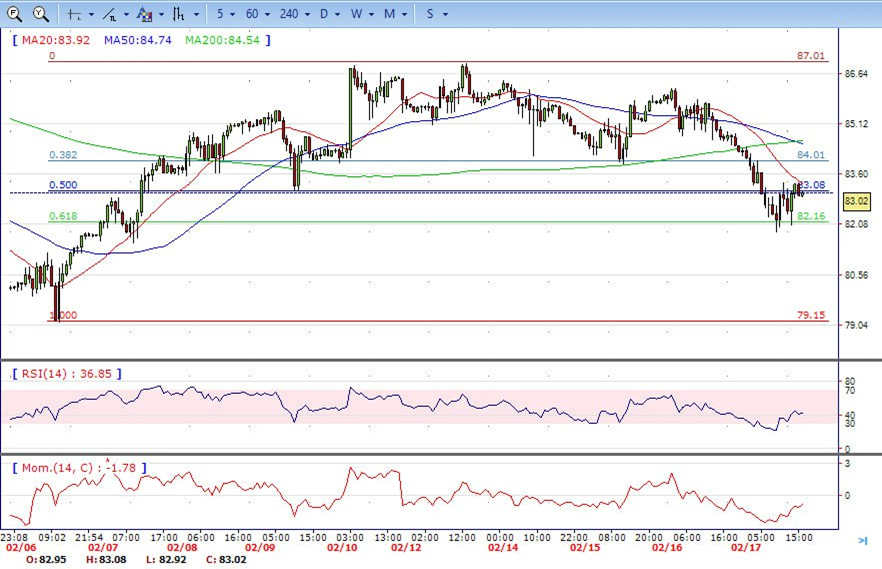
- The Brent still under the sell pressure, dropped to intraday low 81.80 area then trimmed some losses and ended the day around 83.00. The price currently stabilizes below 20 and 50 SMA, suggests bearish strength in the hourly chart. Meanwhile, the 20 SMA continued accelerating south and developing far below longer ones, indicates bears not exhausted yet. On upside, overcome 84.00 may encourage bulls to challenge 85.50, break above that level will open the gate to 87.00.
- Technical indicators also suggest bearish movement, hovering below the midline. RSI drops to 42, while the Momentum indicator stabilizes in negative territory, suggests downward potentials. On downside, the immediately support is 81.80, break below this level will open the gate for more decline to 79.10 area.