19/10/2022 Daily Reports
- Eurodollar’s recovery from last week’s lows at 0.9635 has lost steam right below 0.9900 and the pair pulled back to 0.9850 on Tuesday’s afternoon US Trading session. The euro, however, remains moderately positive on the daily chart.
- The common currency managed to extend gains in the early European session, pushing the pair to session highs at 0.9875. European and US stock markets have advanced for the second consecutive day as the enthusiasm for Britain’s U-turn on the tax cuts plan is offsetting concerns about the deterioration in the global economic perspectives.
- In the US, a brighter-than-expected industrial report has offered some respite to the USD. Industrial production increased 0.4% in September, beating expectations of a 0.1% increment, while capacity utilization reached a level of 80.3% against the market consensus of 80.0%.
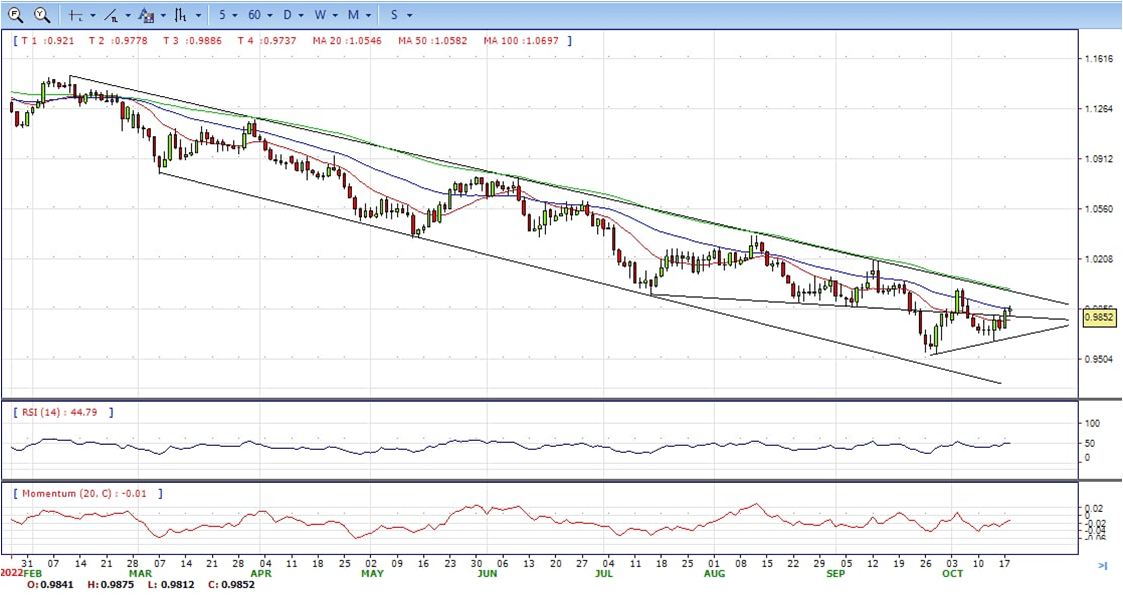
- The EUR/USD pair is trading near the 0.9850, up for the day with the neutral stance in daily chart. The pair stabilized between 20 and 50 SMA, indicates neutral strength. Meanwhile, the 20 SMA continued developing below longer ones despite it started turning flat, suggests bears not exhausted yet. On upside, the immediate resistance is 0.9875, break above this level will extend the advance to 1.0000.
- Technical readings in the daily chart support the netural stances. The RSI indicators hovering near the midlines and stabilized around 52. The Momentum indicator stabilized in the negative territory, indicating downward potentials. On downside, the immediate support is 0.9800 and below this level will open the gate to 0.9700.
- The pound is giving away gains on Tuesday, following a 1% rally on Monday as the UK Government ditched most of the tax cuts plan announced in September. The sterling us testing prices sub-1.1300 on retreat from Monday’s highs at 1.1445.
- UK finance minister’s U-turn on the controversial mini-Budget plan has dampened hopes of aggressive monetary tightening by the Bank of England. This has discouraged GBP buyers, which has been one of the main reasons behind Tuesday’s reversal.
- Earlier in the day, the pound saw some positive price action after the Financial Times reported that the Bank of England might be considering delaying the start of its quantitative tightening (QT) gilt sales from the scheduled date of Oct. 31, after having already delayed it from Oct. 6.
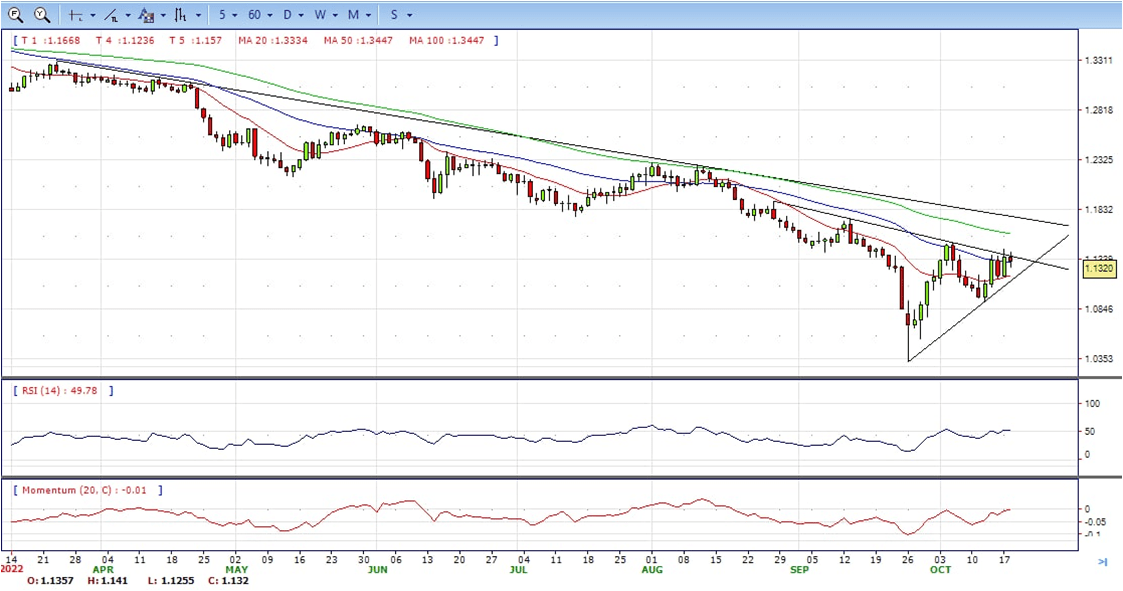
- The GBP/USD offers neutral to bullish stance in daily chart. Cable now is stabilizing above 20 and 50 SMA, indicating bullish strength in short term. However, the 20 SMA continued developing below longer ones despite it started turning north and upside still capped by the long-term bearish trend line, suggesting bears not exhausted yet. On upside, The immediate resistance is 1.1500 with a break above it exposing to 1.1600.
- Technical readings in the daily chart support neutral stances. RSI indicator stabilized around 52, while the Momentum indicator stabilized near the midline, suggesting directionless potentials. On downside, the immediate support is 1.1250, unable to defend this level will resume the decline to 1.1100.


- Gold surrenders its modest intraday gains to the $1,660 zone and retreats to the lower end of its daily trading range, Currently hovering around the $1,651 area, the emergence of some US dollar dip-buying is seen as a key factor weighing on the dollar-denominated commodity.
- In fact, the USD Index, which measures the greenback’s performance against a basket of currencies, rebounds swiftly from a one-and-half-week low touched earlier this Tuesday. The prospects for a more aggressive policy tightening by the Fed, reaffirmed by hotter US consumer inflation figures released last week, remain supportive of elevated US Treasury bond yields. This, in turn, assists the greenback to regain positive traction and drives flows away from the non-yielding gold.
- Apart from this, a V-shaped recovery in the global risk sentiment – as depicted by the ongoing strong follow-through rally in the equity markets – further undermines the safe-haven XAU/USD. The downside, however, remains cushioned, at least for the time being, amid worries about a deeper global economic downturn. Rapidly rising borrowing costs, along with geopolitical risks and China’s strict zero-COVID policy, have been fueling recession fears and should cap the optimism.
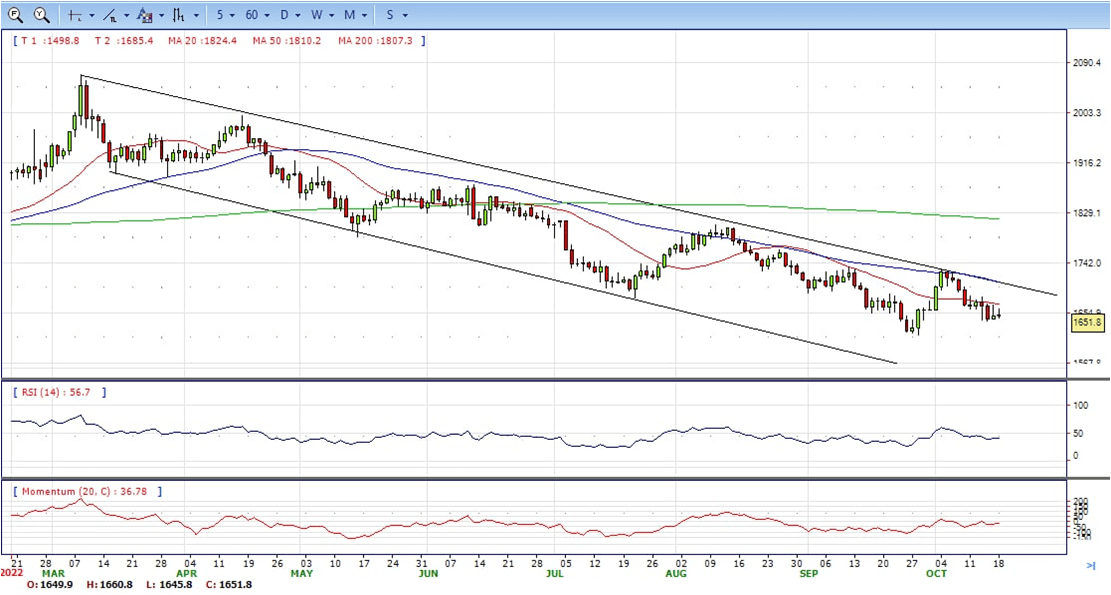
- Gold price stabilized around 1651, unchanged for the day and bearish in the daily chart. The gold price stabilized below 20 and 50 SMA, suggesting bearish strength. Meanwhile, the 20 SMA continued developing far below longer ones despite it started turning flat, indicating bears not exhausted yet. On upside, the immediate resistance is 1684, break above this level will open the gate to extend the advance to 1700 area.
- From a technical perspective, the RSI indicator hold below the midline and stabilized around 43, suggesting bearish strength. The Momentum indicator struggled below the midline, suggests downward potentials. On downside, the immediate support is 1640, below this area may resume the decline to 1615.


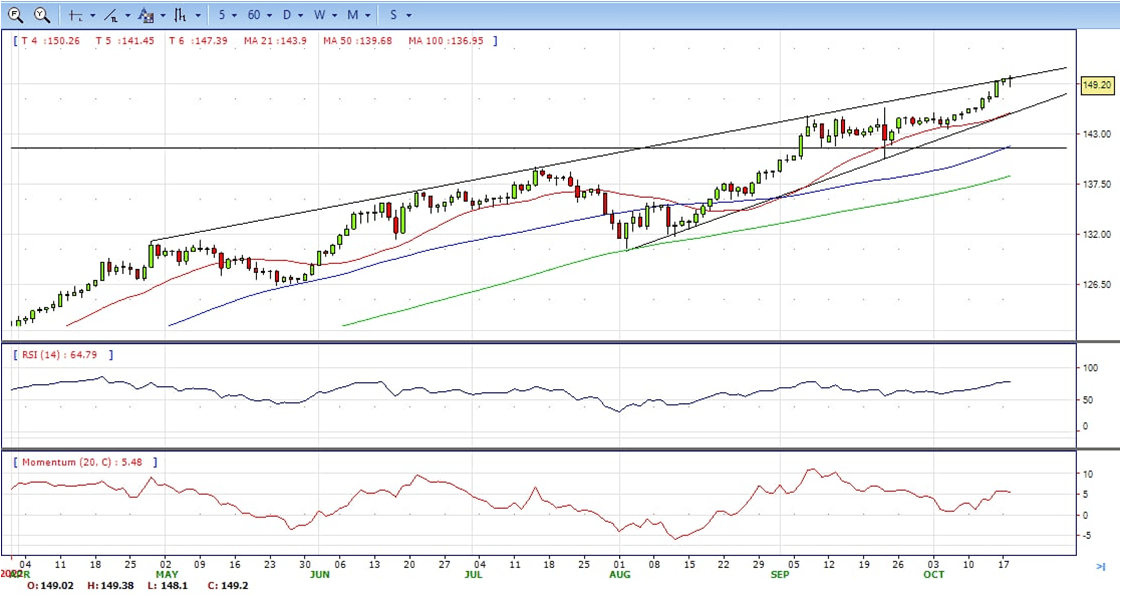
- The USD/JPY pair reverses a knee-jerk intraday fall to the 148.00 neighbourhood and climbs back closer to a 32-year peak touched earlier this Tuesday. The pair is currently placed around the 149.00 mark, though lacks bullish conviction as traders await a fresh catalyst before positioning for any further appreciating move.
- Japan’s Finance Minister Shunichi Suzuki warns again on Tuesday that the government will take decisive action against excessive, speculator-driven currency moves. This turns out to be a key factor holding back bulls from placing aggressive bets around the USD/JPY pair and acting as a headwind for spot prices. The downside, however, remains cushioned amid a big divergence in the monetary policy stance adopted by the Bank of Japan and the Federal Reserve.
- In fact, the yield on the benchmark 10-year US government bond holds steady near the 4.0% threshold, widening the US-Japan rate differential. Apart from this, a strong recovery in the global risk sentiment continues to undermine the safe-haven JPY and supports prospects for an extension of the well-established bullish trend. That said, extremely overbought conditions might hold back traders from placing aggressive bets around the USD/JPY pair.
- The USD/JPY pair stabilized around 149.20, up for the day and bullish in the daily chart. The price still maintains the upward slope and stabilized above all main SMAs, suggests bullish strength. Meanwhile, 20 SMA continued accelerating north and developing above longer ones, indicating bulls not exhausted in the long term. On upside, overcome 150.00 may encourage bulls to challenge 151.00, break above that level will open the gate to 152.00.
- Technical indicators suggest the bullish strength. RSI stabilized around 78, while the Momentum indicator continued developing above the midline, suggests upward potentials. On downside, the immediate support is 148.00, break below this level will open the gate to 147.00 area.
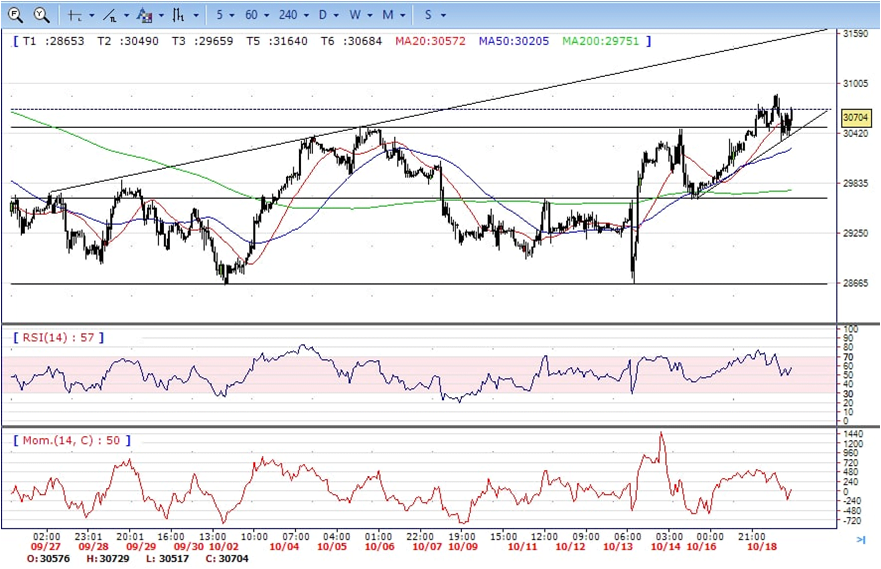
- DJI continued the advance on Tuesday, jumped to intraday high 30880 area before tumbled to 30330 daily low. It recovered some losses and ended the day at around 30700, up for the day and bullish in the hourly chart. It stabilized above all main SMAs, suggests bullish strength. Meanwhile, 20 SMA continued accelerating north and developing above longer one, suggests bulls not exhausted yet. On upside, overcome 30900 may encourage bulls to challenge 31100, break above this level will open the gate to 31350.
- Technical indicators suggest the bullish strength. RSI stabilized around 59, while the Momentum indicator stabilized above the midline, suggests upward potentials. On downside, the immediate support is 30300, break below this level will open the gate for more decline to 30000 area.
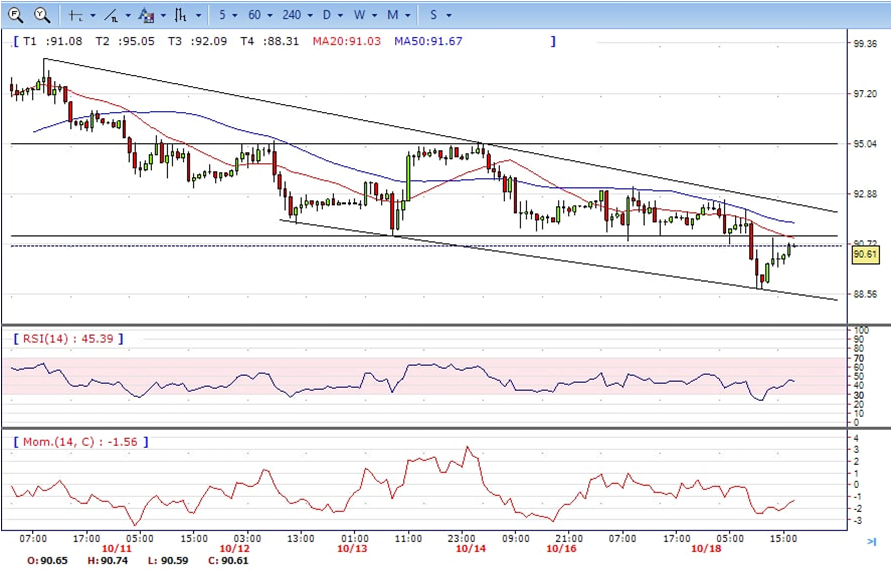
- Brent under the sell pressure, tumbled from 92.60 area to intraday low 88.80. It trimmed some lossed at US session and and ended Tuesday at around 90.60, down for the day and still bearish in the hourly chart. The price stabilized below all main SMAs, suggests bearish strength in short term. Meanwhile, the 20 SMA started turning south and heading towards longer ones, indicating bears not exhausted yet. On upside, overcome 91.00 may encourage bulls to challenge 93.00, break above this level will open the gate to 95.20.
- Technical indicators suggest the bearish movement, hovering below the midline. RSI stabilized around 44, while the Momentum indicator stabilized in negative territory, suggests downward potentials. On downside, the immediate support is 88.80, break below this level will open the gate for more decline to 86.30 area.