19/06/2023 Daily Reports
- EUR/USD rally stalled in the aftermath of the ECB rate hike, trimming some of its previous day’s gains amidst mixed market sentiment. Following the Fed and the ECB’s decisions, central bank speakers are grabbing the most headlines, amidst the lack of news, besides EU inflation. At the time of writing, the EUR/USD is trading at 1.0938, down 0.15%.
- Market participants’ sentiment is mixed, as shown by US equities. The latest round of economic data from the United States (US showed an improvement in Consumer Sentiment, as revealed by the University of Michigan at 68.0 vs. May’s Final 64.9. Regarding inflation expectations for a one-year period, they were downward revised from May 4.2%, while June data came at 3.3%.
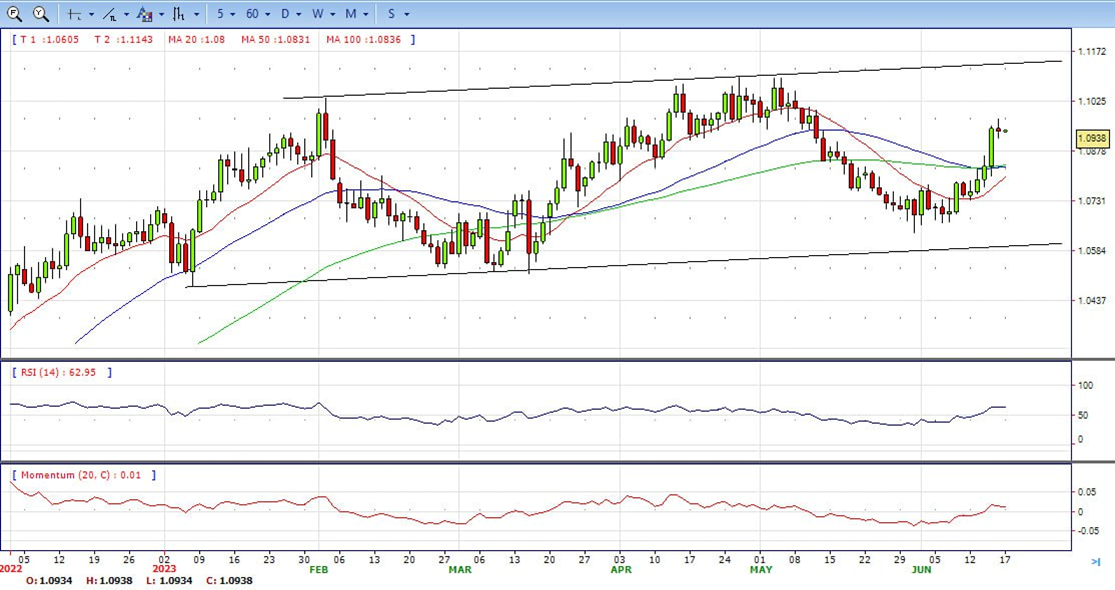
- The EUR/USD pair is trading near the 1.0940, unchanged for the day with bullish stance in daily chart. The pair stabilized above all main SMAs, indicates bullish strength. Meanwhile, the 20 SMA started turning north and heading towards 50 and 200 SMA, suggests bulls not exhausted yet. On upside, the immediate resistance is 1.0970, break above this level will extend the advance to 1.1010.
- Technical readings in the daily chart support the bullish stance. The RSI indicator stabilizes around 63. The Momentum indicator holds above the midline, indicating upward potentials. On downside, the immediate support is 1.0860 and below this level will open the gate to 1.0800.
- GBP/USD trades with solid gains on Friday, set to finish its weekly rise in six months after UK economic data supported additional BoE tightening. The US Fed keeping rates unchanged was a headwind for the USD. Hence, the GBP/USD is trading at 1.2820, up 0.30%, after hitting a low of 1.2768.
- Several factors benefitted the GBP during the. Firstly, market sentiment remains upbeat, with most global equities trading with gains. That, alongside robust employment data in the UK, spurred a reaction in the bond market, with most investors expecting at least 125 bps of additional tightening by the BoE, which current Bank Rate sits at 4.50%.
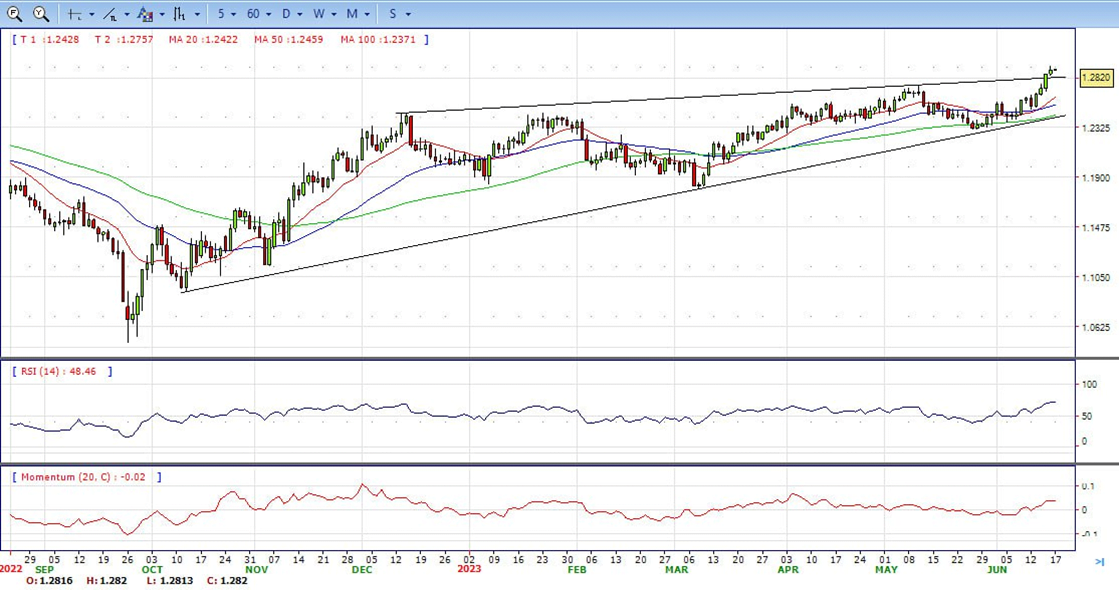
- The GBP/USD offers bullish stance in daily chart. Cable stabilizes above 20 and 50 SMA, indicating bullish strength in short term. Meanwhile, the 20 and 50 SMA started turning flat but continued developing above longer ones, suggests bulls not exhausted yet. On upside, the immediate resistance is 1.2850 with a break above it exposing to 1.3000.
- Technical readings in the daily chart support the bullish stances. RSI indicator stabilizes around 71, while the Momentum indicator stabilizes above the midline, suggesting upward potentials. On downside, the immediate support is 1.2760, unable to defend this level will resume the decline to 1.2630.


- Gold dropped from a high of $1,967 on Friday’s US session and cleaned up the prior session’s length, creating a fresh low of the day down at $1,953.32. At the time of writing, it is trading near 1958.
- The focus has been on the Federal Reserve which issued a hawkish outlook for interest rates on Wednesday even as it ended its two-day meeting without hiking rates. The Fed forecast 50 basis points of additional increases prior to year-end. Meanwhile, the dollar rose early following three losing sessions. Bond yields were also higher, with the US two-year note last seen paying 4.733%, up 8.2 basis points and the 10-year note up 4.9 basis points to 3.772%. DXY traded 0.13% higher form a low of 102.006 to a high of 102.427.
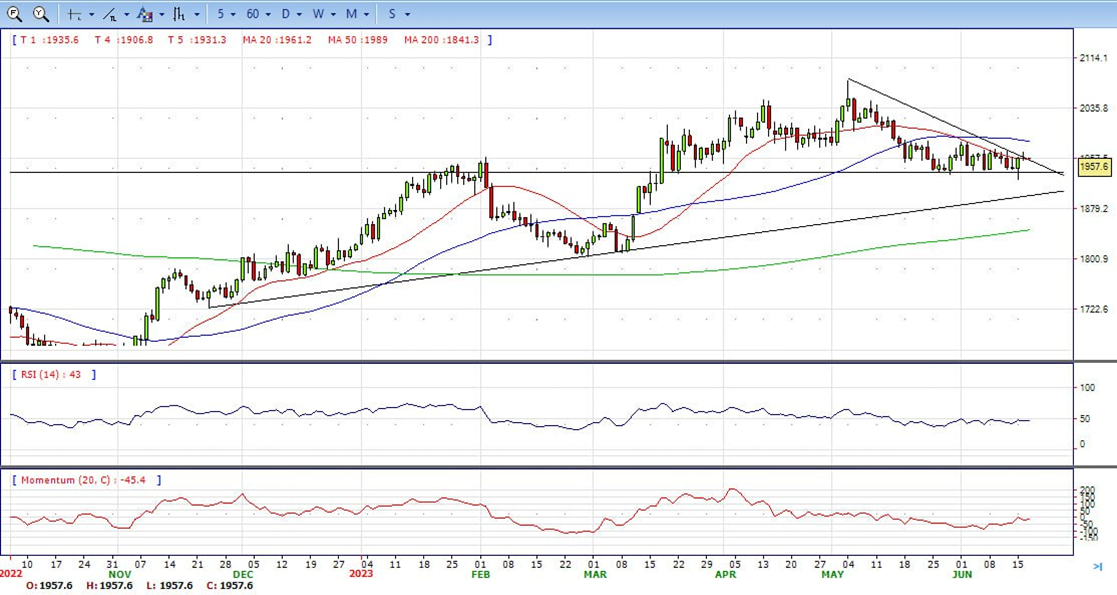
- Gold price stabilized around 1958, unchanged for the day and bearish to neutral in the daily chart. The gold price stabilizes near 20 SMA, suggesting neutral strength in short term. Meanwhile, the 20 SMA started turning flat but continued developing below 50 SMA, indicates bears not exhausted yet. On upside, the immediate resistance is 1985, break above this level will open the gate for more advance to 2000 area.
- From a technical perspective, the RSI indicator holds near the midline and stabilizes around 47, on a bearish strength. The Momentum indicator also stabilized near the midline, suggests directionless potentials. On downside, the immediate support is 1925, below this area may resume the decline to 1900.


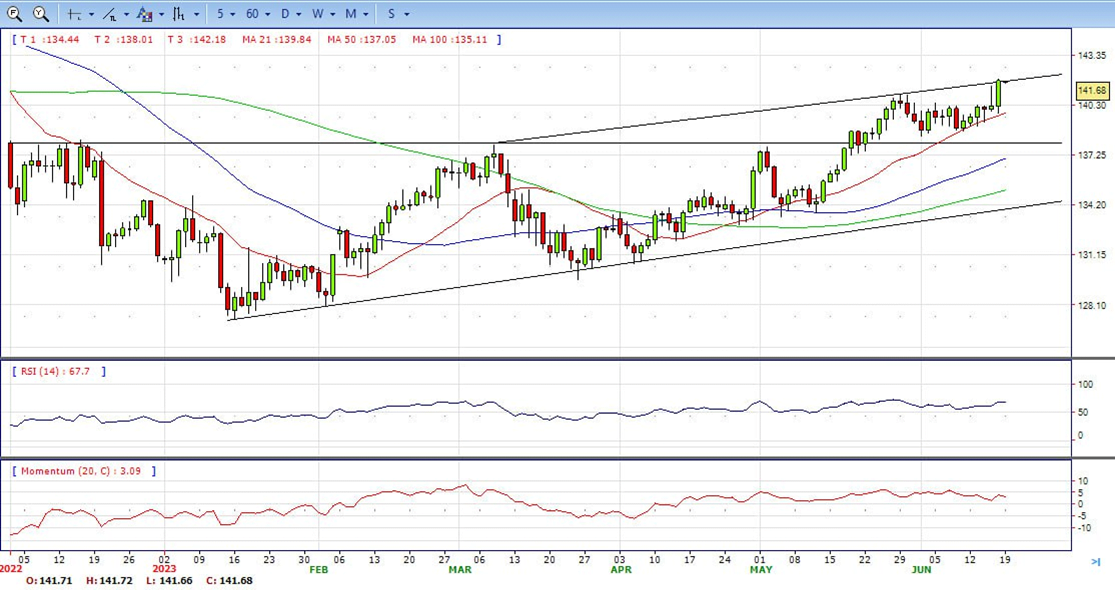
- USD/JPY soared more than 1% on Friday due to safe-haven flows and a jump in US Treasury bond yields. On its way north, the USD/JPY reached a new YTD high of 141.91 after bouncing off daily lows of 139.85. At the time of writing, the USD/JPY is exchanging hands at 141.70.
- Data released on Friday showed Consumer sentiment in the US improved in early June measured by the University of Michigan’s Consumer Confidence Index that rose to 63.9 from 59.2 in May, surpassing the market expectation of 60. US Treasury yields spiked after the report with the 10-year reaching 3.80%. As yields pullback, the USD/JPY lost momentum. If the pair manages to stay above the 141.50 area, the Dollar could gain support. However, if it fails to do so, a correction seems likely.
- The USD/JPY pair stabilized around 141.70, up for the day and bullish in the daily chart. The price stabilizes above 20 and 50 SMA, suggests bullish strength in short term. Meanwhile, 20 SMA continued accelerating north and developing above longer ones, indicating bulls not exhausted. On upside, overcome 142.00 may encourage bulls to challenge 144.00, break above that level will open the gate to 145.50.
- Technical indicators suggest the bullish strength. RSI stabilizes around 68, while the Momentum indicator stabilizes above the midline, suggests upward potentials. On downside, the immediate support is 140.80, break below this level will open the gate to 139.80 area.
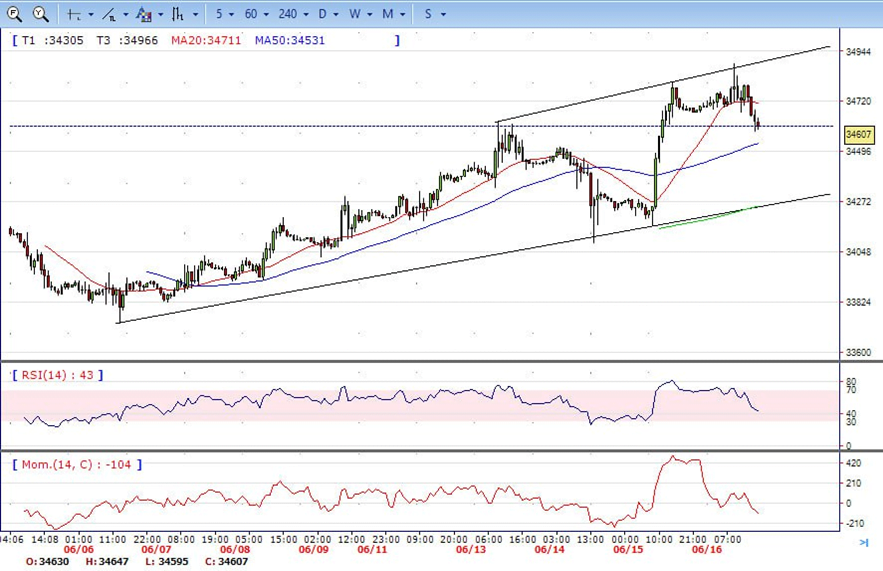
- DJI climbed to high 34887 on Friday, but failed to hold that gains and tumbled to intraday low 34600 level to ended the day, below 20 SMA, suggests bearish strength. Meanwhile, 20 SMA started turning south and heading towards longer ones, suggests bears not exhausted yet. On upside, overcome 34900 may encourage bulls to challenge 35250, break above that level will open the gate to 35500.
- Technical indicators suggest the bearish movement. RSI stabilizes around 44, while the Momentum indicator stabilizes below the midline, suggests downward potentials. On downside, the immediately support is 34600, break below this level will open the gate for more decline to 34320 area.
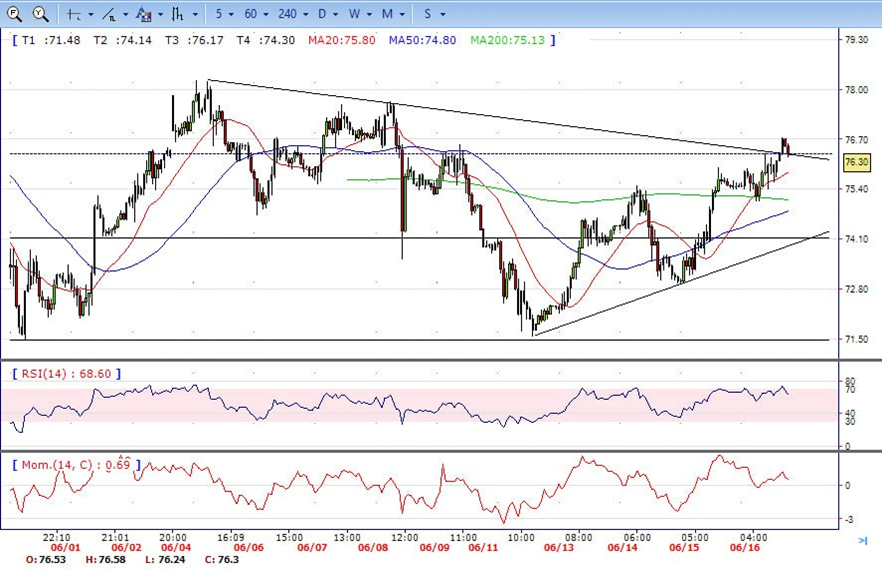
- Brent continued the advance on Friday, climbed from intraday low 75.10 area to intraday high 76.70 level. It holds most the gains and ended the day around 76.30, up for the day and indicates bullish sign in the hourly chart. Meanwhile, the 20 SMA continued accelerating north and developing above longer ones, indicates bulls not exhausted yet. On upside, overcome 76.75 may encourage bulls to challenge 77.60, break above that level will open the gate to 78.50.
- Technical indicators also suggest bullish movement, hovering above the midline. RSI stabilizes at 63, while the Momentum indicator stabilizes above the midline, suggests upward potentials. On downside, the immediately support is 75.00, break below this level will open the gate for more decline to 74.00 area.