EUR/USD
- EUR/USD pares some of its earlier gains, still trading in a positive territory amidst a busy week in the economic agenda, with major central banks set to adjust their monetary policies. The US Dollar strengthened ahead of Wednesday’s Fed decision but is yet to overshadow a solid Euro. At the time of writing, the EUR/USD exchanges hands at 1.0760, almost flat.
- Wall Street is trading with modest gains ahead of the (Fed June monetary policy meeting. The Fed is expected to keep rates unchanged, as shown by money market futures, with the CME Fed WatchTool odds for no change in June at around 71%. Nonetheless, for the next month, odds for a 25 bps lie above the 50% threshold, cementing the case for a Fed skip followed by a rate increase.
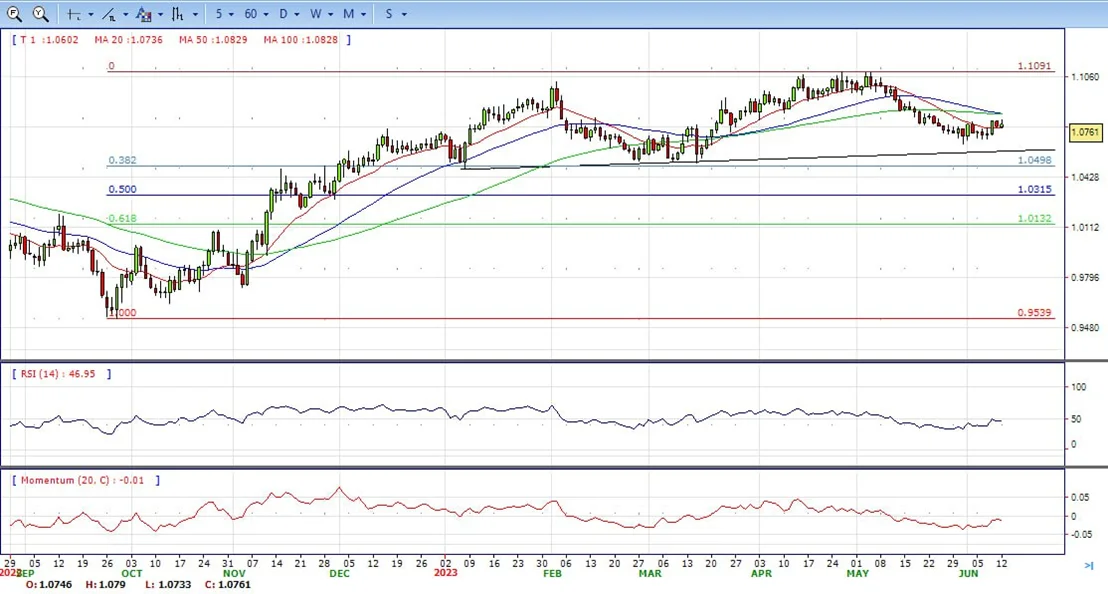
- The EUR/USD pair is trading near the 1.0760, slightly up for the day with bearish stance in daily chart. The pair stabilized below 50 and 200 SMA, indicates bearish strength. Meanwhile, the 20 SMA started turning flat but continued developing below 50 and 200 SMA, suggests bears not exhausted yet. On upside, the immediate resistance is 1.0790, break above this level will extend the advance to 1.0850.
- Technical readings in the daily chart support the bearish stance. The RSI indicator stabilizes around 47. The Momentum indicator holds below the midline, indicating bearish potentials. On downside, the immediate support is 1.0630 and below this level will open the gate to 1.0500.
Open A Demo
CDO has wide range of tools, professional and friendly support for clients to achieve their financial markets trading goals. Open a live account now to enjoy this experience with virtual deposit.
GBP/USD
- The GBP/USD pair has shown a corrective move to near 1.2500 in the US session. The Cable faced some barriers around 1.2600 as the US Dollar Index has shown a solid recovery. Investors have displayed interest in the USD Index as anxiety among investors is accelerating ahead of the interest rate decision by the Fed.
- On the Pound Sterling front, investors are awaiting the release of the United Kingdom Employment data (May). As per the estimates, Claimant Count Change is seen declining by 9.6K vs. a sheer addition of 46.7K reported in April. The Unemployment Rate for three months is seen higher at 4.0% against the prior release of 3.9%.
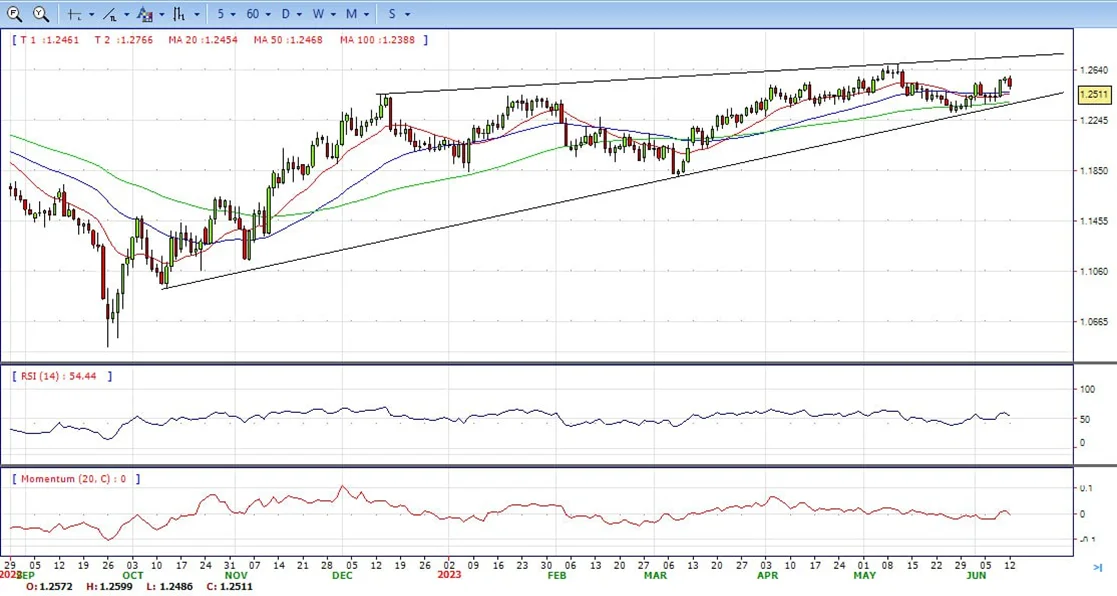
- The GBP/USD offers bullish stance in daily chart. Cable stabilizes above 20 and 50 SMA, indicating bullish strength in short term. Meanwhile, the 20 and 50 SMA started turning flat but continued developing above longer ones, suggests bulls not exhausted yet. On upside, the immediate resistance is 1.2600 with a break above it exposing to 1.2680.
- Technical readings in the daily chart support the bullish stances. RSI indicator stabilizes around 55, while the Momentum indicator stabilizes near the midline, suggesting directionless potentials. On downside, the immediate support is 1.2450, unable to defend this level will resume the decline to 1.2300.

CDO TRADER
CDO TRADER, our cutting-edge trading platform, follows the technology from the forefront with new features added continuously. Moreover, CDO TRADER is now available for Android and iOS! So it allows you to trade on the go!
XAU/USD
- Gold price is demonstrating topsy-turvy moves around $1,958.00 in the early New York session. The precious metal has turned choppy as the street is showing mixed responses toward the interest rate decision by the Fed.
- US equities are expected to open on a positive note as the S&P500 futures have generated significant gains in the European session. Market sentiment is quite upbeat as the United States economy is expected to show resilience ahead. The latest data from the Fed showed that lending and deposit activities have increased straight for three weeks in commercial banks in the week ended May 31. The demand for credit by firms seems solid despite an aggressive policy-tightening spell by Fed chair Jerome Powell.
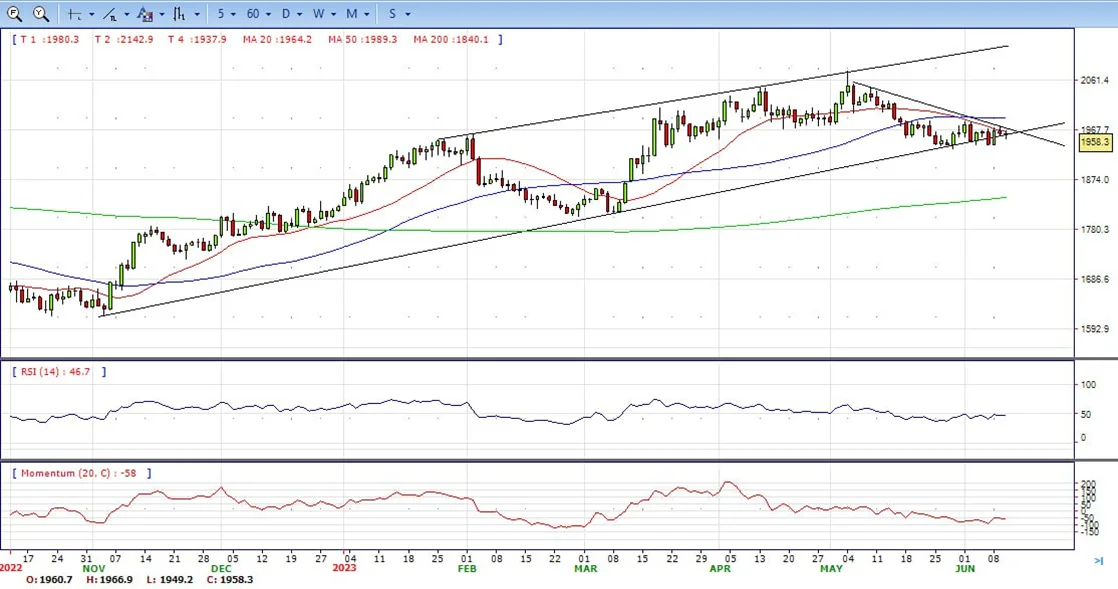
- Gold price stabilized around 1958, unchanged for the day and bearish in the daily chart. The gold price stabilizes below 20 SMA, suggesting bearish strength in short term. Meanwhile, the 20 SMA continued accelerating south and developing below 50 SMA, indicates bears not exhausted yet. On upside, the immediate resistance is 1985, break above this level will open the gate for more advance to 2000 area.
- From a technical perspective, the RSI indicator holds below the mid-line and stabilizes around 47, on a bearish strength. The Momentum indicator hold in negative territory, suggests downward potentials. On downside, the immediate support is 1931, below this area may resume the decline to 1900.
MetaTrader 4
MT4 has user friendly interface that is providing simplicity and efficiency. The traders can perform trading strategies for different products like Forex and CFD. MetaTrader 4 has over 50 built-in indicators, also it’s the tool that predicts trends and defines the appropriate entry and exit points.

USD/JPY
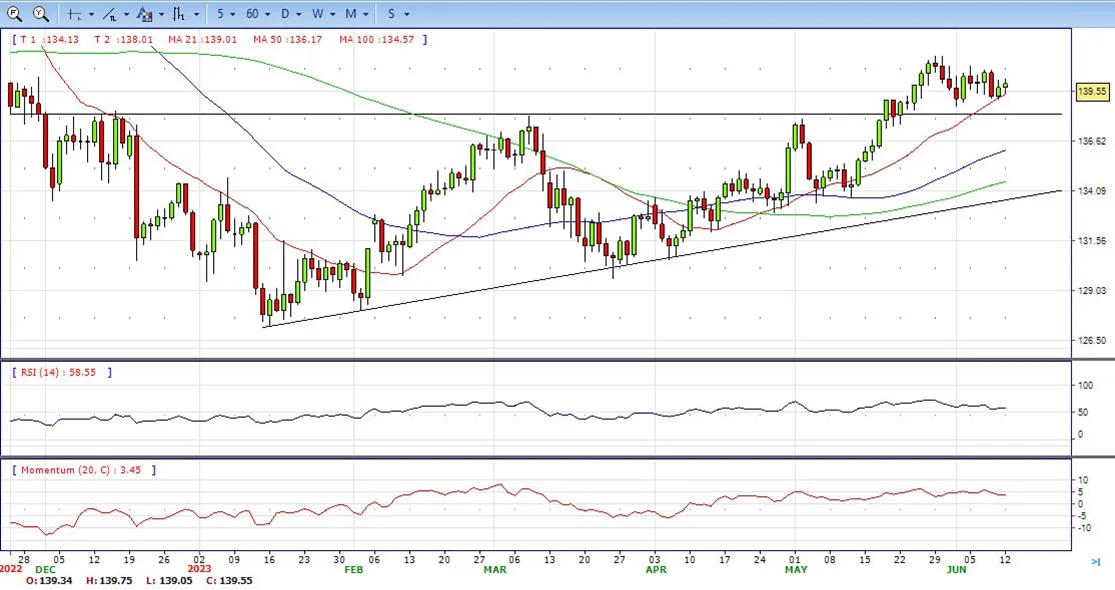
- USD/JPY turned positive at the beginning of the week, lifted by higher US Treasury bond yields as investors prepared for the US Fed monetary policy decision, followed by the BoJ. The USD/JPY is trading at 139.55, printing modest gains of 0.21% after hitting a daily low of 139.06.
- US equities portray an upbeat market sentiment, despite rising US bond yields. The 10-year benchmark note rate sits at 3.778%, up three and a half basis points, a tailwind for the USD/JPY. The greenback is recovering lost ground, climbing 0.16%, per the US Dollar Index, at 103.722, shy of reclaiming the 104.000 figure.
- The USD/JPY pair stabilized around 139.55, up for the day and bullish in the daily chart. The price stabilizes above 20 and 50 SMA, suggests bullish strength in short term. Meanwhile, 20 SMA continued accelerating north and developing above longer ones, indicating bulls not exhausted. On upside, overcome 141.00 may encourage bulls to challenge 142.30, break above that level will open the gate to 144.00.
- Technical indicators suggest the bullish strength. RSI stabilizes around 58, while the Momentum indicator stabilizes above the midline, suggests upward potentials. On downside, the immediate support is 138.40, break below this level will open the gate to 137.30 area.
DJI
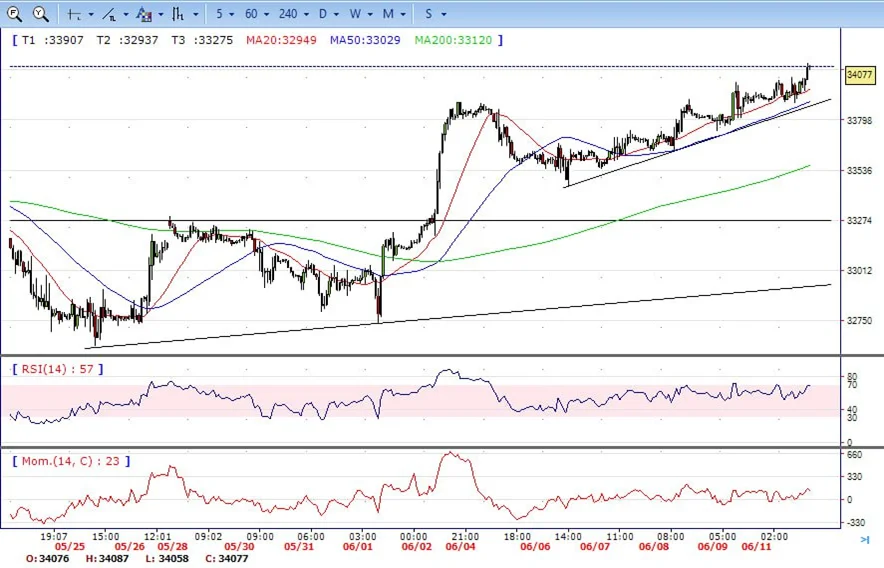
- DJI continued the advance on Monday, traded from intraday low 33890 level to high 34095 and ended the day around 34080, above 20 SMA, suggests bullish strength. Meanwhile, 20 SMA continued accelerating north and developing above 50 and 200 SMA, suggests bulls not exhausted yet. On upside, overcome 34100 may encourage bulls to challenge 34360, break above that level will open the gate to 34550.
- Technical indicators suggest the bullish movement. RSI stabilizes around 69, while the Momentum indicator stabilizes above the midline, suggests upward potentials. On downside, the immediately support is 33890, break below this level will open the gate for more decline to 33640 area.
BRENT
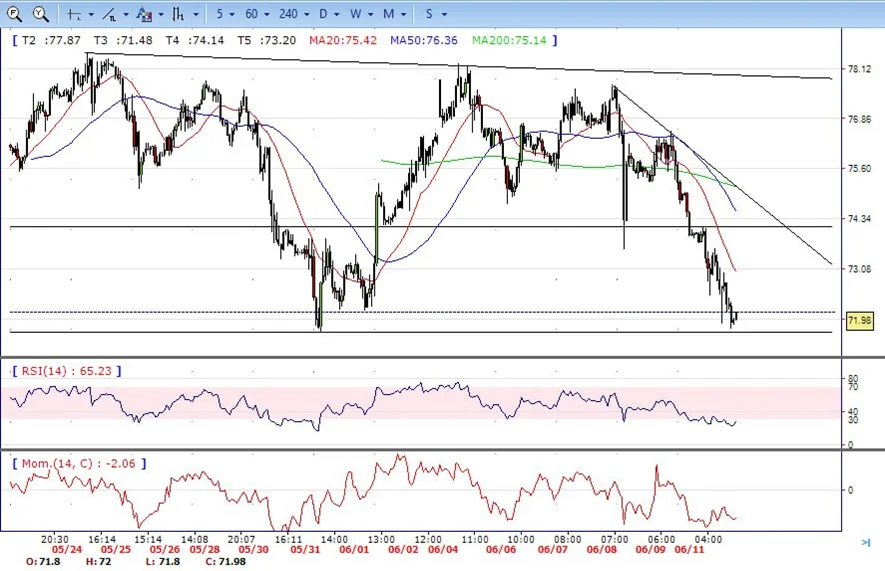
- Brent under the strong sell pressure on Monday, traded from intraday high 75.00 level to low 71.58, it hold near the bottom and ended the day around 72.00, down for the day and indicates bearish sign in the hourly chart. Meanwhile, the 20 SMA started turning south and heading towards longer ones, indicates bears not exhausted yet. On upside, overcome 73.00 may encourage bulls to challenge 74.00, break above that level will open the gate to 75.50.
- Technical indicators also suggest bearish movement, hovering below the midline. RSI stabilizes at 27, while the Momentum indicator stabilizes below the midline, suggests downward potentials. On downside, the immediately support is 71.50, break below this level will open the gate for more decline to 70.00 area.
Contact Us
Please, fill the form to get an assistance.


