14/06/2023 Daily Reports
- The Euro finds demand on Tuesday as investors adjust their positions while preparing for the highly-anticipated central bank policy announcements. The EUR/USD pair gathered bullish momentum and climbed above 1.0800 for the first time in three weeks.
- The Euro’s performance is likely to be impacted by President Lagarde’s June interest rate decision announcement in the second half of the week. Meanwhile, the Euro continues to outperform the US Dollar as markets fully price in a pause in the Federal Reserve rate hikes in June after the data from the US showed that annual CPI inflation declined to 4% in May from 4.9% in April.
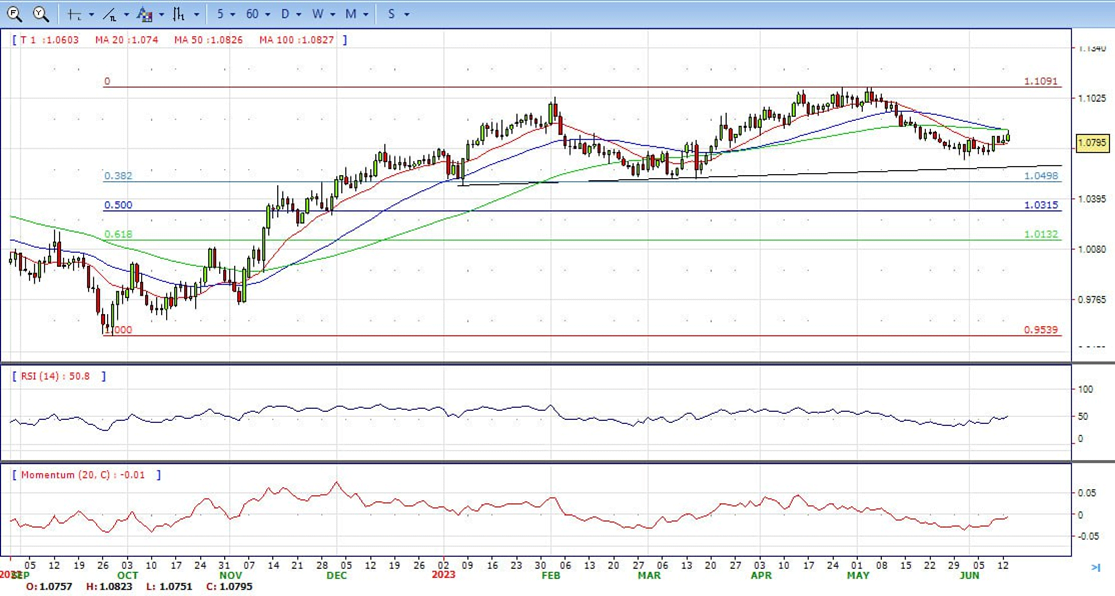
- The EUR/USD pair is trading near the 1.0795, up for the day with neutral to bearish stance in daily chart. The pair stabilized below 50 and 200 SMA, indicates bearish strength. Meanwhile, the 20 SMA started turning flat but continued developing below 50 and 200 SMA, suggests bears not exhausted yet. On upside, the immediate resistance is 1.0830, break above this level will extend the advance to 1.0900.
- Technical readings in the daily chart support the neutral to bearish stance. The RSI indicator stabilizes around 50. The Momentum indicator holds below the midline, indicating bearish potentials. On downside, the immediate support is 1.0730 and below this level will open the gate to 1.0630.
- GBP/USD bulls are in the market with the price rallying on Tuesday from a low of 1.2495 to a high of 1.2624. Traders are getting behind the central bank divergence theme which has helped the pound reach to the strongest since May 10th as recent US inflation rate data reinforced the view that the Federal Reserve is about to change course.
- Besides the sentiment turning at the Fed, the recent UK labour market report has sown the seeds for a hawkish Bank of England for longer. The unemployment rate fell to 3.8% for the period of February to April, while both employment levels and wage growth experienced significant increases. This follows Monday’s hawkish rhetoric from BoE’s policymaker Catherine Mann who emphasized a need to take measures to curb inflation.
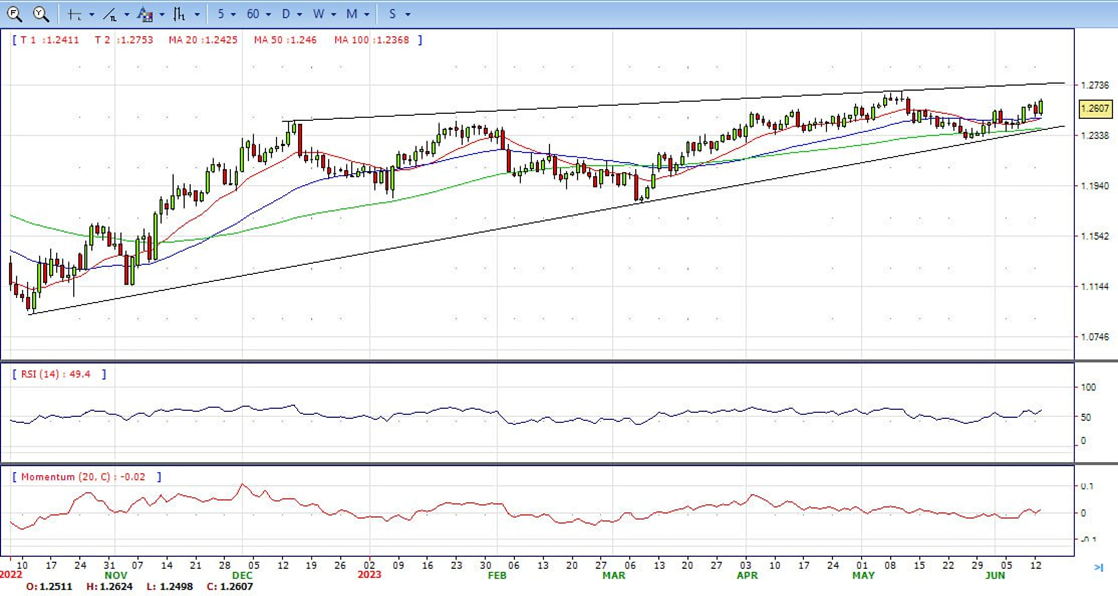
- The GBP/USD offers bullish stance in daily chart. Cable stabilizes above 20 and 50 SMA, indicating bullish strength in short term. Meanwhile, the 20 and 50 SMA started turning flat but continued developing above longer ones, suggests bulls not exhausted yet. On upside, the immediate resistance is 1.2680 with a break above it exposing to 1.2840.
- Technical readings in the daily chart support the bullish stances. RSI indicator stabilizes around 60, while the Momentum indicator stabilizes above the midline, suggesting upward potentials. On downside, the immediate support is 1.2480, unable to defend this level will resume the decline to 1.2370.


- Gold Price bounced sharply from $1,950 to the $1,970 area following the release of US inflation data. It is trading near daily highs, supported by a broad-based decline in the US dollar. However, it trimmed all the gains after then and now is trading at 1944, near daily low 1940 for the day.
- The US Consumer Price Index rose 0.1% in May, which was below the expected increase of 0.2%, and the annual rate fell from 4.9% to 4.0%, reaching the lowest level since March 2021. The Core CPI advanced 0.4%, in line with expectations, and the annual rate fell from 5.5% in April to 5.3% in May. These numbers have cemented expectations of a pause on Wednesday from the Federal Reserve. More inflation data is due tomorrow with the Producer Price Index. After the CPI numbers, US yields dropped sharply and the US dollar tumbled. The 10-year yield fell from 3.74% to 3.69%, and the DXY hit three-week lows near 103.00.
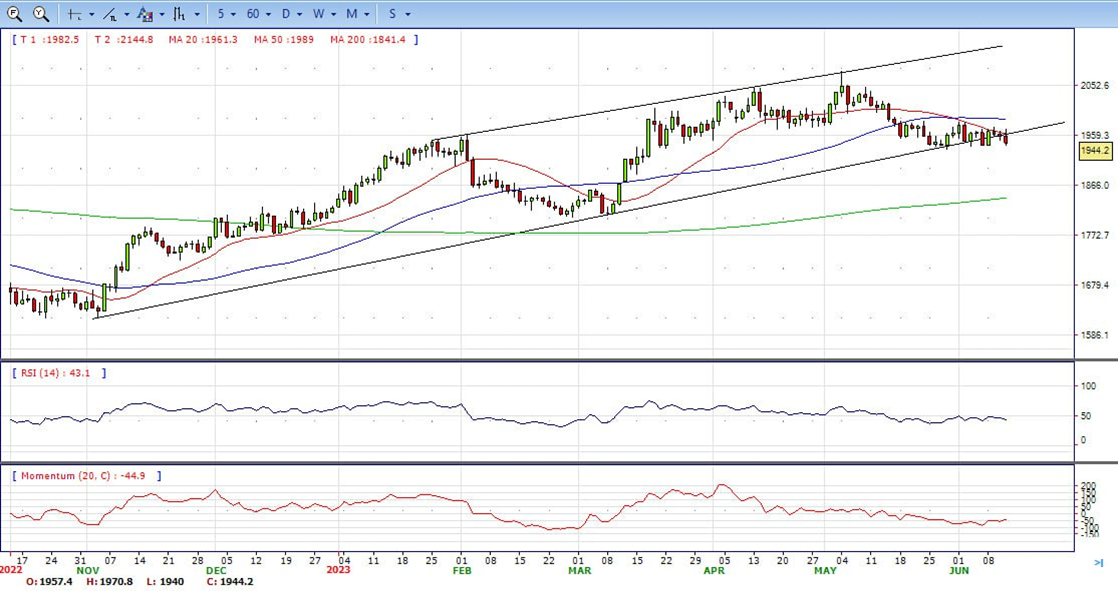
- Gold price stabilized around 1944, down for the day and bearish in the daily chart. The gold price stabilizes below 20 SMA, suggesting bearish strength in short term. Meanwhile, the 20 SMA continued accelerating south and developing below 50 SMA, indicates bears not exhausted yet. On upside, the immediate resistance is 1985, break above this level will open the gate for more advance to 2000 area.
- From a technical perspective, the RSI indicator holds below the mid-line and stabilizes around 44, on a bearish strength. The Momentum indicator hold in negative territory, suggests downward potentials. On downside, the immediate support is 1931, below this area may resume the decline to 1900.


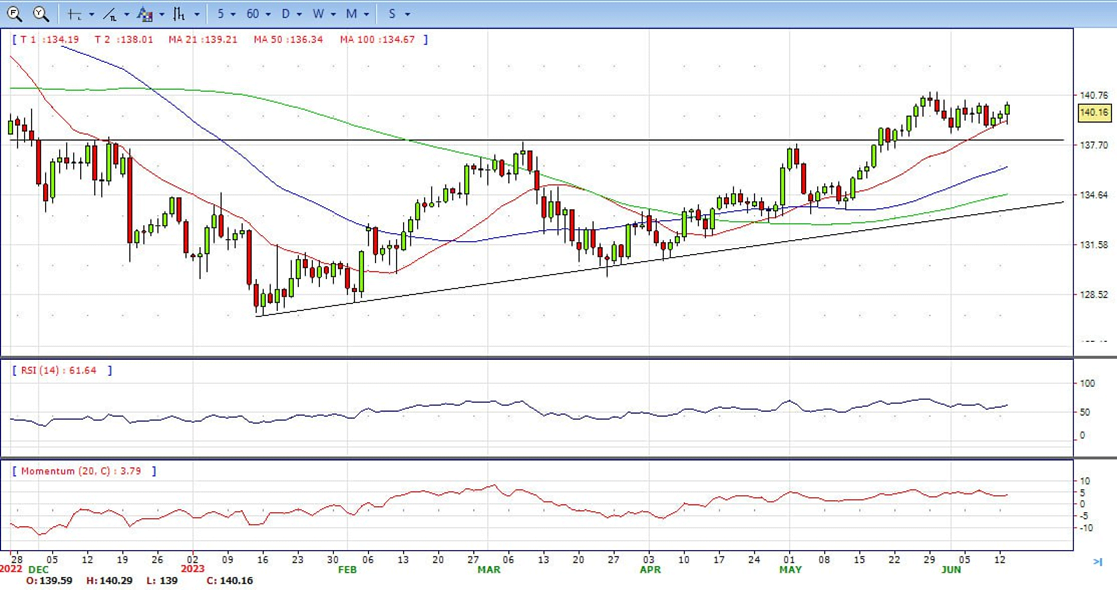
- USD/JPY rose after the release of the US inflation report in the US and cemented the case for a Fed pause on its tightening cycle after increasing rates by 500 basis points since March 2022. At the time of writing, USD/JPY trades at 140.16, above the 140.00 mark.
- Inflation in the US flashed signs of cooling down in the headline figure, but the core remains stickier. The US Department of Labor revealed the CPI in May rose by 4% YoY, beneath estimates and less than April’s 4.9%. CPI has printed a lower reading than the previous month for twelve straight months, strengthening the case for a Fed pause. Nevertheless, core CPI, which excludes volatile items like food and energy, increased to 5.3% YoY, aligned with estimates, but 0.2% below the prior’s month data. Money market futures speculate that Jerome Powell and Co. would increase rates at the July meeting by 25 bps to 5.25%-5.50%, as shown by the CME FedWatch Tool, with chances at 58.2%, higher than a week ago.
- The USD/JPY pair stabilized around 140.16, up for the day and bullish in the daily chart. The price stabilizes above 20 and 50 SMA, suggests bullish strength in short term. Meanwhile, 20 SMA continued accelerating north and developing above longer ones, indicating bulls not exhausted. On upside, overcome 141.00 may encourage bulls to challenge 142.30, break above that level will open the gate to 144.00.
- Technical indicators suggest the bullish strength. RSI stabilizes around 61, while the Momentum indicator stabilizes above the midline, suggests upward potentials. On downside, the immediate support is 138.40, break below this level will open the gate to 137.30 area.
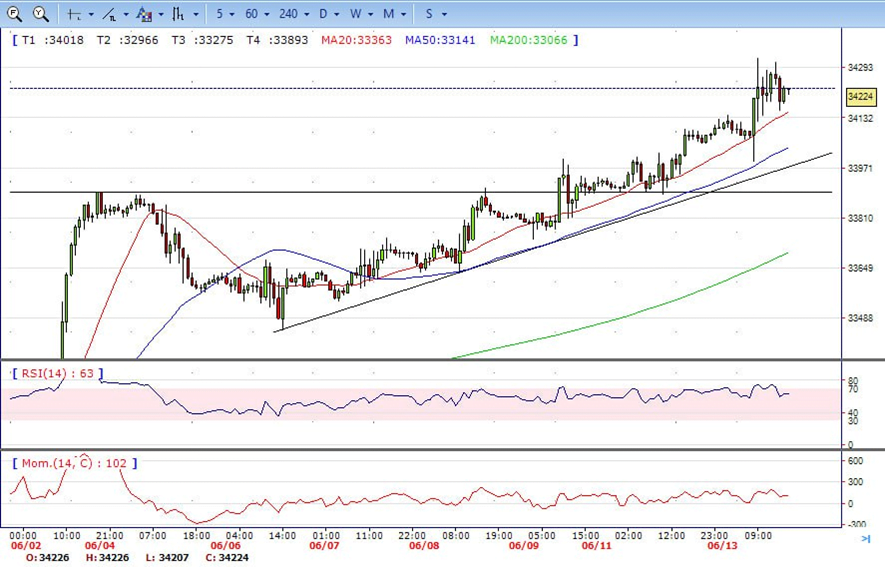
- DJI continued the advance on Tuesday, traded from intraday low 33990 level to high 34325 and ended the day around 34220, above 20 SMA, suggests bullish strength. Meanwhile, 20 SMA continued accelerating north and developing above 50 and 200 SMA, suggests bulls not exhausted yet. On upside, overcome 34360 may encourage bulls to challenge 34550, break above that level will open the gate to 34720.
- Technical indicators suggest the bullish movement. RSI stabilizes around 62, while the Momentum indicator stabilizes above the midline, suggests upward potentials. On downside, the immediately support is 33890, break below this level will open the gate for more decline to 33640 area.
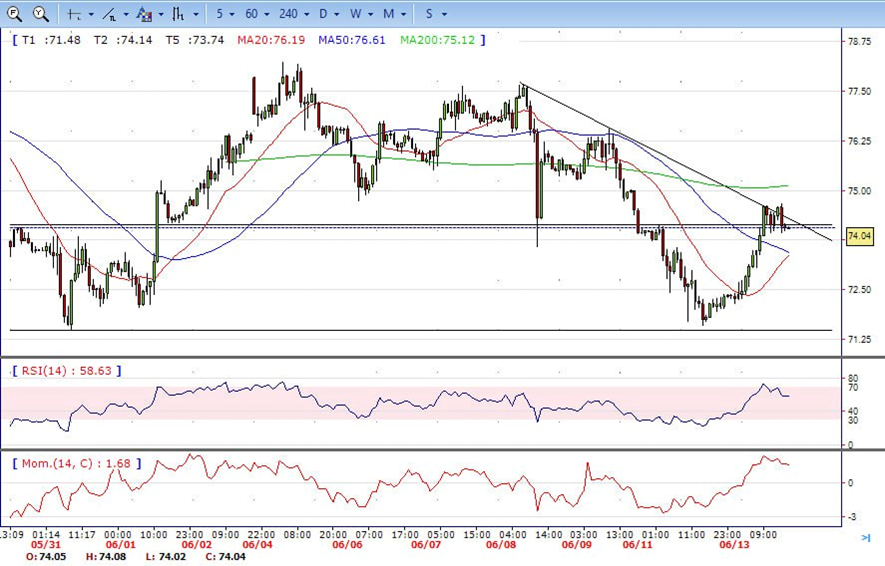
- Brent made a strong rally on Tuesday, traded from intraday low 72.20 level to low 74.70, it hold near the top and ended the day around 74.05, up for the day and indicates bullish sign in the hourly chart. Meanwhile, the 20 SMA started turning north and heading towards longer ones, indicates bulls not exhausted yet. On upside, overcome 74.70 may encourage bulls to challenge 76.50, break above that level will open the gate to 77.60.
- Technical indicators also suggest bullish movement, hovering above the midline. RSI stabilizes at 58, while the Momentum indicator stabilizes above the midline, suggests upward potentials. On downside, the immediately support is 73.50, break below this level will open the gate for more decline to 71.50 area.