EUR/USD
- The EUR/USD is up on Monday, moving toward last week’s high and with 1.0700 again on the radar. A stronger Euro across the board has been supportive of the pair, while at the same time, the US Dollar weakened. EUR/USD firm above 1.0650, approaches last week highs
- The Euro is outperforming on Monday among the G10 space despite lower-than-expected economic data. The Eurozone Sentiment Investor Confidence index dropped in March to -11.1, against expectations of a slide to -8.6. Eurozone Retail Sales rose 0.3% in February, below the 1% increase expected of market consensus; on the positive, January’s -2.7% was revised to -1.6%.
- In the US, Factory Orders in January fell by 1.6%, less than the decline expected of 1.8%. The Greenback rose marginally immediately after the report and then retreated. Equity prices are up on Wall Street, with the Dow Jones gaining 0.42% and the Nasdaq 0.98%. At the same time, US yields are flat for the day. The improvement in market sentiment weighs on the US Dollar.
- The EUR/USD pair is trading near the 1.0675, up for the day with neutral stance in daily chart. The pair still stabilized between 20 and 50 SMA, indicates neutral strength. Meanwhile, the 20 SMA started turning flat but continued developing below 50 SMA, suggests bears not exhausted yet. On upside, the immediate resistance is 1.0700, break above this level will extend the advance to 1.0800.
- Technical readings in the daily chart support the neutral to bearish stance. The RSI indicator stabilizes around 49. The Momentum indicator holds just below the midline, indicating modest downward potentials. On downside, the immediate support is 1.0530 and below this level will open the gate to 1.0470.

Open A Demo
CDO has wide range of tools, professional and friendly support for clients to achieve their financial markets trading goals. Open a live account now to enjoy this experience with virtual deposit.
GBP/USD
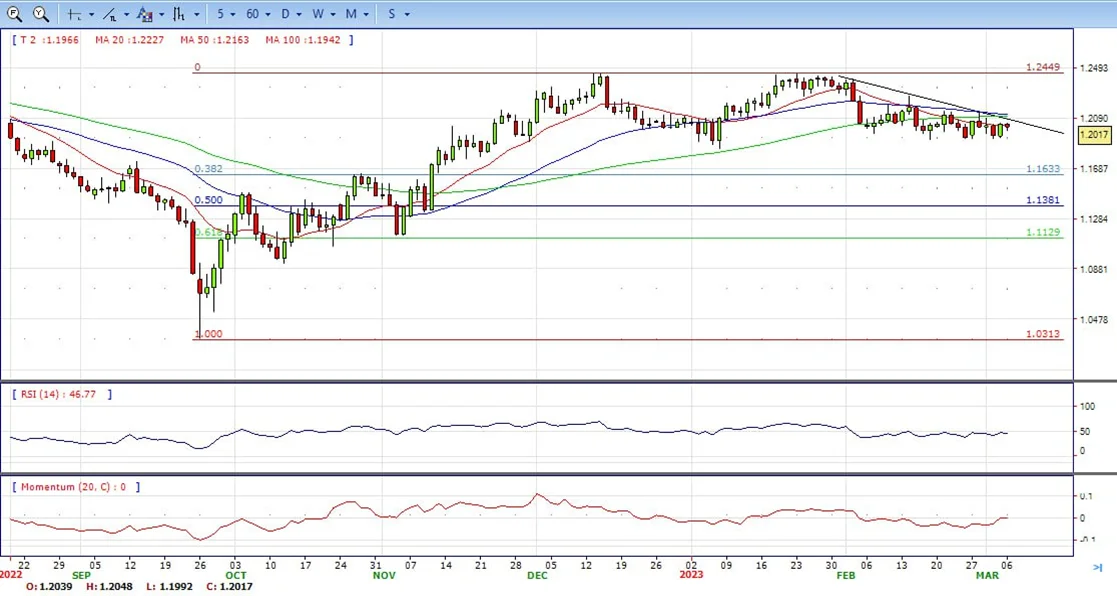
- GBP/USD trims some of last Friday’s gains despite an upbeat sentiment led by Wall Street, opening in the green. A light calendar in the UK would keep traders focused on the busiest docket in the US. At the time of writing, the GBP/USD is trading at 1.2019.
- As abovementioned, risk sentiment is a mixed bag. The UK economic calendar will reveal the GDP on Friday, ahead of the BoE March 23 meeting. The US economic docket will feature Factory Orders for January, foreseen to fall to -1.8%, below the prior’s month reading of 1.8%.
- The greenback is printing losses, capping the GBP/USD’s fall below the 1.2000 figure. The US Dollar Index, a gauge of the buck’s value vs. a basket of six currencies, extended its losses, by 0.14%, at 104.380. Meanwhile, US Treasury bond yields, which underpinned the USD last week’s price action, are down, with the 10-year benchmark note rate below 4%, at 3.950%.
- The GBP/USD offers bearish stance in daily chart. Cable still stabilizes below 20 and 50 SMA, indicating bearish strength in short term. Meanwhile, the 20 SMA continued accelerating south and heading towards longer ones, suggests bears not exhausted yet. On upside, The immediate resistance is 1.2150 with a break above it exposing to 1.2270.
- Technical readings in the daily chart support the bearish stances. RSI indicator stabilizes around 46, while the Momentum indicator stabilizes below the midline, suggesting downward potentials. On downside, the immediate support is 1.1910, unable to defend this level will resume the decline to 1.1840.

CDO TRADER
CDO TRADER, our cutting-edge trading platform, follows the technology from the forefront with new features added continuously. Moreover, CDO TRADER is now available for Android and iOS! So it allows you to trade on the go!
XAU/USD
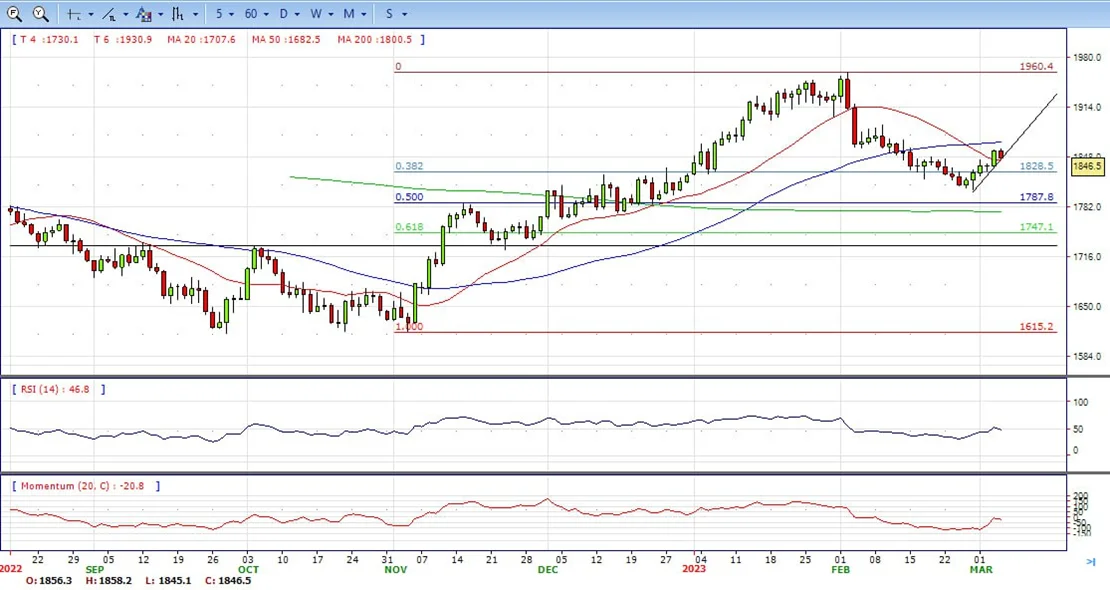
- Gold price slides 0.26% or $3.00 a troy ounce in the North American session as UST bond yields recover some ground turning positive a headwind for the non-yielding metal. The US economic calendar ahead of next week’s Tuesday inflation figures would be busy, led by Fed speakers and employment data. At the time of typing, the XAU/USD exchanges hands at $1846.5 after hitting a daily high of $1858.30.
- US equities reflect a risk-on impulse in the financial markets. A tranche of data from the US, namely Factory Orders for January, dropped less than the -1.8% MoM estimated, at a -1.6% fall. The report from the US Commerce Department showed improved shipments and manufactured goods, snapping two straight months of declines.
- In the meantime, the US Dollar failed to gain traction following the report, as shown by the US Dollar Index falling 0.28%, at 104.232. Contrarily, US Treasury bond yields, mainly the 10-year, is up one bps at 3.967%, a headwind for Gold prices.
- Gold price stabilized around 1846, down for the day and neutral in the daily chart. The gold price stabilized between 20 and 50 SMA, suggesting neutral strength in short term. Meanwhile, the 20 SMA continued accelerating south and heading towards 200 SMA, indicating bears not exhausted yet. On upside, the immediate resistance is 1870, break above this level will open the gate for more advance to 1891 area.
- From a technical perspective, the RSI indicator holds near the mid-line and stabilizes around 49, on a neutral strength. The Momentum indicator hold just below the midline, suggests directionless potentials. On downside, the immediate support is 1830, below this area may resume the decline to 1805.
MetaTrader 4
MT4 has user friendly interface that is providing simplicity and efficiency. The traders can perform trading strategies for different products like Forex and CFD. MetaTrader 4 has over 50 built-in indicators, also it’s the tool that predicts trends and defines the appropriate entry and exit points.

USD/JPY
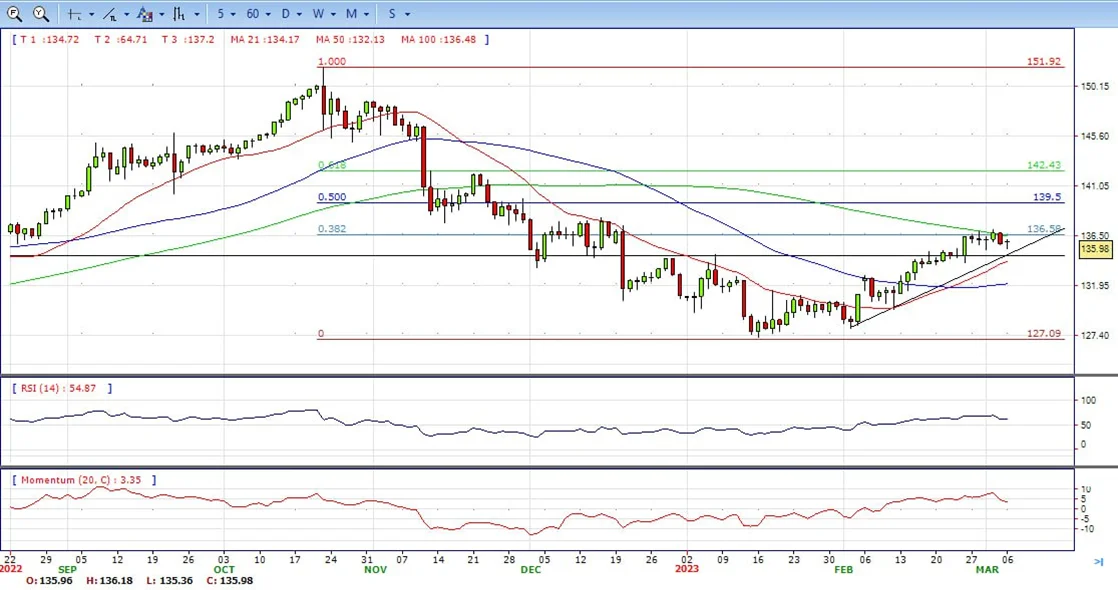
- The USD/JPY pair remains under some selling pressure for the second successive day on Monday and moves further away from the YTD peak, around the 137.10 region touched last week. The pair, however, recovers from the daily low and trades just below the 136.00 during the early US session.
- The US Dollar kicks off the new week on a subdued note amid a modest downtick in the US Treasury bond yields and turns out to be a key factor weighing on the USD/JPY pair lower. Apart from this, looming recession risks seem to benefit the safe-haven JPY and contribute to the offered tone surrounding the major. Worries about a deeper global economic downturn resurfaced after China set a lower-than-expected target for economic growth and forecast that the economy would expand by 5% in 2023.
- The downside for the USD/JPY pair, meanwhile, seems cushioned amid the divergent Bank of Japan-Federal Reserve monetary policy outlook. In fact, the incoming BoJ Governor Kazuo Ueda stressed the need to maintain the ultra-loose policy to support the fragile economy and said last week that the central bank isn’t seeking a quick move away from a decade of massive easing. In contrast, the US central bank is universally expected to stick to its hawkish stance and keep rates higher for longer to tame high inflation.
- The USD/JPY pair stabilized around 135.98, unchanged for the day and bullish in the daily chart. The price stabilizes above 20 and 50 SMA, suggests bullish strength in short term. Meanwhile, 20 SMA continued accelerating north and heading towards longer ones, indicating bulls not exhausted. On upside, overcome 137.10 may encourage bulls to challenge 138.20, break above that level will open the gate to 139.60.
- Technical indicators suggest the bullish strength. RSI stabilizes around 62, while the Momentum indicator stabilizes in the positive territory, suggests upward potentials. On downside, the immediate support is 135.20, break below this level will open the gate to 134.00 area.
DJI
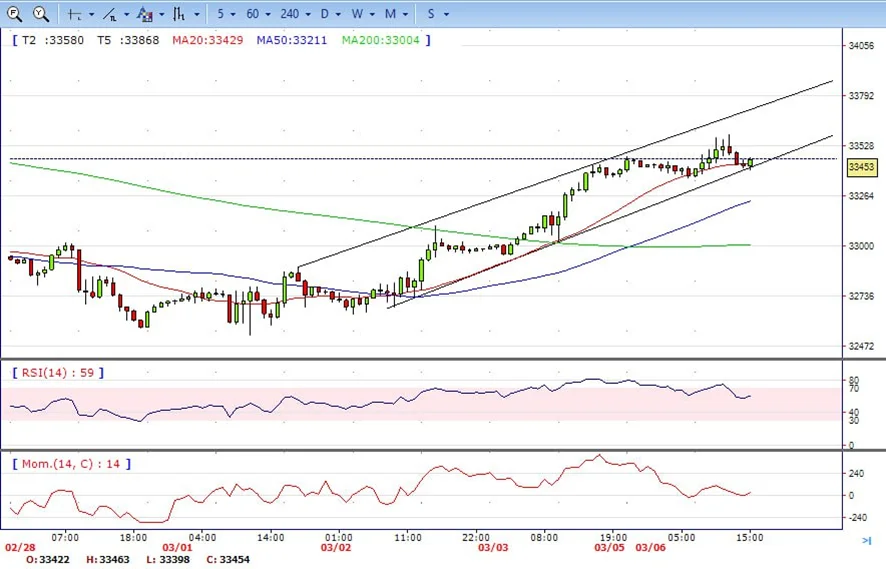
- DJI continued the advance on Monday, rallied from intraday low 33360 area to high above 33590 area. It trimmed some gains and ended the day around 33440, up for the day and indicates bullish sign in the hourly chart. Right now market is standing above 20 and 50 SMA, suggests bullish strength. Meanwhile, 20 and 50 SMA continued accelerating north and developing far above 200 SMA, suggests bulls not exhausted yet. On upside, overcome 33590 may encourage bulls to challenge 33860, break above that level will open the gate to 34220.
- Technical indicators suggest the bullish movement. RSI stabilizes around 60, while the Momentum indicator stabilizes in positive territory, suggests bullish potentials. On downside, the immediately support is 33350, break below this level will open the gate for more decline to 33000 area.
BRENT
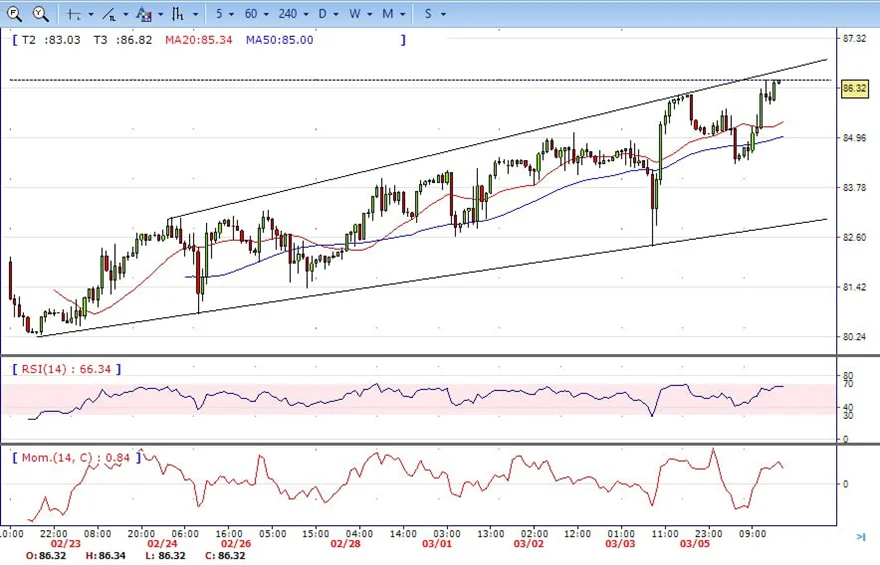
- Brent tumbled to low 84.35 in EU session on Monday, but reversed the direction and climbed to high 86.33 area on US session. It hold near the top to ended the day. The price currently stabilizes above 20 and 50 SMA, suggests bullish strength in the hourly chart. Meanwhile, the 20 SMA continued accelerating north and developing above longer ones, indicates bulls not exhausted yet. On upside, overcome 87.00 may encourage bulls to challenge 89.00, break above that level will open the gate to 91.50.
- Technical indicators also suggest bullish movement, hovering above the midline. RSI climbs to 66, while the Momentum indicator stabilizes in positive territory, suggests upward potentials. On downside, the immediately support is 84.30, break below this level will open the gate for more decline to 82.40 area.
Contact Us
Please, fill the form to get an assistance.


