07/02/2023 Daily Reports
- The EUR/USD extended its fall to new four-week lows at around 1.0720s due to broad US Dollar strength after last Friday’s data reaffirmed the need for higher interest rates in the United States. Hence, money market futures began to price in higher interest rates, underpinning the US Treasury bond yields and the buck. At the time of typing, the EUR/USD exchanges hands at 1.0730.
- The EUR/USD lost traction on Friday, as the US Department of Labor revealed that 517K jobs were added to the economy, crushing the 200K expectations and sending the Unemployment Rate dipping towards 3.4% from 3.5%. That triggered a sell-off of currencies, particularly the Euro. Even though the ECB raised rates by 50 bps, President Lagarde’s press conference was perceived as dovish, albeit the chorus of hawks expecting further aggression by the central bank.
- Earlier in the European session, Germany revealed that factory orders improved from December’s 4.4% MoM plunge to 3.2% expansion, smashing estimates of 2%, but annually paced, barely improved to -10.1% vs. -10.2% estimated. In other data, Industrial Production in Germany and Spain will be featured on Tuesday, while Italy will do it on Friday.
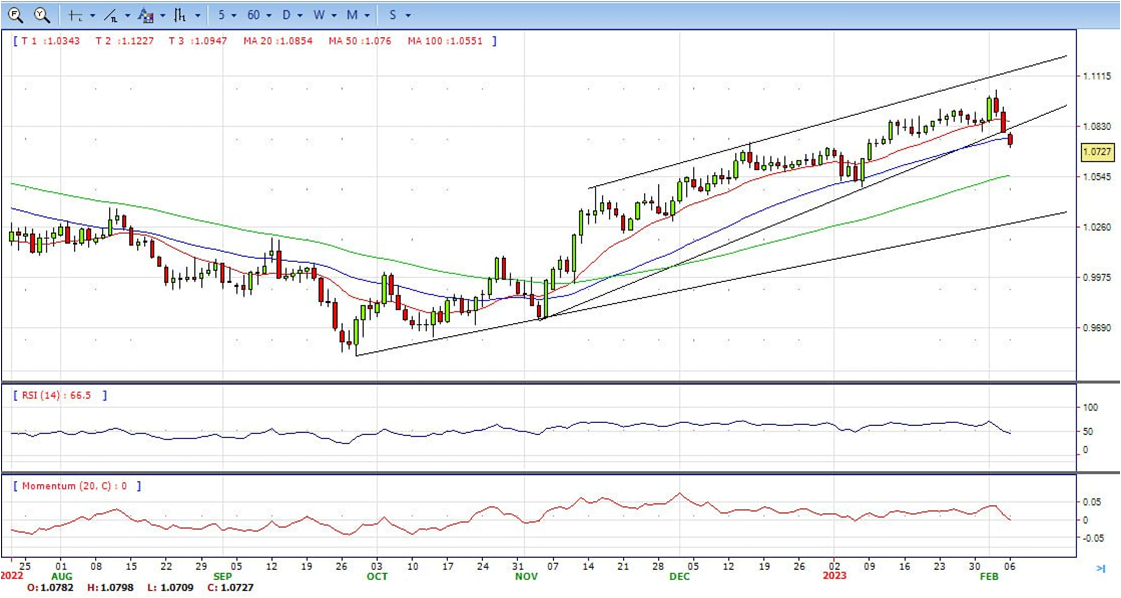
- The EUR/USD pair is trading near the 1.0730, down for the day with bearish stance in daily chart. The pair stabilized below 20 and 50 SMA, indicates bearish strength. Meanwhile, the 20 SMA started turning south and heading towards longer ones, suggests bears not exhausted yet. On upside, the immediate resistance is 1.0800, break above this level will extend the advance to 1.0930.
- Technical readings in the daily chart support the bearish stance. The RSI indicator stabilizes around 46. The Momentum indicator holds near the midline, indicating neutral potentials. On downside, the immediate support is 1.0700 and below this level will open the gate to 1.0580.
- The British pound manages to somewhat shrug off the current dollar strength and motivates GBP/USD to rebound from earlier lows near 1.2000 on Monday.
- The USD Index, which tracks the Greenback against a basket of currencies, is seen building on Friday’s solid bounce from a nine-month low and drawing support from a combination of factors. The upbeat US NPF forced investors to scale back their expectations for an imminent pause in the Fed’s policy-tightening cycle. This, in turn, pushes the US Treasury bond yields higher and continues to boost the Greenback. Adding to this, the prevalent risk-off mood further seems to underpin the safe-haven buck and contributes to capping the upside for the GBP/USD pair.
- Expectations that the US central bank will stick to its hawkish stance for longer fuel concerns about economic headwinds stemming from the continuous rise in borrowing costs. Adding to this, fears of worsening US-China relations take its toll on the global risk sentiment, which is evident from a generally weaker tone around the equity markets.
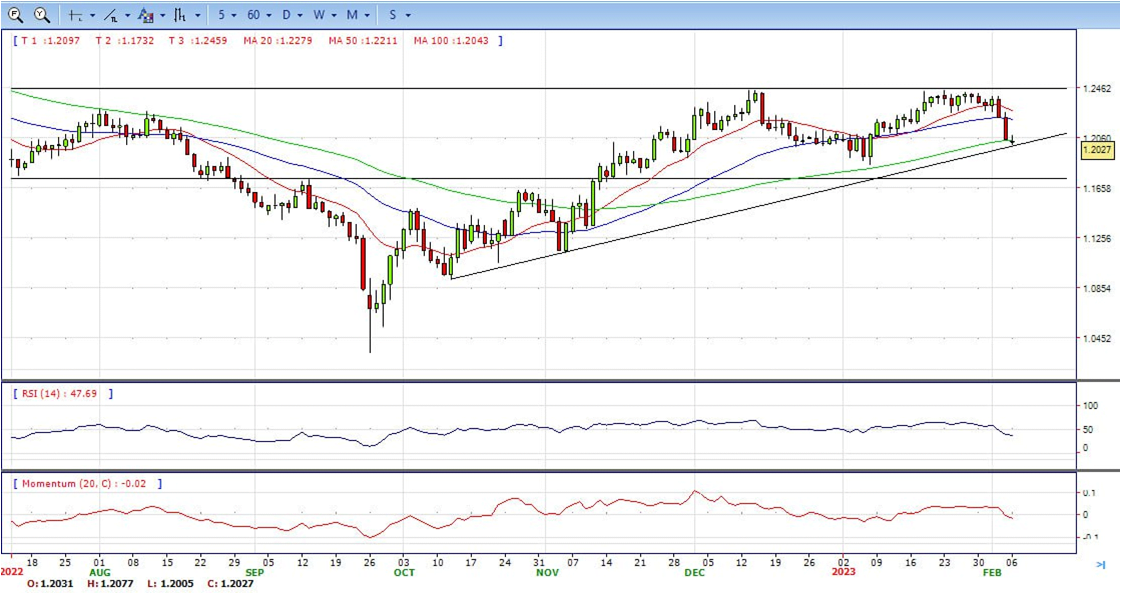
- The GBP/USD offers bearish stance in daily chart. Cable stabilizes below 20 and 50 SMA, indicating bearish strength in short term. Meanwhile, the 20 SMA started turning south and heading towards longer ones, suggests bears not exhausted yet. On upside, The immediate resistance is 1.2150 with a break above it exposing to 1.2260.
- Technical readings in the daily chart support the bearish stances. RSI indicator stabilizes around 37, while the Momentum indicator stabilizes below the midline, suggesting downward potentials. On downside, the immediate support is 1.2000, unable to defend this level will resume the decline to 1.1840.


- Gold price fall is being stopped as bulls entered the market at last Friday’s low of around $1860 and reclaimed $1870. A staggering US Nonfarm Payrolls report and markets repricing further interest rate hikes augmented demand for the greenback, a headwind for the non-yielding metal. At the time of writing, the XAU/USD exchanges hands at $1868, up by half of a one percentage point.
- Wall Street continued to stumble after the US Department of Labor revealed that US economy added more than 500K jobs to the economy, while the unemployment rate dropped to a 53 and a half year low level of 3.4%. That reignited the spark that the US Fed might need to raise rates, above the market’s expectations, with traders foreseeing a rate cut in the second half of 2023.
- In the meantime, the US Dollar Index, a gauge of the buck’s value vs. its peers, advances 0.50%, up at 103.519, putting a lid on Gold’s recovery, alongside the US 10-year Treasury bond yield, up nine basis points at 3.616%.
- Gold price stabilized around 1868, unchanged for the day and neutral to bearish in the daily chart. The gold price stabilized between 20 and 50 SMA, suggesting neutral to bearish strength in short term. However, the 20 and 50 SMA continued accelerating north and developing above 200 SMA, indicating bulls not exhausted yet. On upside, the immediate resistance is 1896, break above this level will open the gate for more advance to 1920 area.
- From a technical perspective, the RSI indicator holds below the mid-line and stabilizes around 45, on a bearish strength. The Momentum indicator to the midline, suggests directionless potentials. On downside, the immediate support is 1860, below this area may resume the decline to 1830.


- The USD/JPY gapped toward new 5-week highs 132.90 and remained nearby, about to challenge the 133.00 psychological price level. The last US jobs report crushed estimates, bolstering the US Dollar on speculations for further Fed aggression. Therefore, the USD/JPY rallied 3.45% since Friday and exchanged hands at 132.60.
- The prevalent risk-off environment – as depicted by a generally weaker tone around the equity markets – underpins the safe-haven Japanese Yen (JPY) and acts as a headwind for the USD/JPY pair. That said, reports that BoJ Deputy Governor Masayoshi Amamiya – an advocate of ultra-loose policy – will take over as the governor might keep a lid on any further gains for the JPY.
- Apart from this, strong follow-through US Dollar buying supports prospects for a further near-term appreciating move for the pair and an extension of last week’s bounce from the 128.00 mark. Meanwhile, the broader risk sentiment will drive demand for the safe-haven JPY and contribute to producing short-term opportunities around the USD/JPY pair.
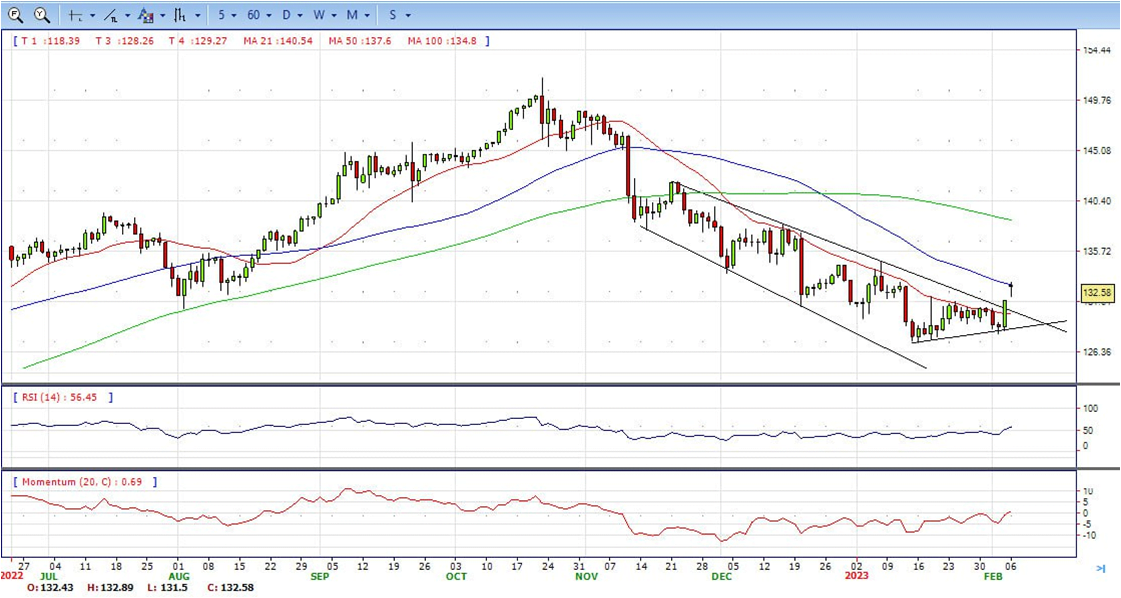
- The USD/JPY pair stabilized around 132.60, up for the day and bullish in the daily chart. The price broke above the downward bearish trend line and develops above 20 SMA, suggests bullish strength in short term. However, 20 SMA continued accelerating south and developing far below longer ones, indicating bears not exhausted. On upside, overcome 133.00 may encourage bulls to challenge 134.70, break above that level will open the gate to 137.40.
- Technical indicators still suggest the bullish strength. RSI climbs to around 57, while the Momentum indicator stabilizes just above the midline, suggests upward potentials. On downside, the immediate support is 131.50, break below this level will open the gate to 130.50 area.
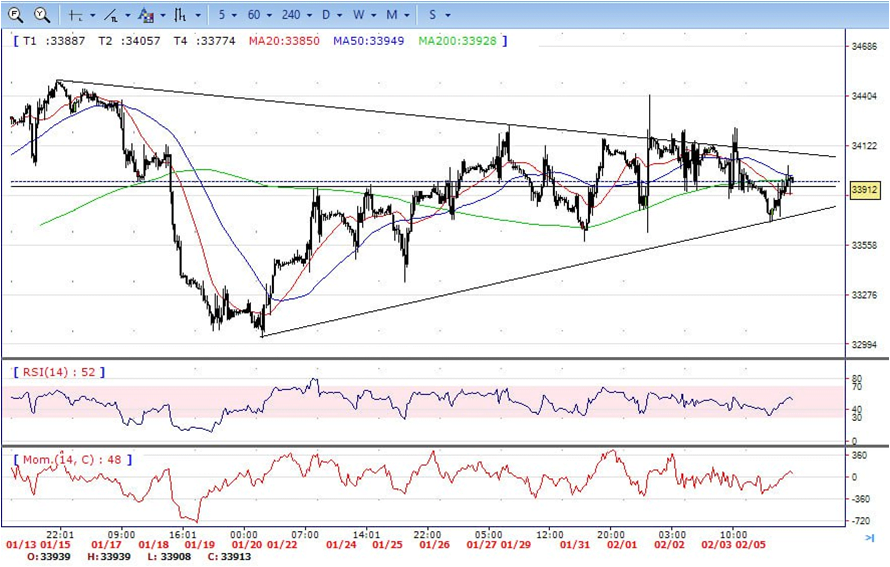
- DJI still in the familiar range, tumbled to intraday low 33680 area, but trimmed all the losses after then and back to 33920 to ended Monday, slightly down for the day and indicates bearish sign in the hourly chart. Right now market is standing below 20 and 50 SMAs, suggests bearish strength. Meanwhile, 20 SMA started turning south and heading towards 200 SMA, suggests bears not exhausted yet. On upside, overcome 34230 may encourage bulls to challenge 34400, break above that level will open the gate to 34680.
- Technical indicators suggest the directionless movement, developing below the mid-line. RSI stabilized around 50, while the Momentum indicator hovering near the midline, suggests neutral potentials. On downside, the immediately support is 33600, break below this level will open the gate for more decline to 33350 area.
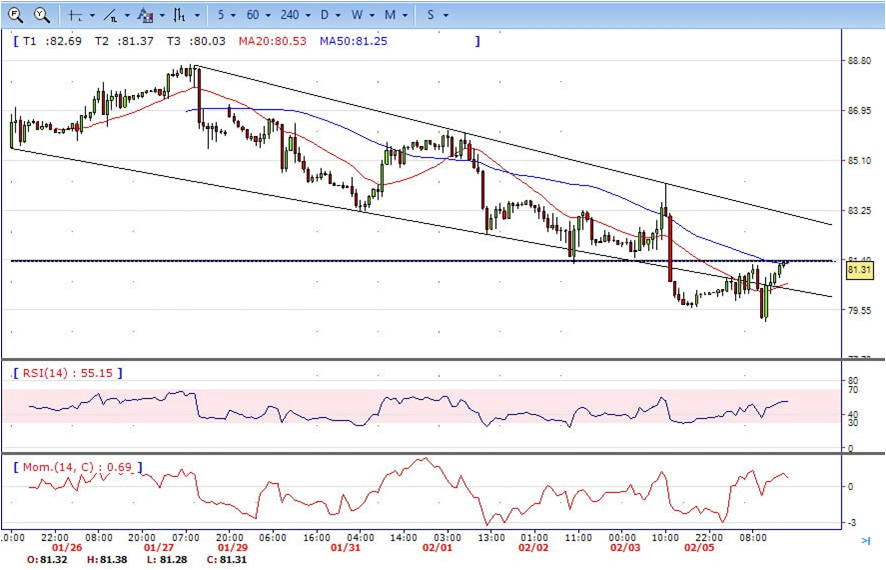
- The Brent recovered some losses on Monday, climbed from intraday low 79.12 area to high 81.30. It hold near the top to ended Monday. The price now stabilizes above 20 and 50 SMA, suggests bullish strength in the hourly chart. Meanwhile, the 20 SMA started turning north and developing towards longer ones, indicates bulls not exhausted yet. On upside, overcome 81.35 may encourage bulls to challenge 83.30, break above that level will open the gate to 84.20.
- Technical indicators also suggest bullish movement, hovering above the midline. RSI climbs to 55, while the Momentum indicator stabilizes in positive territory, suggests upward potentials. On downside, the immediately support is 80.00, break below this level will open the gate for more decline to 79.00 area.