05/05/2023 Daily Reports
- EUR/USD accelerates the corrective decline and probed the boundaries of the key 1.1000 level on Thursday, where solid contention appears to have emerged. So far, the pair probed once again the boundaries of the 1.1100 barrier just to give away all those gains and poke with the 1.1000 neighbourhood, managing to stage a rebound afterwards.
- EUR/USD comes under pressure and faces some increased volatility as President Lagarde’s press conference is under way on Thursday. At her press conference, Lagarde argued that price pressures remain strong, while services prices are pushed up by pent up demand amidst a strong growth in the sector and in contrast with a worsening outlook for manufacturers.
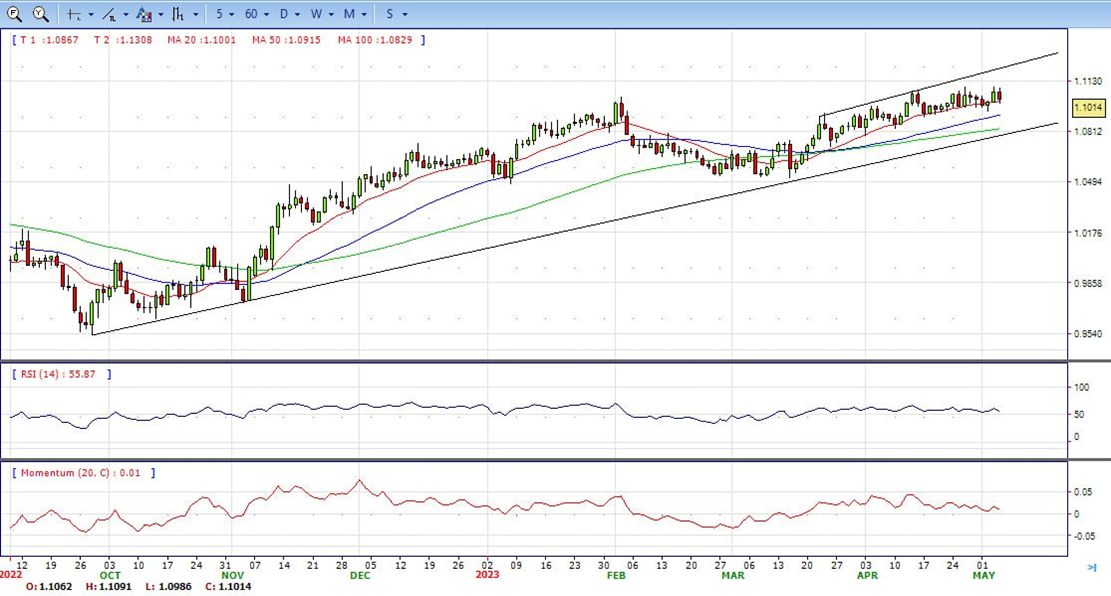
- The EUR/USD pair is trading near the 1.1015, down for the day with bullish stance in daily chart. The pair stabilized above 20 and 50 SMA, indicates bullish strength. Meanwhile, the 20 SMA continued developing above 50 and 200 SMA, suggests bulls not exhausted yet. On upside, the immediate resistance is 1.1100, break above this level will extend the advance to 1.1180.
- Technical readings in the daily chart support the bullish stance. The RSI indicator stabilizes around 56. The Momentum indicator holds above the midline, indicating bullish potentials. On downside, the immediate support is 1.0910 and below this level will open the gate to 1.0830.
- The GBP/USD pair enters a bullish consolidation and oscillates in a narrow trading range just below its highest level since June 2022 touched this Thursday. The pair holds steady just above the 1.2570 through the North American session, awaiting a fresh catalyst before the next leg of a directional move.
- A modest US Dollar recovery from over one-week low acts as a headwind and keeps the GBP/USD pair below the 1.2600 round-figure mark. Signs of stress at another US regional bank, PacWest Bancorp, spark fears of a full-blown banking crisis in the US, which, along with looming recession risks, temper investors’ appetite for riskier assets. This is evident from a generally weaker tone around the equity markets and helps revive demand for the safe-haven Greenback.
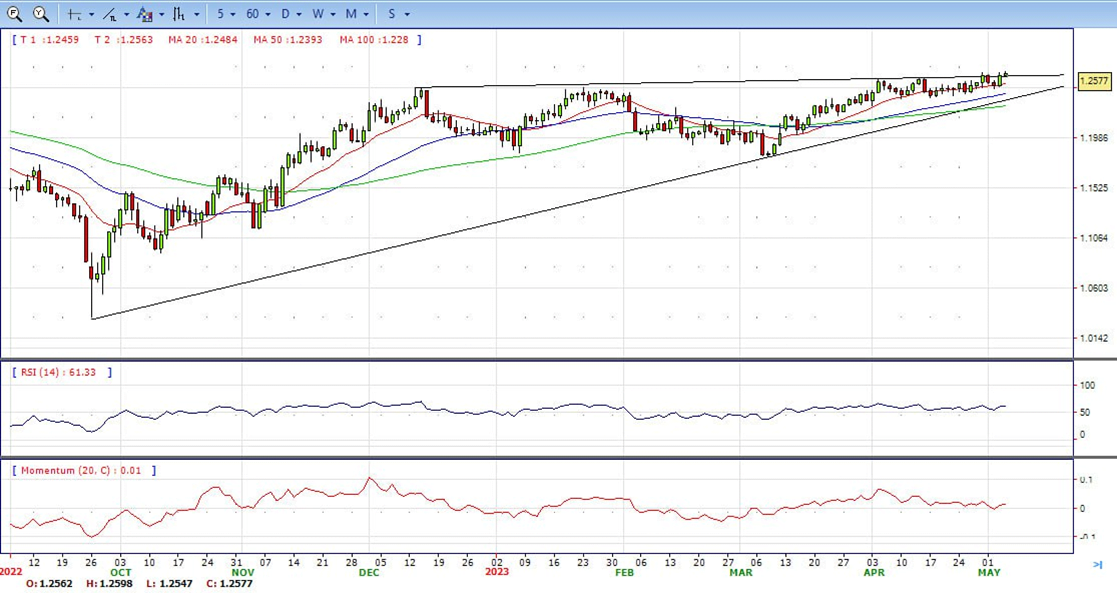
- The GBP/USD offers bullish stance in daily chart. Cable stabilizes above 20 and 50 SMA, indicating bullish strength in short term. Meanwhile, the 20 SMA continued accelerating north and developing far above longer ones, suggests bulls not exhausted yet. On upside, the immediate resistance is 1.2600 with a break above it exposing to 1.2670.
- Technical readings in the daily chart support the bullish stances. RSI indicator stabilizes around 61, while the Momentum indicator stabilizes above the midline, suggesting upward potentials. On downside, the immediate support is 1.2430, unable to defend this level will resume the decline to 1.2350.


- Gold price remains trading in positive territory after hitting a new all-time high at around $2078.5. Some profit-taking, risk aversion, and another central bank increasing rates dragged XAU/USD price towards the $2050 area. At the time of writing, XAU/USD exchanges hands at $2050, holding to gains of 0.40%.
- The financial turmoil around the US banking system continues, as PacWest and Western Alliance Bank are under solid selling pressure, which triggered flows towards safety. Therefore, XAU/USD continues to hold its ground, despite recent US Dollar strength. The economic agenda in the US revealed that unemployment claims for the week ending on April 29 jumped to 242K, exceeding estimates of 240K, a report cheered by US Fed officials. Continuing claims, which include citizens receiving unemployment benefits for a week or more, fell by 38K, to 1.81 million, in the week ending on April 22.
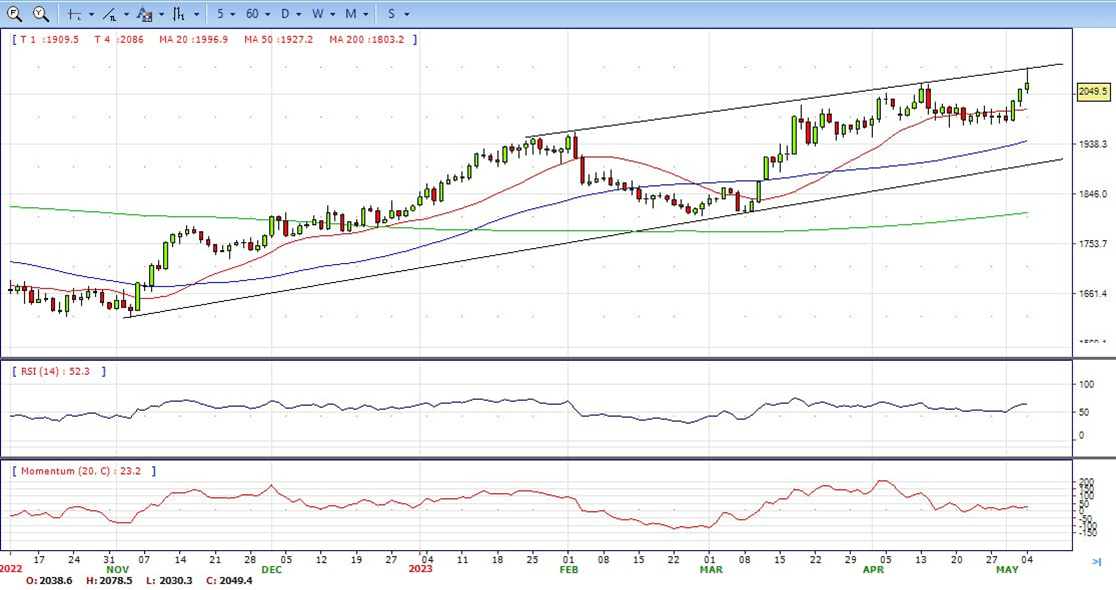
- Gold price stabilized around 2050, up for the day and bullish in the daily chart. The gold price stabilizes above 20 SMA, suggesting bullish strength in short term. Meanwhile, the 20 SMA started turning flat but continued developing far above 50 and 200 SMA, indicates bulls not exhausted yet. On upside, the immediate resistance is 2078, break above this level will open the gate for more advance to 2100 area.
- From a technical perspective, the RSI indicator holds above the mid-line and stabilizes around 65, on a bullish strength. The Momentum indicator hold above the midline, suggests upward potentials. On downside, the immediate support is 2030, below this area may resume the decline to 2007.


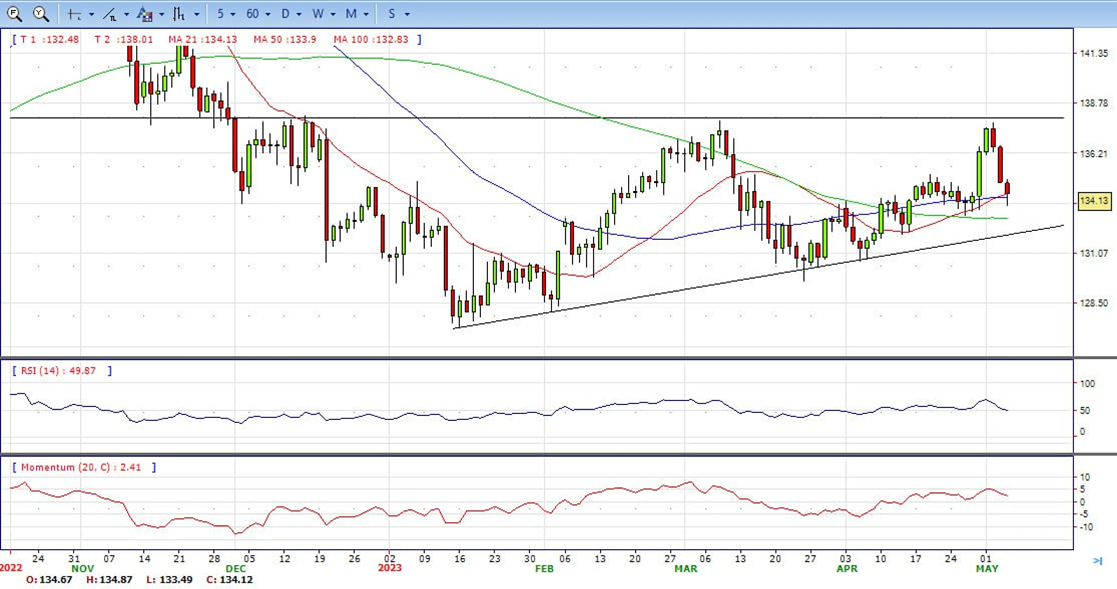
- The USD/JPY has broken lower and tumbled to 133.79, reaching its lowest level in six days. The pair remains under pressure amid risk aversion, with US regional banks taking a hit.
- Although the US Dollar experienced a modest rebound following US Q1 productivity report, it quickly faded after Wall Street’s opening bell. US stocks are falling again, with regional banks tumbling. Wednesday’s Federal Reserve rate hike seems like old news already. The deterioration in market sentiment is driving demand toward Treasury bonds. The US 10-year yield is at 3.33%, while the 2-year is at 3.79%, both at one-month lows. The context of lower US yields and risk aversion is boosting the Japanese yen across the board during the American session, pushing USD/JPY down, extending weekly losses.
- The USD/JPY pair stabilized around 134.15, down for the day and bullish in the daily chart. The price stabilizes above 20 and 50 SMA, suggests bullish strength in short term. Meanwhile, 20 SMA started turning flat but continued developing above longer ones, indicating bulls not exhausted. On upside, overcome 134.90 may encourage bulls to challenge 135.70, break above that level will open the gate to 136.70.
- Technical indicators suggest the neutral to bullish strength. RSI stabilizes around 50, while the Momentum indicator stabilizes above the midline, suggests upward potentials. On downside, the immediate support is 133.00, break below this level will open the gate to 132.00 area.
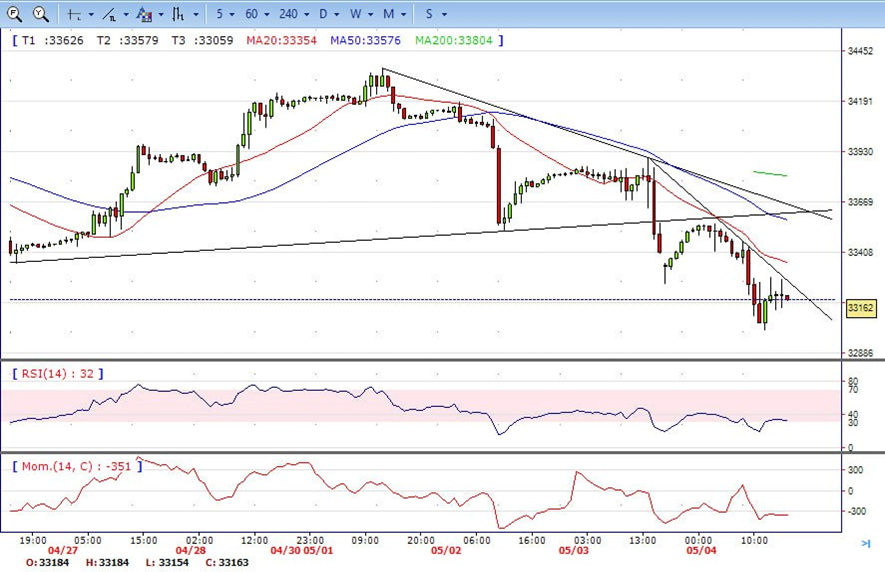
- DJI still under the strong sell pressure on Thursday, dropped from intraday high 33550 area to low 33000 level. It bounced from low modestly and ended the day around 33160. Right now market is standing below 20 and 50 SMA, suggests bearish strength. Meanwhile, 20 SMA continued accelerating south and developing far below longer ones, suggests bears not exhausted yet. On upside, overcome 33290 may encourage bulls to challenge 33560, break above that level will open the gate to 33900.
- Technical indicators suggest the bearish movement. RSI stabilizes around 32, while the Momentum indicator stabilizes below the midline, suggests downward potentials. On downside, the immediately support is 33000, break below this level will open the gate for more decline to 32700 area.
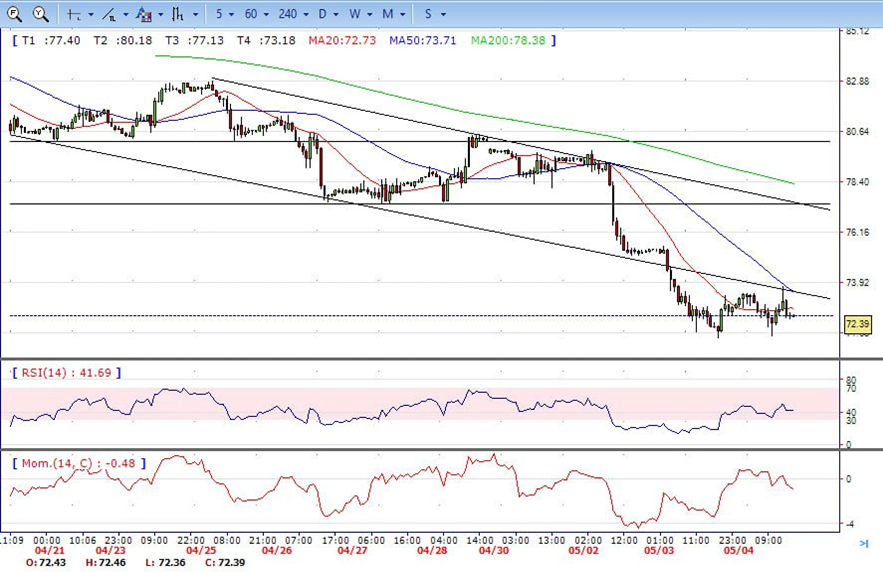
- Brent consolidated in the tight range on Thursday, traded between intraday high 73.70 area to low 71.40. It ended the day around 72.40, modestly up for the day and indicates bearish sign in the hourly chart. Meanwhile, the 20 SMA continued accelerating south and developing far below longer ones, indicates bears not exhausted yet. On upside, overcome 73.70 may encourage bulls to challenge 75.50, break above that level will open the gate to 77.40.
- Technical indicators also suggest bearish movement, hovering below the midline. RSI stabilizes at 42, while the Momentum indicator stabilizes in negative territory, suggests downward potentials. On downside, the immediately support is 71.40, break below this level will open the gate for more decline to 70.00 area.