02/02/2023 Daily Reports
- EUR/USD is taking in the upper quarter of the 1.09 area with printing a high of 1.0985 made so far. The Euro rallied from a low of 1.0852 on the day, completing its daily ATR and bulls keep moving in with eyes on the 1.1000 psychological mark.
- EUR/USD has rallied as the market jumps on a dovish tilt at the Federal Reserve, despite inflation ”running very hot”. However, the Federal Reserve chairman is speaking to the press and he has put no timeline on a pivot, with more rate hikes in the pipeline before a pause ”to get the job done.’‘
- The US Dollar plummeted following the US Federal Reserve’s monetary policy decision. The central bank decided to hike its benchmark rate by 25 basis points (bps) as widely anticipated by market players. The statement showed that policymakers changed the wording on inflation, noting that it “has eased somewhat but remains elevated,” although there were no other relevant changes to the document.
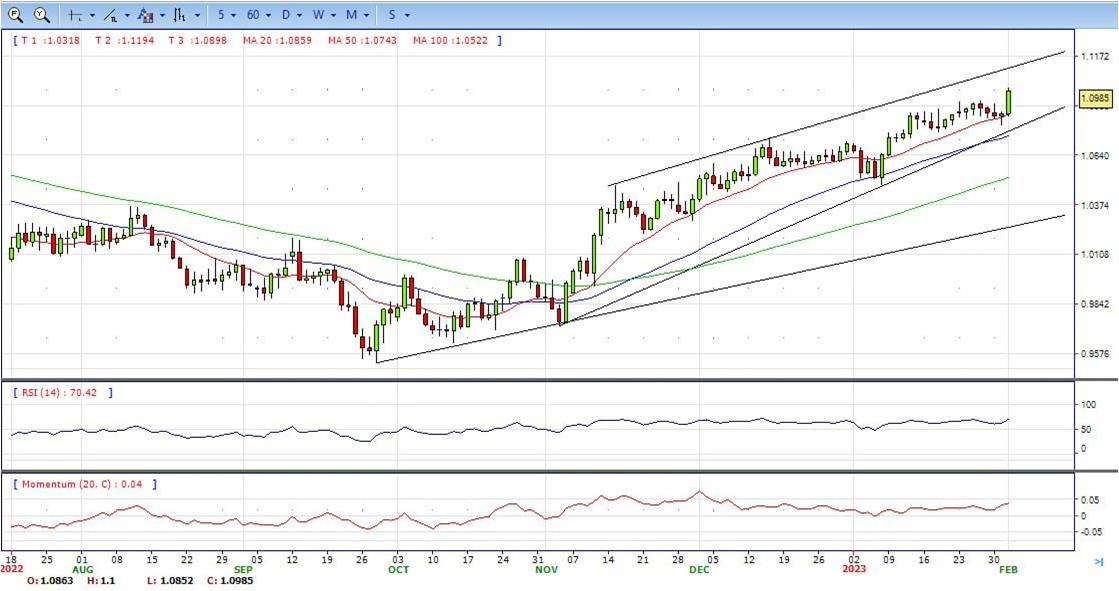
- The EUR/USD pair is trading near the 1.0985, up for the day with bullish stance in daily chart. The pair still stabilized above 20 and 50 SMA, indicates bullish strength. Meanwhile, the 20 SMA continued accelerating north and developing far above longer ones, suggests bulls not exhausted yet. On upside, the immediate resistance is 1.1000, break above this level will extend the advance to 1.1100.
- Technical readings in the daily chart support the bullish stance. The RSI indicator is above 72. The Momentum indicator stabilizes in positive territory, indicating bullish potentials. On downside, the immediate support is 1.0925 and below this level will open the gate to 1.0870.
- GBP/USD has rallied to a high of 1.2393 so far despite a hawkish Federal Reserve chairman Jerome Powell turning the screw with regard to inflation targets following the Fed’s interest rate decision. At the time of typing, the GBP/USD is trading at 1.2370.
- The GBP/USD pair struggled throughout the day to extend gains beyond 1.2300, as investors await the Bank of England monetary policy decision. The BoE is set to raise rates by another 50 basis points, while market players will be looking for clues about an easy pace of tightening from March on.
- US Fed Chair Jerome Powell started his statement by repeating the Fed is strongly committed to reaching its 2% inflation target. He also repeated that job gains have been robust, and the unemployment rate has remained low. However, he later added that, for the first time, “we can declare that a deflationary process has begun.” On the appropriate restrictive level, Powell said that a couple more rate hikes are needed to reach it. Finally, he ended up admitting that rate cuts could take place this year “if inflation comes down much faster.” Following the event, the US Fed Terminal Rate fell to under 4.9%, while the end-2023 Fed Funds Rate fell below 4.4%, as markets are still pricing in rate cuts for this year.
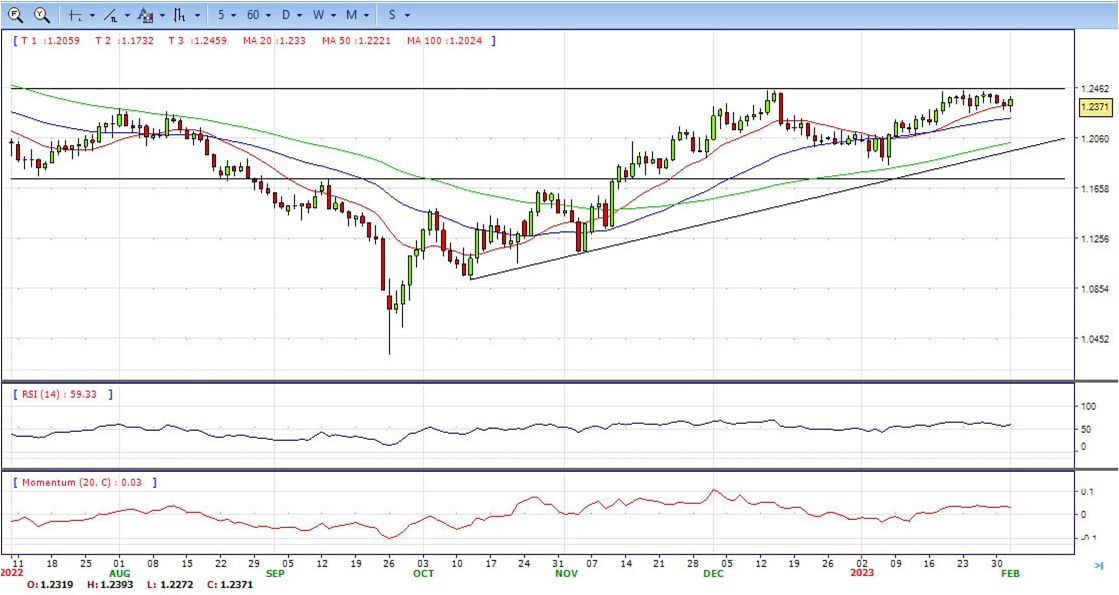
- The GBP/USD offers bullish stance in daily chart. Cable stabilizes above 20 and 50 SMA, indicating bullish strength in short term. Meanwhile, the 20 and 50 SMA continues accelerating north and developing above 200 SMA, suggests bulls not exhausted yet. On upside, The immediate resistance is 1.2450 with a break above it exposing to 1.2580.
- Technical readings in the daily chart support the bullish stances. RSI indicator stabilizes around 60, while the Momentum indicator stabilizes above the midline, suggesting upward potentials. On downside, the immediate support is 1.2260, unable to defend this level will resume the decline to 1.2150.


- Gold price rises following the US Federal Reserve (Fed) decision to slow the pace of interest rate increases and lifted the Federal Funds rate by 25 bps to the 4.50% – 4.75% area. At the time of writing, the XAU/USD is trading volatile but above its opening price, at around the $1950 range.
- In its monetary policy statement, Fed officials voted unanimously to raise rates by 25 bps, emphasizing that additional rate hikes would be appropriate, pushing against the financial market’s expectations for a Fed pivot.
- Policymakers acknowledged that inflation has “eased somewhat but remains elevated.” The Fed added that indicators point to modest growth in spending and production and commented that the labour market remains robust. Officials added, “in determining the extent of future rate hikes, it will take into account cumulative tightening, policy lags and economic and financial developments.”
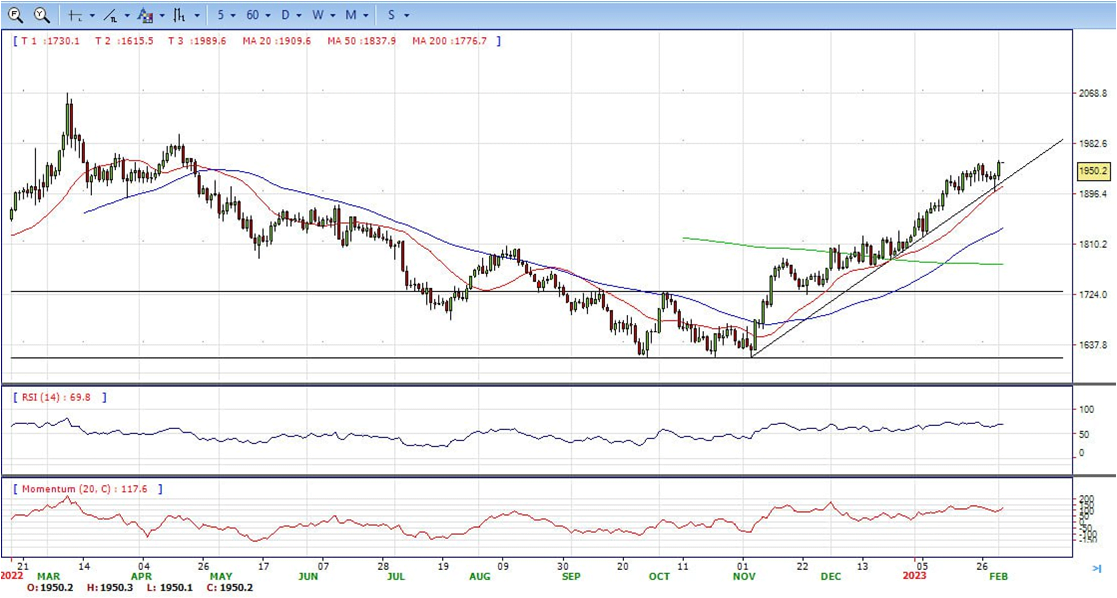
- Gold price stabilized around 1950, up for the day and bullish in the daily chart. The gold price still stabilized above 20 and 50 SMA, suggesting bullish strength in short term. Meanwhile, the 20 and 50 SMA continued accelerating north and developing above 200 SMA, indicating bulls not exhausted yet. On upside, the immediate resistance is 1955, break above this level will open the gate for more advance to 1982 area.
- From a technical perspective, the RSI indicator holds above the mid-line and stabilizes around 69, still on a bullish strength. The Momentum indicator continues developing in positive territory, suggests more upside potentials. On downside, the immediate support is 1895, below this area may resume the decline to 1867.


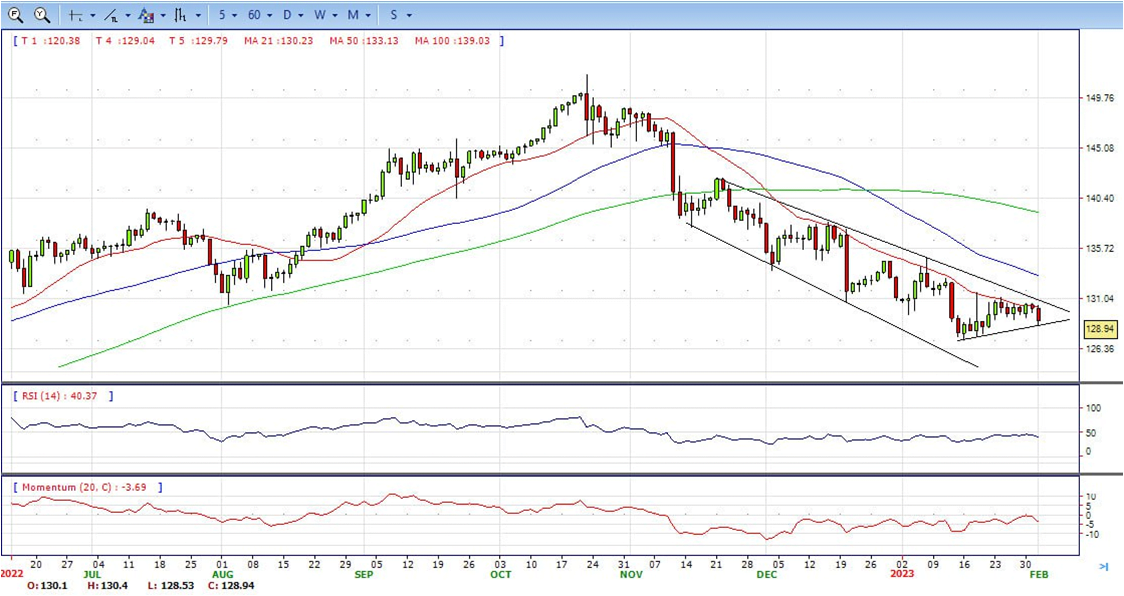
- USD/JPY is plummeting sharply after the US Fed decided to slow down the pace of rate increases and hiked rates by 0.25% on their first monetary policy meeting of 2023. Therefore, the US 10-year Treasury bond yield is plunging more than ten bps toward 3.40% as the market responds to the Fed’s decision and Powell’s speech. At the time of writing, the USD/JPY exchanges hands in a volatile session at around 128.50-129.20.
- On Wednesday, the Federal Reserve policymakers decided unanimously to hike rates by 0.25%, lifting the Federal Funds rate (FFR) at around 4.50% – 4.75%. Additionally, they pushed back against the market’s expectations for a Fed pivot and said additional rate hikes would be appropriate. Policymakers forward guided the market, adding that future rate hikes would be in 25 bps increments, dropping the reference to the “pace” of additional rate hikes.
- In press conference, Powell said it would be premature to declare victory on inflation and said that the job is not fully done. He acknowledged that “it’s a good thing that disinflation so far has not come at expense of the labour market.” He added that the FOMC has not decided on a terminal rate, and if data becomes weaker, then the central bank would become data-dependant.
- The USD/JPY pair stabilized around 128.90, down for the day and bearish in the daily chart. The price maintains the downward slope and develops below all main SMAs, suggests bearish strength in short term. Meanwhile, 20 SMA continued accelerating south and developing below longer ones, indicating bears not exhausted. On upside, overcome 131.10 may encourage bulls to challenge 131.60, break above that level will open the gate to 133.00.
- Technical indicators still suggest the bearish strength. RSI fell to 41, while the Momentum indicator stabilize in negative territory, suggests downward potentials. On downside, the immediate support is 128.50, break below this level will open the gate to 127.20 area.
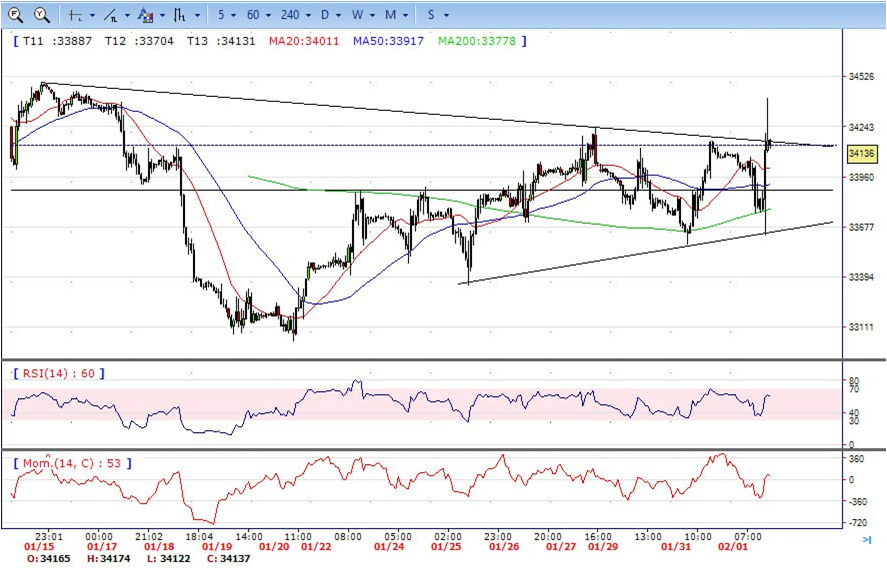
- DJI under the sell pressure on most of the day, but jumped to intraday high 34400 area post FOMC meeting. It trimmed some gains and ended Wednesday around 34150, indicates bullish sign in the hourly chart. Right now market is standing above 20 and 50 SMAs, suggests bullish strength. Meanwhile, 20 SMA started turning north and developing above 50 SMA, suggests bulls not exhausted yet. On upside, overcome 34400 may encourage bulls to challenge 34500, break above that level will open the gate to 34680.
- Technical indicators also suggest the bullish movement, developing above the mid-line. RSI stabilized around 64, while the Momentum indicator hovering well above the midline, suggests upward potentials. On downside, the immediately support is 33900, break below this level will open the gate for more decline to 33580 area.
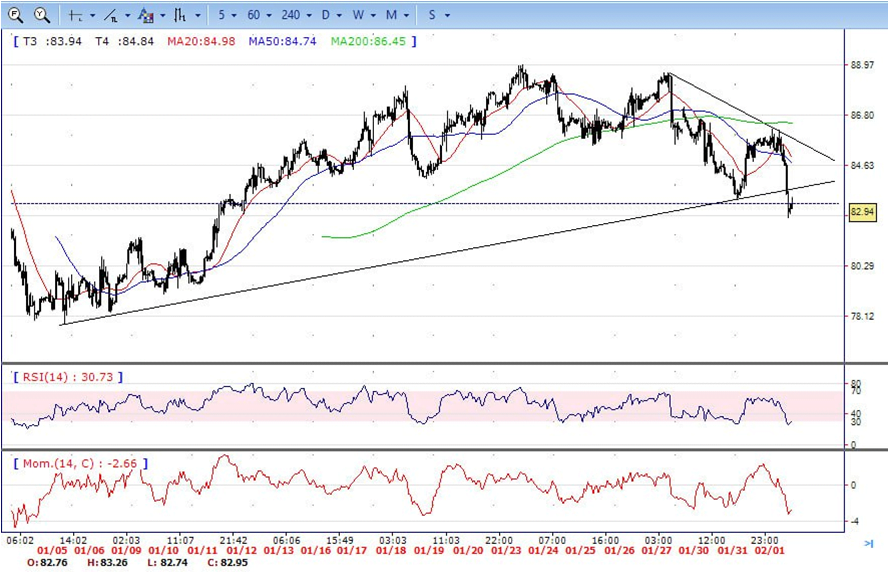
- The Brent still under the sell pressure on Wednesday, dropped from intraday high 86.20 area to low 82.36. It recovered modestly and ended Wednesday around 83.30. The price still stabilized below 20 and 50 SMA, suggests bearish strength in the hourly chart. Meanwhile, the 20 SMA continued accelerating south and developing below longer ones, indicates bears not exhausted yet. On upside, overcome 84.70 may encourage bulls to challenge 86.30, break above that level will open the gate to 87.20.
- Technical indicators also suggest bearish movement, hovering below the midline. RSI drops to 29, while the Momentum indicator stabilizes in negative territory, suggests downward potentials. On downside, the immediately support is 82.30, break below this level will open the gate for more decline to 80.50 area.