02/01/2023 Daily Reports
- The EUR/USD advances modestly in the last trading day of 2022, during the North American session, though above its opening price by 0.13%. A light economic calendar keeps the EUR/USD pair within familiar ranges ahead of the week. At the time of writing, the EUR/USD is trading at 1.0705, still bullish in the daily chart.
- Wall Street is set to open lower as US equity futures tumble with no fundamental catalyst. The US economic calendar is light, with the release of Chicago’s Purchasing Managers Index for December at 44.9, beating an estimate of 40. Thursday’s release of unemployment claims exerted downward pressure on the USD, weakening against most of the G7 currencies.
- The US Dollar Index, a measure of the buck’s value against a basket of currencies, drops 0.33%, down to 103.634. Even though the greenback is falling, the US 10-year Treasury bond yield is rising five bps, at 3.869%.
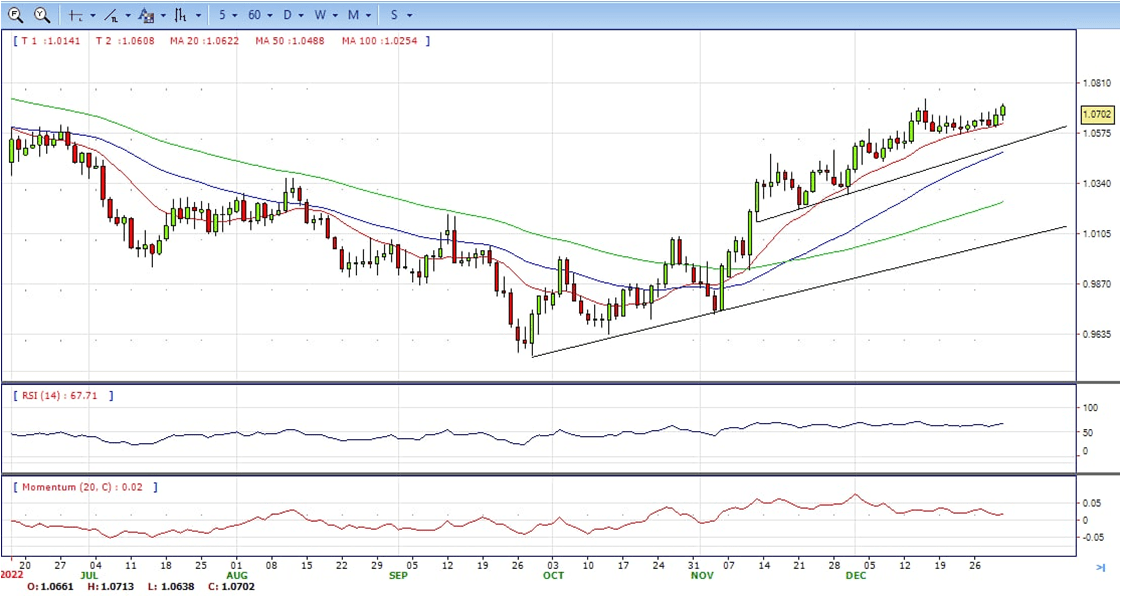
- The EUR/USD pair is trading near the 1.0705, up for the day with bullish stance in daily chart. The pair stabilized above 20 and 50 SMA, indicates bullish strength. Meanwhile, the 20 SMA continued accelerating north and developing far above longer ones, suggests bulls not exhausted yet. On upside, the immediate resistance is 1.0740, break above this level will extend the advance to 1.0780.
- Technical readings in the daily chart support the bullish stances. The RSI indicators hovering above the midline and stabilized around 67. The Momentum indicator stabilized above the midline, indicating upward potentials. On downside, the immediate support is 1.0570 and below this level will open the gate to 1.0500.
- The Pound Sterling pares its losses against the USD due to risk aversion dominating the last trading day of 2022. Wall Street extended its losses, while the lack of news kept the GBP/USD within familiar exchange rates. At the time of writing, the GBP/USD is trading at 1.2085 after testing daily lows of 1.2009, neutral to bearish in the daily chart.
- US equities continued to fall amidst the lack of news. The Chicago PMI for December exceeded estimates of 40.5, at 44.9 but remained in contractionary territory. According to sources cited by MarketWatch, the manufacturing sector is suffering from slow demand spurred by a weaker global economy and a backlog of unfilled orders from the pandemic.
- In the meantime, the lack of economic data in the UK economic calendar keeps investors adrift to the latest developments linked to the energy crisis in the UK. According to the Times, UK’s finance minister Jeremy Hunt has been weighing how much assistance to provide companies when an existing six-month energy support program worth £18 billion expires in March of 2023.
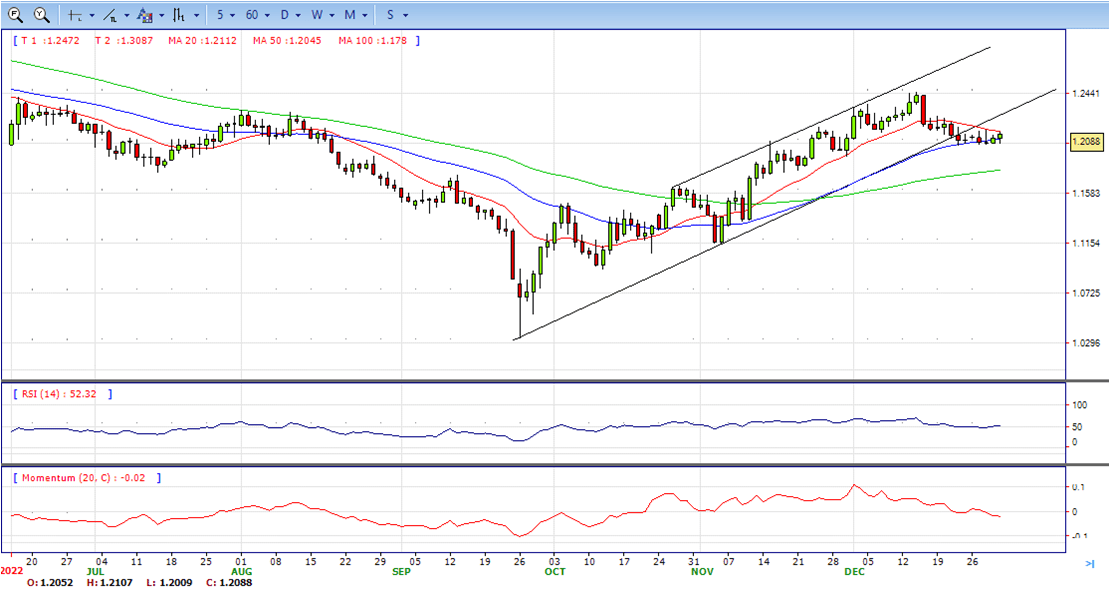
- The GBP/USD offers neutral to bearish stance in daily chart. Cable stabilized between 20 and 50 SMA, indicating neutral strength in short term. However, the 20 SMA started turning south and heading towards 50 SMA, suggests bears not exhausted yet. On upside, The immediate resistance is 1.2150 with a break above it exposing to 1.2250.
- Technical readings in the daily chart support the neutral to bearish stances. RSI indicator stabilized around 50, while the Momentum indicator stabilized below the midline, suggesting downward potentials. On downside, the immediate support is 1.1990, unable to defend this level will resume the decline to 1.1900.


- Gold prices are hovering around $1,824 about to end 2022 practically flat for a wild year. On Friday, XAU/USD rose to as high as $1,826 and hold nearby. The bias point to the upside and still bullish in the daily chart.
- Economic optimism and hopes of lower rates likely to have favored gold buyers could be the recently softer US data, as well as a pullback in the US Treasury bond yields. It’s worth mentioning that Asian economies like India and China are likely to be the growth engine in the next and could help the Gold buyers to keep the reins due to their higher consumption of the bullion.
- Alternatively, Covid woes in China and the geopolitical fears surrounding Ukraine could join the recent weakness in global equities, on a monthly and quarterly basis, to probe the Gold buyers. Additionally, a light calendar and the holiday mood also challenge the metal’s recent moves.
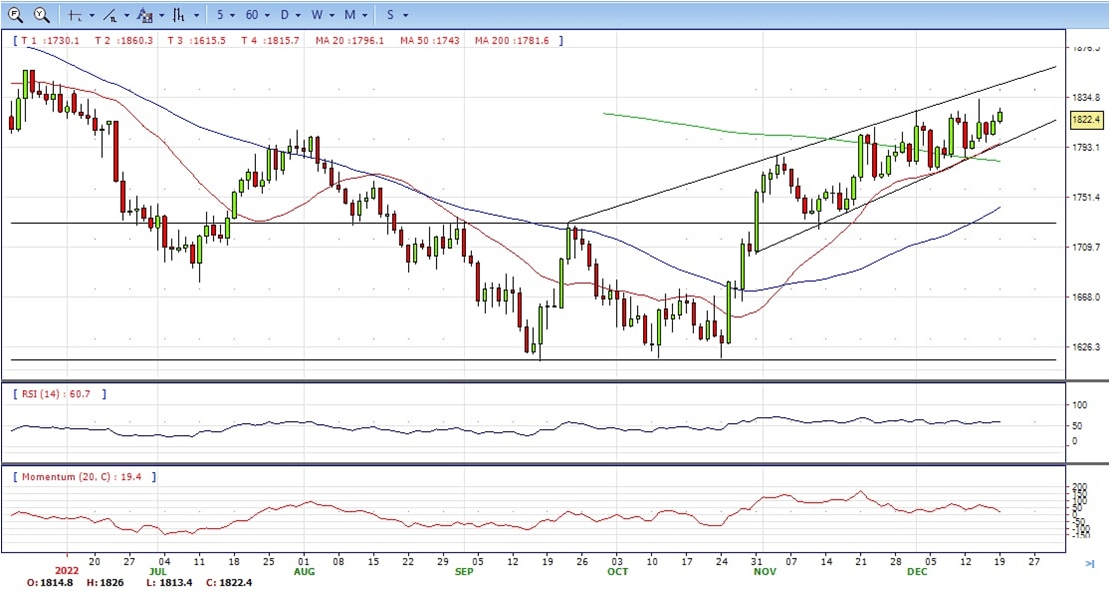
- Gold price stabilized around 1824.5, up for the day and bullish in the daily chart. The gold price still stabilized above 20 and 50 SMA, suggesting bullish strength in short term. Meanwhile, the 20 SMA continued accelerating north and developing above 50 SMA, indicating bulls not exhausted yet. On upside, the immediate resistance is 1834, break above this level will open the gate for more advance to 1858 area.
- From a technical perspective, the RSI indicator hold above the midline and stabilized around 60, suggesting bullish strength. The Momentum indicator stabilized above the midline, suggests upward potentials. On downside, the immediate support is 1797, below this area may resume the decline to 1784.


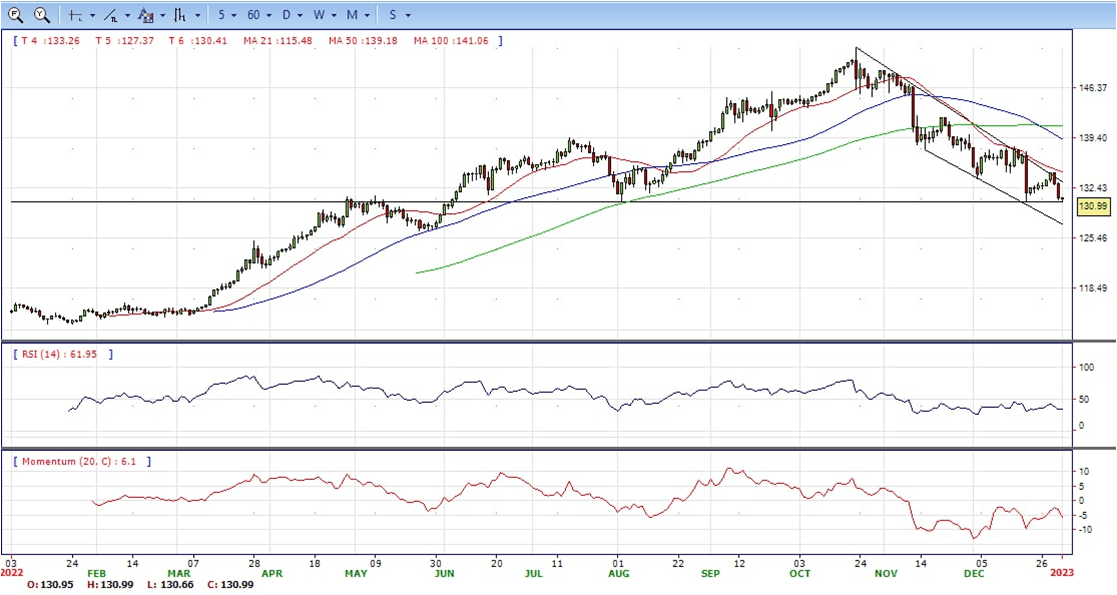
- The USD/JPY is falling for the second consecutive day as risk aversion continues to drive the last trading day of 2022, as shown by Wall Street registering losses. The USD/JPY extended its fall below the December 29 daily low of 132.87 and stabilized at current exchange rates after hitting a daily low of 131.50. At the time of typing, the USD/JPY is trading at 132.11.The decline took place amid a weaker US Dollar across the board hit by an improvement in risk sentiment. US bond yields remained steady. The Dow Jones was rising by more than 300 points while the Nasdaq was adding 2.45%.
- The Japanese currency remains bid on the last trading day of 2022, in spite of the risk appetite observed in equity markets. Concerns about the economic consequences of the coronavirus outbreak in China, and the unscheduled bond purchases announced by the Bank of Japan have spurred demand for the JPY.US economic data showed Initial Jobless Claims rose to 225K during the week ended December 24, in line with expectations while Continuing Claims rose to 1.71 million, the highest level since February. The numbers did not have an impact. Price action remains subdue.
- The USD/JPY pair stabilized around 131.00, down for the day and bearish in the daily chart. The price maintains the downward slope and develops below all main SMAs, suggests bearish strength in short term. Meanwhile, 20 SMA continued accelerating south and developing below longer ones, indicating bears not exhausted. On upside, overcome 132.20 may encourage bulls to challenge 134.50, break above that level will open the gate to 135.70.
- Technical indicators suggest the bearish strength. RSI stabilized around 33, while the Momentum indicator continued developing below the midline, suggests downward potentials. On downside, the immediate support is 130.50, break below this level will open the gate to 129.00 area.
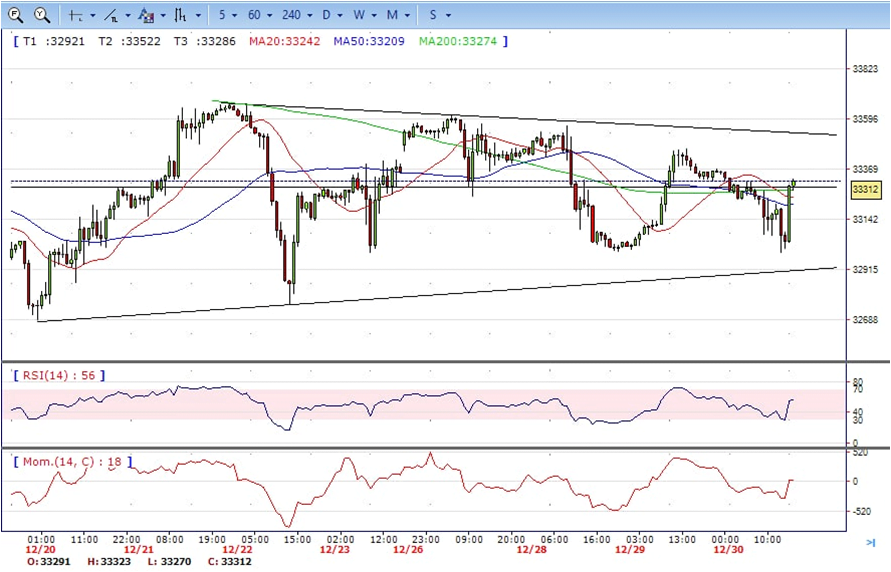
- DJI under the sell pressure, tumbled from intraday high 33450 area to low 33000. It made a U turn and surged to 33310 area to ended the year, slight down for the day and bullish in the daily chart. The price stabilize above 20 and 50 SMA, suggest bullish strength in short term. Meanwhile, 20 SMA started turning flat but continued trading above 50 SMA, suggest bulls not exhausted yet. On upside, overcome 33460 may encourage bulls to challenge 33570, break above this level will open the gate to 34000.
- Technical indicators suggest the bullish strength. RSI stabilize at around 56, while the Momentum indicator stabilize in positive territory, suggest upward potentials. On downside, the immediate support is 33300, break below this level will open the gate for more decline to 33000 area.
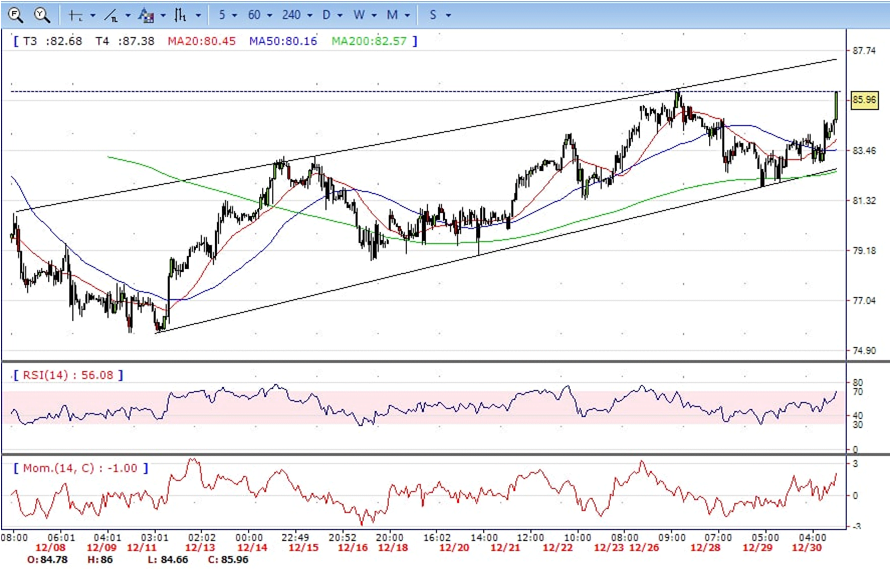
- Brent continued the advance, climbed from intraday low 82.80 to intraday high 86.00 and ended The year nearby, up for the day and bullish in the hourly chart. The price stabilize above 20 SMA and 50 SMA, suggests bullish strength in short term. Meanwhile, the 20 SMA continue accelerating north and developing above 50 SMA, indicating bulls not exhausted yet. On upside, overcome 86.10 may encourage bulls to challenge 88.10, break above this level will open the gate to 89.10.
- Technical indicators suggest the bullish movement, hovering above the midline. RSI stabilize at around 70, while the Momentum indicator stabilize in positive territory, suggest upward potentials. On downside, the immediate support is 84.00, break below this level will open the gate for more decline to 82.90 area.