01/02/2023 Daily Reports
- EUR/USD is at a crossroads trading around 1.0865 and slightly up on the day by .015% having ranged between a low of 1.0802 and 1.0874 in what has been a two-way business day ahead of central bank meetings.
- The Federal Reserve showdown on Wednesday is the first major risk for EUR/USD and then the ECB will be on Thursday, but the icing on the cake could be the US nonfarm Payrolls on Friday, especially if there are any surprises to come from that event. The central bank outcomes are expected to see the Federal Reserve hike by no more than 25 basis points and the European Central Bank by 50 basis points.
- The communication leading up to these interest rates decisions has pretty much sealed the deal in this respect and markets are also expecting hawkish rhetoric from the central bank governors, Powell and Lagarde respectively. However, their tone around growth and inflation as well as guidance on further potential hikes could be market-moving. Indeed, the FOMC will want to flag the fact that we are going to see higher rates for a little bit longer, but it’s all about whether or not the market believes that narrative.
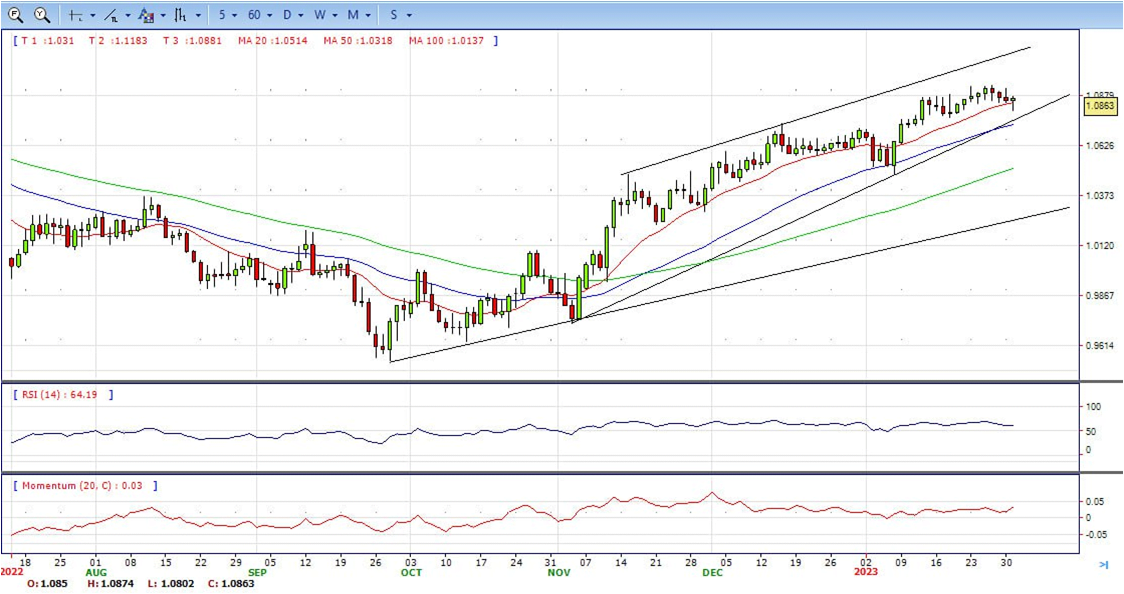
- The EUR/USD pair is trading near the 1.0865, up for the day with bullish stance in daily chart. The pair still stabilized above 20 and 50 SMA, indicates bullish strength. Meanwhile, the 20 SMA continued accelerating north and developing far above longer ones, suggests bulls not exhausted yet. On upside, the immediate resistance is 1.0930, break above this level will extend the advance to 1.1000.
- Technical readings in the daily chart support the bullish stance. The RSI indicator is above 61. The Momentum indicator stabilizes in positive territory, indicating bullish potentials. On downside, the immediate support is 1.0800 and below this level will open the gate to 1.0760.
- The Pound Sterling extended its losses to three straight days against the US Dollar, albeit a report from the Commerce Department showed that inflation continued to ease, incrementing expectations that US Fed rate hikes would moderate. At the time of typing, the GBP/USD is trading at 1.2321.
- Wall Street advances after employment costs data cooled down. The US Department of Labor revealed that the Employment Cost Index eased from 1.2% to 1% QoQ. Today’s data added to last week’s US Core PCE, edged lower by the fourth straight month, from 4.7% YoY to 4.4%. All that said, speculations had mounted that the Fed will increase rates by 25 bps at its two-day meeting, which begins today and finishes on Wednesday when the US central bank releases its monetary policy statement.
- Across the pond, the UK’s economic docket was absent. However, newswires reported that the IMF revealed that Britain’s economy would slide into a recession. The IMF foresees the economy to shrink 0.5% between the 2022 Q4 and the final quarter of 2023.
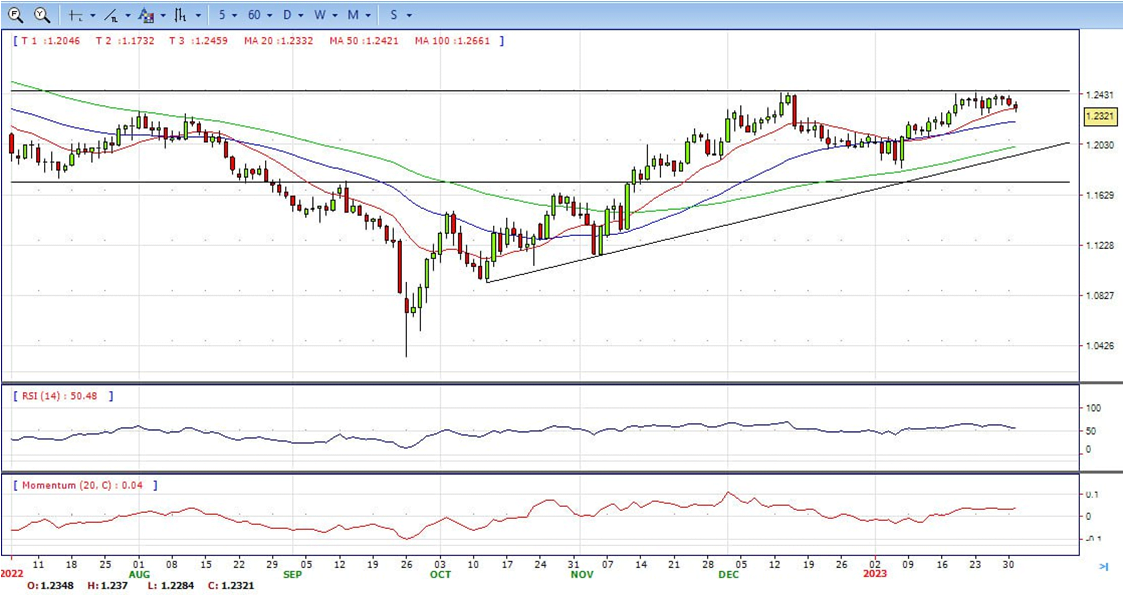
- The GBP/USD offers bullish stance in daily chart. Cable stabilizes above 20 and 50 SMA, indicating bullish strength in short term. Meanwhile, the 20 and 50 SMA continues accelerating north and developing above 200 SMA, suggests bulls not exhausted yet. On upside, The immediate resistance is 1.2450 with a break above it exposing to 1.2580.
- Technical readings in the daily chart support the bullish stances. RSI indicator stabilizes around 56, while the Momentum indicator stabilizes above the midline, suggesting upward potentials. On downside, the immediate support is 1.2260, unable to defend this level will resume the decline to 1.2150.


- Gold prices bounced sharply higher following the release of US labor costs data for the fourth quarter. More evidence of a slowdown in inflation pushed US yields to the downside and Wall Street to the upside, weakening the greenback. The yellow metal ended the day around $1,927, still bullish in the daily chart.
- The Employment Cost Index rose 1% in the fourth quarter, below the 1.1% of market consensus and marked the third consecutive slowdown. Still the index is up by 4% compared to a year ago. The evidence of an improvement in the inflation outlook boosted US yields ahead of Wednesday’s FOMC decision.
- The Fed is widely expected to raise its policy rate by 25 bps to the range of 4.5-4.75%. In case Powell continues to push back against the ‘Fed pivot’ narrative and tries to convince markets that they have no plans of cutting the policy rate before 2024, US T-bond yields could edge higher and weigh on XAU/USD. However, investors are unlikely to bet on a steady USD rebound before seeing the employment and inflation figures for January.
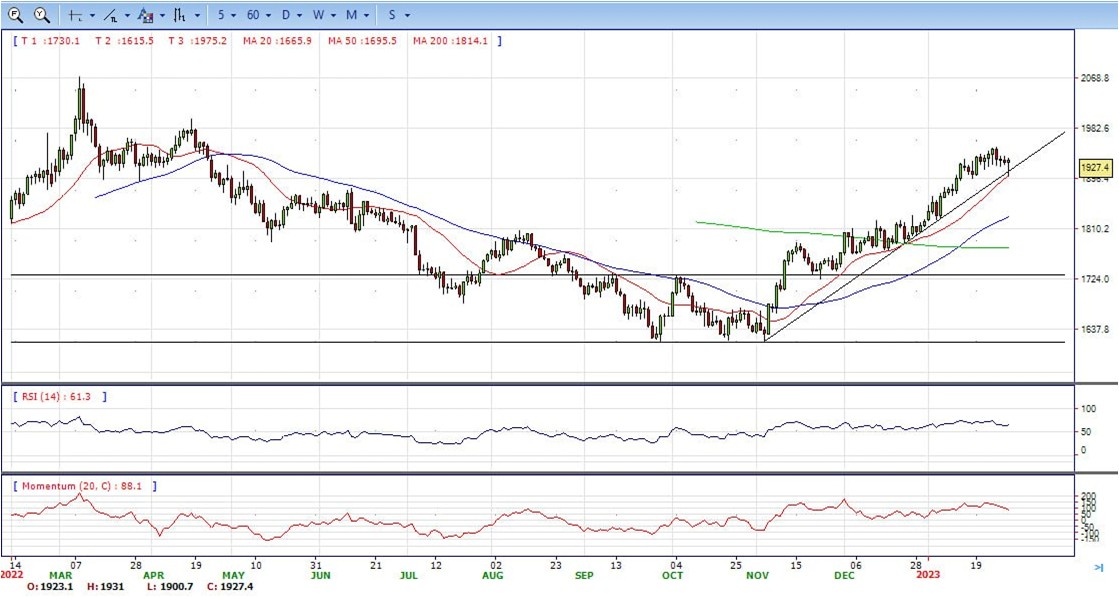
- Gold price stabilized around 1927, up for the day and bullish in the daily chart. The gold price still stabilized above 20 and 50 SMA, suggesting bullish strength in short term. Meanwhile, the 20 and 50 SMA continued accelerating north and developing above 200 SMA, indicating bulls not exhausted yet. On upside, the immediate resistance is 1950, break above this level will open the gate for more advance to 1982 area.
- From a technical perspective, the RSI indicator holds above the mid-line and stabilizes around 65, still on a bullish strength. The Momentum indicator continues developing in positive territory, suggests more upside potentials. On downside, the immediate support is 1895, below this area may resume the decline to 1867.


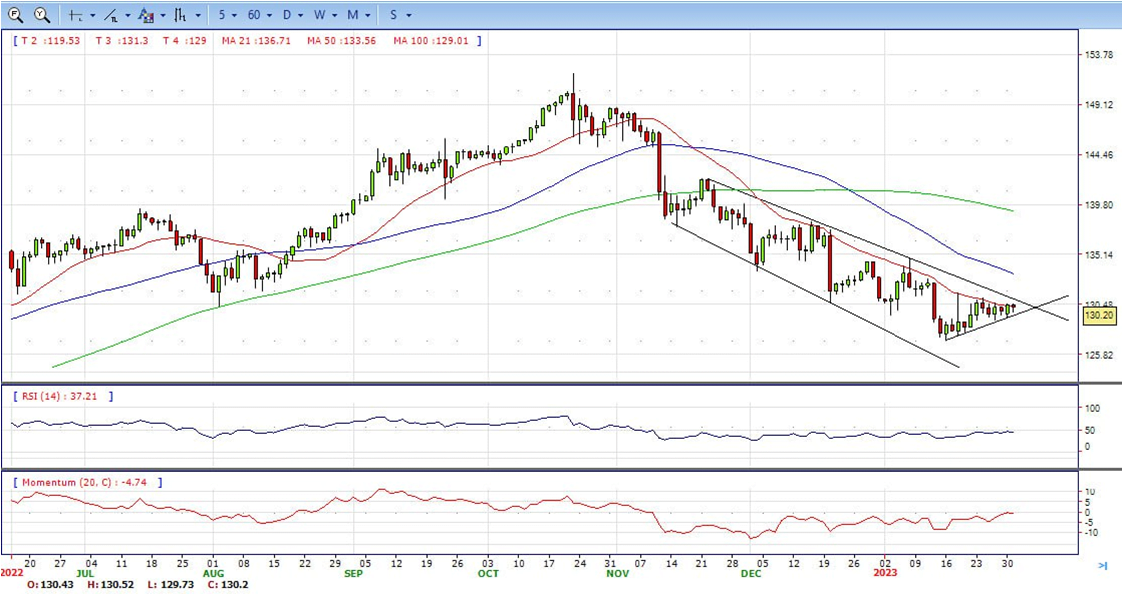
- The USD/JPY tumbled and then rebounded during the American session, but overall it remained in a familiar range, hovering above 130.00
- The surprise of the day so far was the influence of the Employment Cost Index. The numbers triggered price action across financial markets. The ECI rose 1% in the fourth quarter, below the 1.1% of market consensus. It points to a continuation of the slowdown in inflation. Following the report, the Dollar tumbled, Wall Street soared and Treasury yields rose.
- A different economic report showed the S&P/Case-Shiller Home Price Index rose by 6.8% (y/y) in November below the 6.9% of market consensus and the 8.7% of the previous month. Conference Board announced the Consumer Confidence Index came in at 107.1 in January below the expected 109.0.
- The USD/JPY pair stabilized around 130.20, down for the day and bearish in the daily chart. The price maintains the downward slope and develops below all main SMAs, suggests bearish strength in short term. Meanwhile, 20 SMA continued accelerating south and developing below longer ones, indicating bears not exhausted. On upside, overcome 131.10 may encourage bulls to challenge 131.60, break above that level will open the gate to 133.00.
- Technical indicators still suggest the bearish strength. RSI fell to 45, while the Momentum indicator stabilize in negative territory, suggests downward potentials. On downside, the immediate support is 129.00, break below this level will open the gate to 128.00 area.
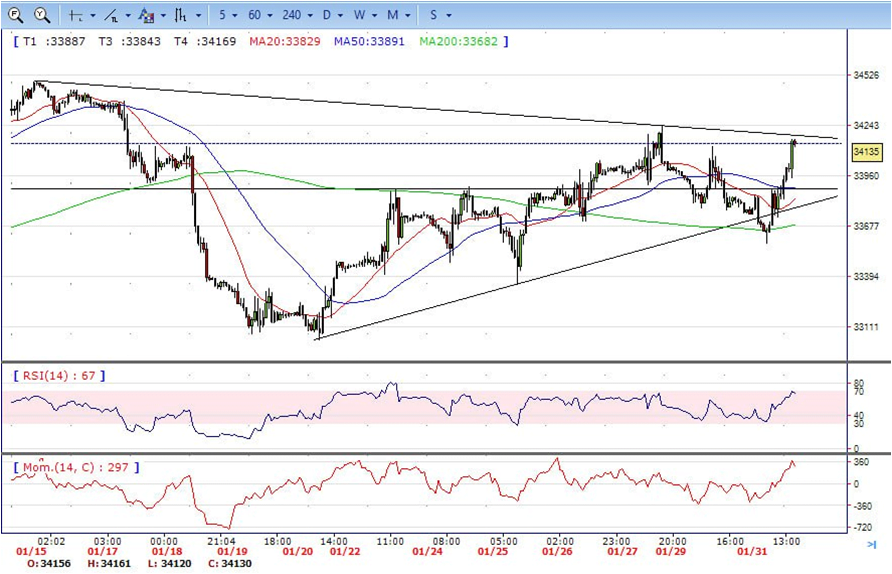
- DJI continued the advance, jumped from intraday low 33570 to high 34160. It hold near the top and ended Tuesday around 34110, indicates bullish sign in the hourly chart. Right now market is standing above 20 and 50 SMAs, suggests bullish strength. Meanwhile, 20 SMA started turning north and heading towards 50 SMA, suggests bulls not exhausted yet. On upside, overcome 34250 may encourage bulls to challenge 34500, break above that level will open the gate to 34680.
- Technical indicators also suggest the bullish movement, developing above the mid-line. RSI stabilized around 68, while the Momentum indicator hovering well above the midline, suggests upward potentials. On downside, the immediately support is 33900, break below this level will open the gate for more decline to 33580 area.
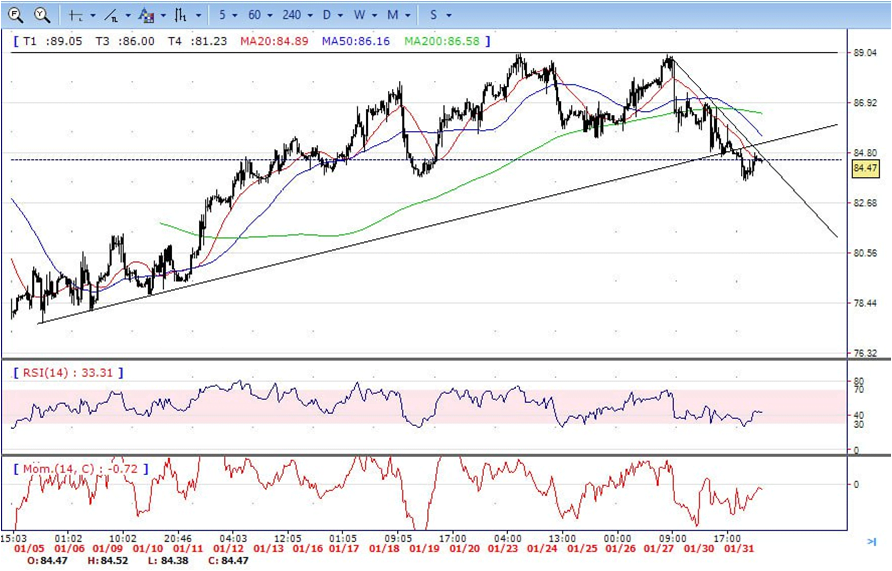
- The Brent still under the sell pressure on Monday, dropped from intraday high 86.00 area to low 83.60. It trimmed some losses and back to 84.50 are to ended Tuesday. The price still stabilized below 20 and 50 SMA, suggests bearish strength in the hourly chart. Meanwhile, the 20 SMA continued accelerating south and developing below longer ones, indicates bears not exhausted yet. On upside, overcome 84.80 may encourage bulls to challenge 86.00, break above that level will open the gate to 87.40.
- Technical indicators also suggest bearish movement, hovering below the midline. RSI drops to 43, while the Momentum indicator stabilizes in negative territory, suggests downward potentials. On downside, the immediately support is 83.60, break below this level will open the gate for more decline to 82.00 area.