EUR/USD
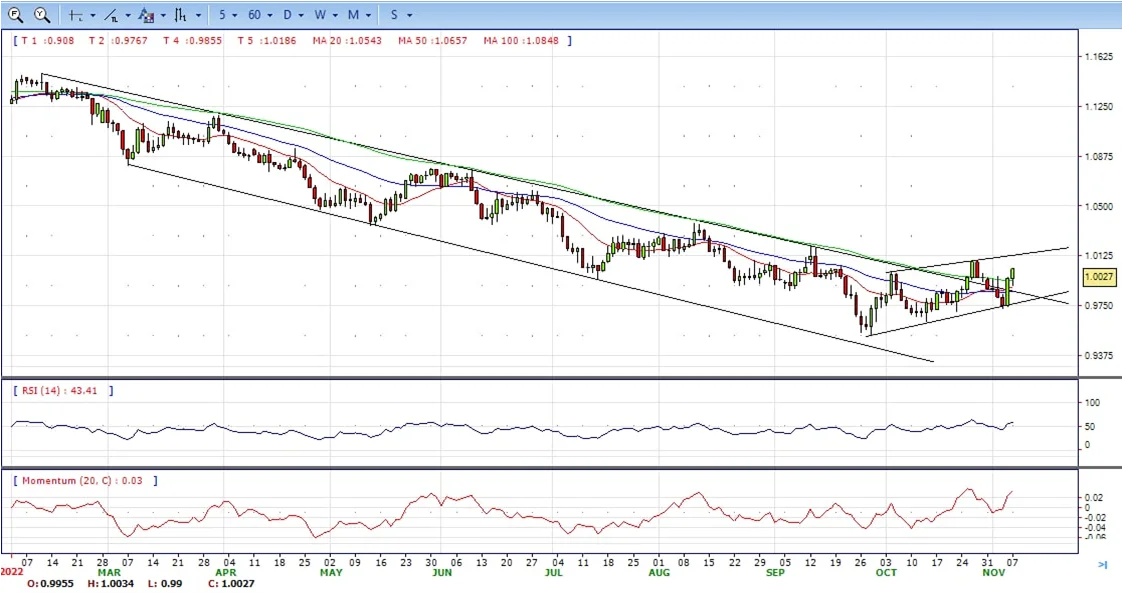
- EURUSD advances for the second session in a row and gains around three cents since last week’s lows around 0.9730, always against the backdrop of the persistent sell-off in the greenback. It ended the day at around 1.0030, bullish in the daily chart.
- Indeed, the dollar remains offered as market participants continue to gauge the mixed results from Friday’s US Payrolls as well as recent Fedspeak leaning towards an impasse in the Fed’s normalization process.
- Meanwhile, all will come down to this week’s inflation data from the US. Currently, the markets are of the mind that the US economy is slowing enough to allow the Federal Reserve to ease its rate-hiking pace and the ongoing speculation that China may ease COVID restrictions.
- The EUR/USD pair is trading near the 1.0030, up for the day with the neutral to bullish stance in daily chart. The pair stabilized above 20 and 50 SMA, indicates bullish strength. Meanwhile, the 20 SMA started turning north and heading towards longer ones, suggests bulls not exhausted yet. On upside, the immediate resistance is 1.0100, break above this level will extend the advance to 1.0200.
- Technical readings in the daily chart support the bullish stances. The RSI indicators hovering above the midlines and stabilized around 58. The Momentum indicator stabilized above the midline, indicating upward potentials. On downside, the immediate support is 0.9900 and below this level will open the gate to 0.9800.
Open A Demo
CDO has wide range of tools, professional and friendly support for clients to achieve their financial markets trading goals. Open a live account now to enjoy this experience with virtual deposit.
GBP/USD
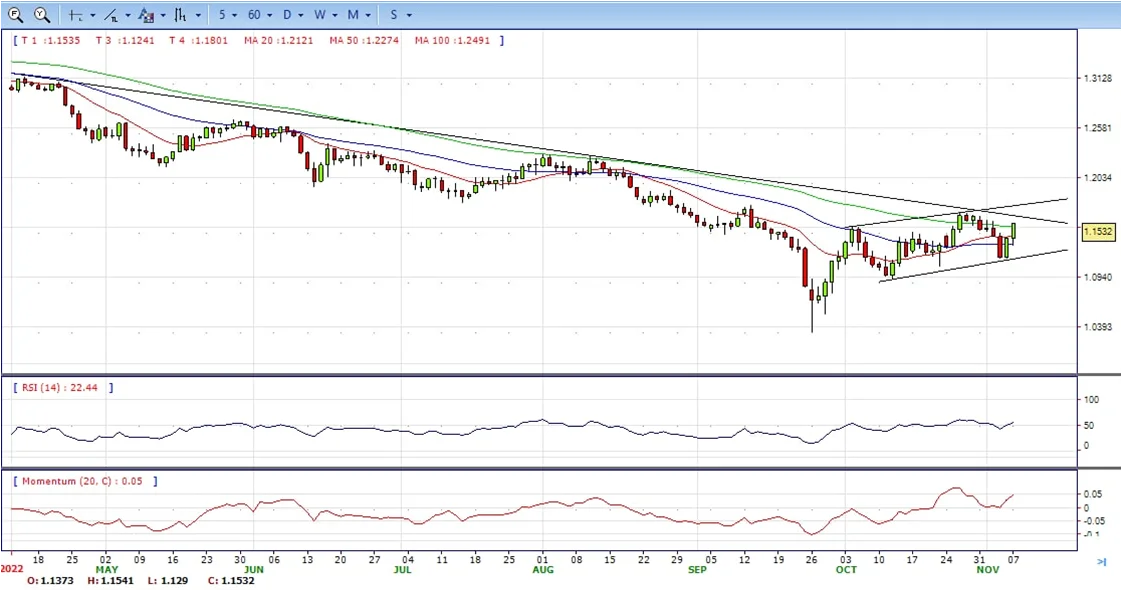
- The British Pound extended its gains during the North American session due to upbeat market sentiment spurred by a seasonal US mid-term elections rally. The GBPUSD is trading solidly in the green above 1.1500, gaining 1.35% at the beginning of the week.
- In the last week, the US Department of Labor reported October’s data that the labor market remains tight, adding 261K jobs to the economy, usually perceived as hawkish for the Federal Reserve. Still, the Average Hourly Earnings eased from 5% in September to 4.7%, aligned with estimations, while, the Unemployment Rate edged up from 3.5% to 3.7%, suggesting the effects of monetary policy began to affect the labor market.
- Aside from this, some Fed officials during the last week, led by Susan Collins of the Boston Fed, said that rates need to go higher than expected in September, though she said that it makes sense to move slowly to balance inflation/growth risks. In the meantime, Richmond Fed President Thomas Barkin said it is “conceivable” that the Federal funds rate (FFR) will end above 5%, and he foresees a potentially higher peak.
- The GBP/USD offers bullish stance in daily chart. Cable stabilized above 20 and 50 SMAs, indicating bullish strength in short term. Meanwhile, the 20 SMA started turning north and continued developing above 50 SMA, suggests bulls not exhausted yet. On upside, The immediate resistance is 1.1600 with a break above it exposing to 1.1650.
- Technical readings in the daily chart support the bullish stances. RSI indicator stabilized around 54, while the Momentum indicator stabilized above the midline, suggesting upward potentials. On downside, the immediate support is 1.1430, unable to defend this level will resume the decline to 1.1290.

CDO TRADER
CDO TRADER, our cutting-edge trading platform, follows the technology from the forefront with new features added continuously. Moreover, CDO TRADER is now available for Android and iOS! So it allows you to trade on the go!
XAU/USD
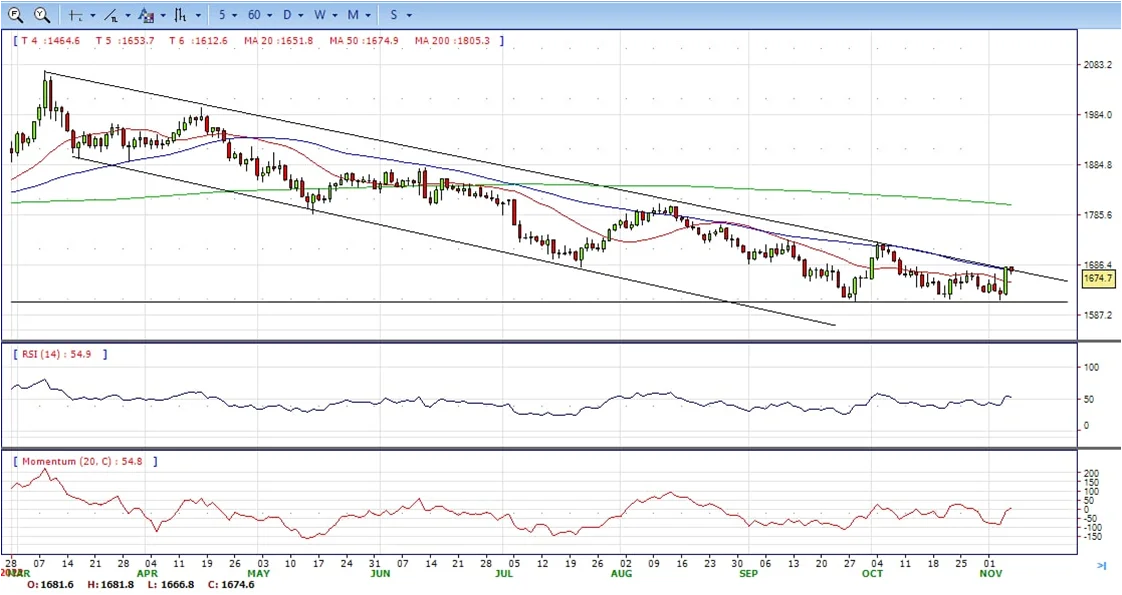
- Gold price have bounced up from $1,665 on Monday’s early European session appreciating on the back of US dollar weakness in a risk-on session, although it seems unable to find acceptance above $1,682 so far. It ended Monday at around $1,675, neutral in the daily chart.
- Precious metals have opened the week on a moderately bid tone, favored by a positive mood. Market rumors pointing out to a review of COVID-19 restrictions in China have improved investors’ sentiment on Monday, curbing demand for the safe-haven USD.
- The comments by the Chinese National Health Commission, which has reiterated the Government’s commitment to the Zero-COVID policy and warned about the possibility of severe restrictions ahead, as the winter flu season approaches have tempered appetite for risk but have not altered the market mood, which remains moderately positive, with the greenback losing ground against a basket of the most traded currencies.
- Gold price stabilized around 1674, down for the day and neutral to bullish in the daily chart. The gold price stabilized above 20 and 50 SMA, suggesting bullish strength. However, the 20 SMA continued accelerating south and developing below longer ones, indicating bears not exhausted yet. On upside, the immediate resistance is 1682, break above this level will open the gate to extend the advance to 1700 area.
- From a technical perspective, the RSI indicator hold near the midline and stabilized around 52, suggesting bullish strength. The Momentum indicator struggled near the midline, suggests directionless potentials. On downside, the immediate support is 1645, below this area may resume the decline to 1600.
MetaTrader 4
MT4 has user friendly interface that is providing simplicity and efficiency. The traders can perform trading strategies for different products like Forex and CFD. MetaTrader 4 has over 50 built-in indicators, also it’s the tool that predicts trends and defines the appropriate entry and exit points.

USD/JPY
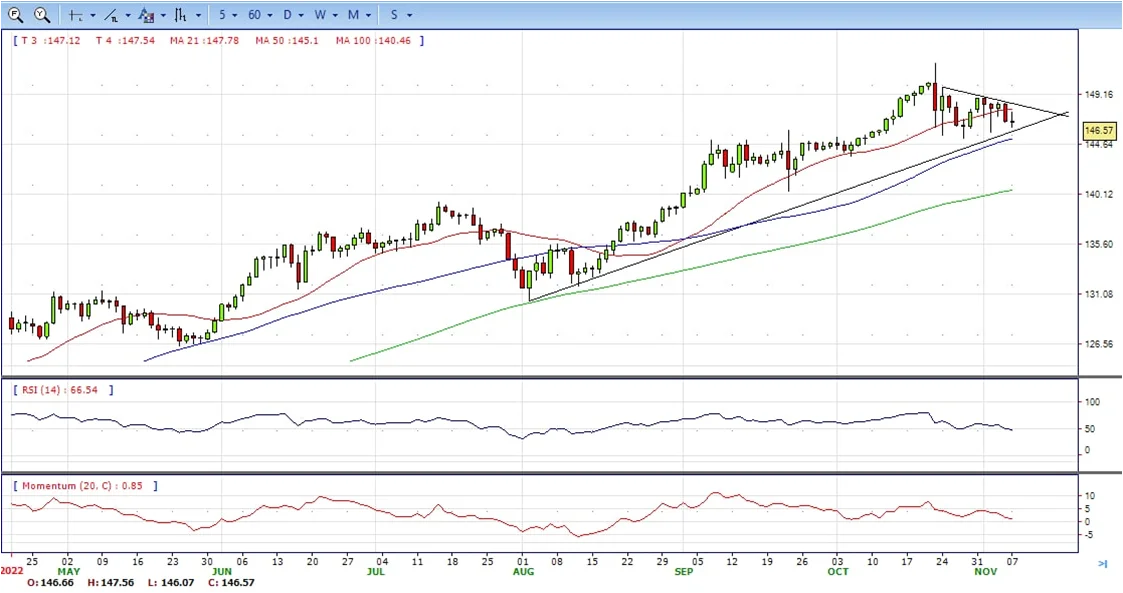
- The USDJPY pair struggles to capitalize on its modest intraday gains to the 147.55 area and turns lower for the second successive day on Monday. At the time of typing, the USDJPY is trading at 146.50, below its opening price and neutral to bearish in the daily chart.
- The US Dollar adds to the post-NonFarm Payrolls heavy losses and drops to over a one-week low amid speculations that the Federal Reserve will slow the pace of its rate-hiking cycle. Apart from this, expectations that Japanese authorities might intervene again to soften any steep fall in the domestic currency exert some downward pressure on the pair.
- That said, the risk-on impulse might keep a lid on any meaningful gains for the safe-haven JPY and help limit deeper losses. This, along with a big divergence in the monetary policy stance adopted by the Fed and the Bank of Japan, supports prospects for the emergence of some dip-buying around the pair, warranting caution for bearish traders.
- The USD/JPY pair stabilized around 146.50, down for the day and neutral to bullish in the daily chart. The price still maintains the upward slope and stabilized between 20 and 50 SMA, suggests neutral strength in short term. Meanwhile, 20 SMA continued accelerating north and developing above longer ones, indicating bulls not exhausted. On upside, overcome 148.50 may encourage bulls to challenge 149.00, break above that level will open the gate to 149.70.
- Technical indicators suggest the neutral strength. RSI stabilized around 49, while the Momentum indicator continued developing near the midline, suggests directionless potentials. On downside, the immediate support is 146.00, break below this level will open the gate to 145.00 area.
DJI
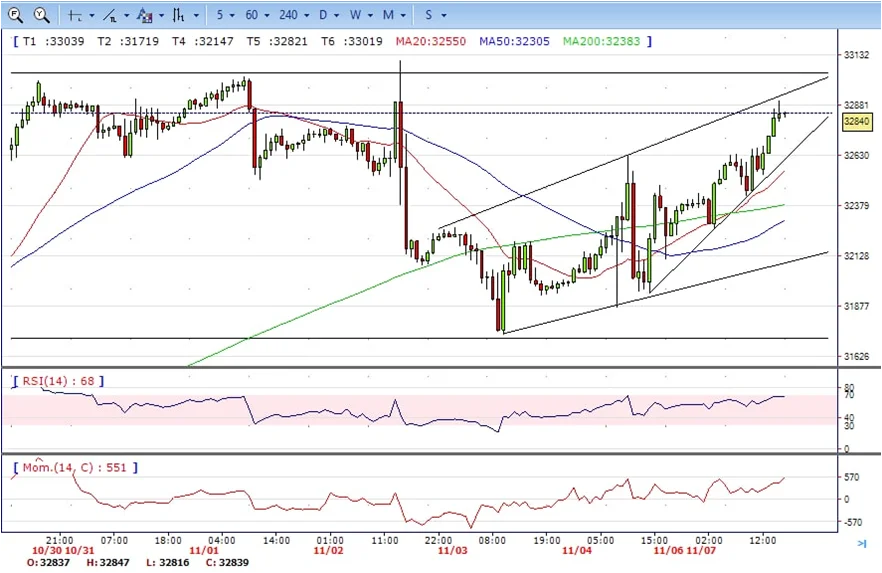
- DJI continued the advance, climbed from intraday low 32110 area to 32903 daily high. It retreated modestly and ended Monday at around 32840, up for the day and bullish in the hourly chart. The price stabilized above all main SMAs, suggests bullish strength. Meanwhile, 20 SMA continued accelerating north and developing above longer ones, suggests bulls not exhausted yet. On upside, overcome 33000 may encourage bulls to challenge 33200, break above this level will open the gate to 33400.
- Technical indicators suggest the bullish strength. RSI stabilized around 68, while the Momentum indicator stabilized above the midline, suggests upward potentials. On downside, the immediate support is 32650, break below this level will open the gate for more decline to 32430 area.
BRENT
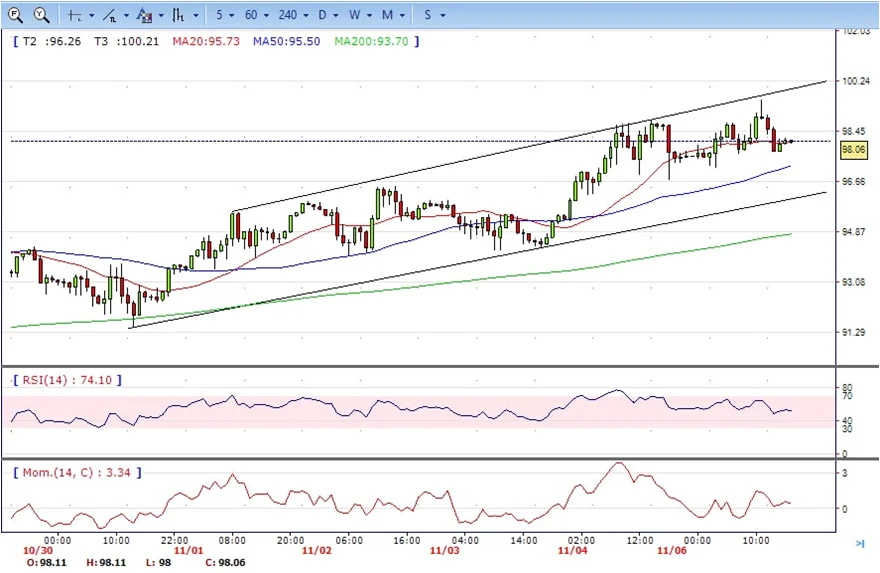
- Brent consolidated in the familiar range, climbed from intraday low 96.70 area to intraday high 99.56, it trimmed some gains and ended Monday at around 98.05, down for the day and bullish in the hourly chart. The price stabilized above 20 and 50 SMA, suggests bullish strength in short term. Meanwhile, the 20 SMA continued accelerating south and developing above 50 SMA, indicating bulls not exhausted yet. On upside, overcome 99.60 may encourage bulls to challenge 100.15, break above this level will open the gate to 102.30.
- Technical indicators suggest the bullish movement, hovering above the midline. RSI stabilized at around 52, while the Momentum indicator stabilized in positive territory, suggests upward potentials. On downside, the immediate support is 96.70, break below this level will open the gate for more decline to 95.30 area.
Contact Us
Please, fill the form to get an assistance.


