31/03/2023 Daily Reports
- EUR/USD rallied on easing fears about banking sector troubles and US stocks on Wall Street have moved higher on encouraging economic signs from the chip industry. In a risk-on setting, EUR/USD has travelled from a low of 1.0823 to a high of 1.0926 so far as investors grew more confident that recent stress in the banking sector would be contained.
- The banking turmoil in the collapse of two regional US lenders had sparked concerns about contagion in the banking sector which led to a dramatic shift in monetary policy expectations from the Federal Reserve. Meanwhile, according to CME Group’s Fedwatch tool, bets are now almost equally split between a pause and a 25-basis-point rate hike by the Fed in May,
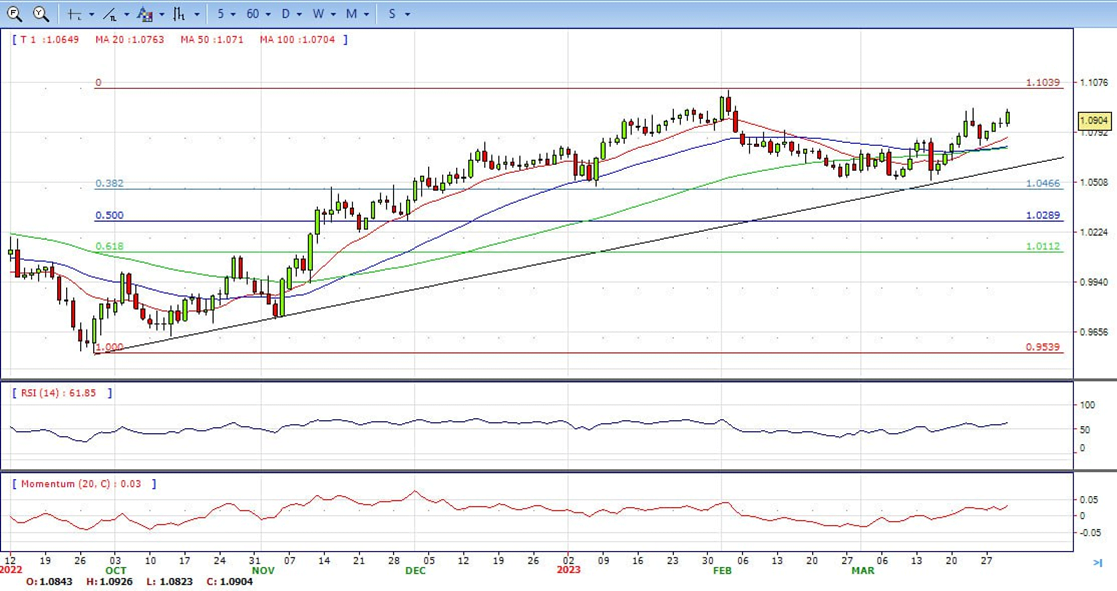
- The EUR/USD pair is trading near the 1.00904, up for the day with bullish stance in daily chart. The pair stabilized above 20 and 50 SMA, indicates bullish strength. Meanwhile, the 20 SMA continued accelerating north and heading towards 50 and 200 SMA, suggests bulls not exhausted yet. On upside, the immediate resistance is 1.0930, break above this level will extend the advance to 1.1030.
- Technical readings in the daily chart support the bullish stance. The RSI indicator stabilizes around 63. The Momentum indicator holds above the midline, indicating bullish potentials. On downside, the immediate support is 1.0820 and below this level will open the gate to 1.0700.
- Further losses in the greenback allow GBP/USD to pick up extra pace and reach the 1.2380 region, or multi-week highs, on Thursday.
- GBP/USD sees its upside pressure intensify on the back of the persistent selling pressure in the greenback and the solid improvement in the risk complex on Thursday. The marked knee-jerk in the dollar came in response to higher-than-expected inflation figures in Germany, which could reinforce the case for further tightening by the ECB as soon as at the May gathering. In the meantime, price action around the British pound appears underpinned by the better tone among its risk-linked peers, while the continuation of the hiking cycle by the BoE should offer some extra support to the quid despite the “Old Lady” could be approaching its peak on rates.
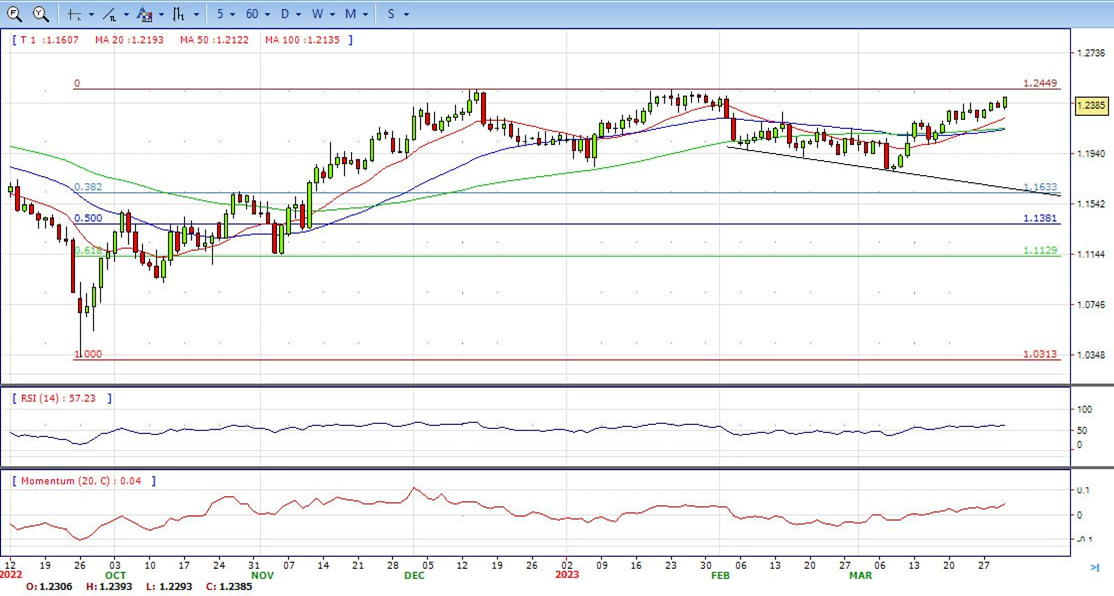
- The GBP/USD offers bullish stance in daily chart. Cable stabilizes above 20 and 50 SMA, indicating bullish strength in short term. Meanwhile, the 20 SMA continued accelerating north and heading towards longer ones, suggests bulls not exhausted yet. On upside, the immediate resistance is 1.2450 with a break above it exposing to 1.2550.
- Technical readings in the daily chart support the bullish stances. RSI indicator stabilizes around 63, while the Momentum indicator stabilizes above the midline, suggesting upward potentials. On downside, the immediate support is 1.2280, unable to defend this level will resume the decline to 1.2170.


- Gold price breaks out of its narrow range and enters $1,980s after US data supports a more positive outlook for the precious metal, on Thursday.
- Gross Domestic Product Annualized (Q4) came out at 2.6% when it was expected to remain unchanged at 2.7%, indicating lower-than-expected growth. This will have further weighed on expectations that the Fed will continue raising rates to combat higher prices. The data is causing a sell-off in the Dollar, with the US Dollar Index down 0.15% since the release, and this is supporting XAU/USD’s rebound.
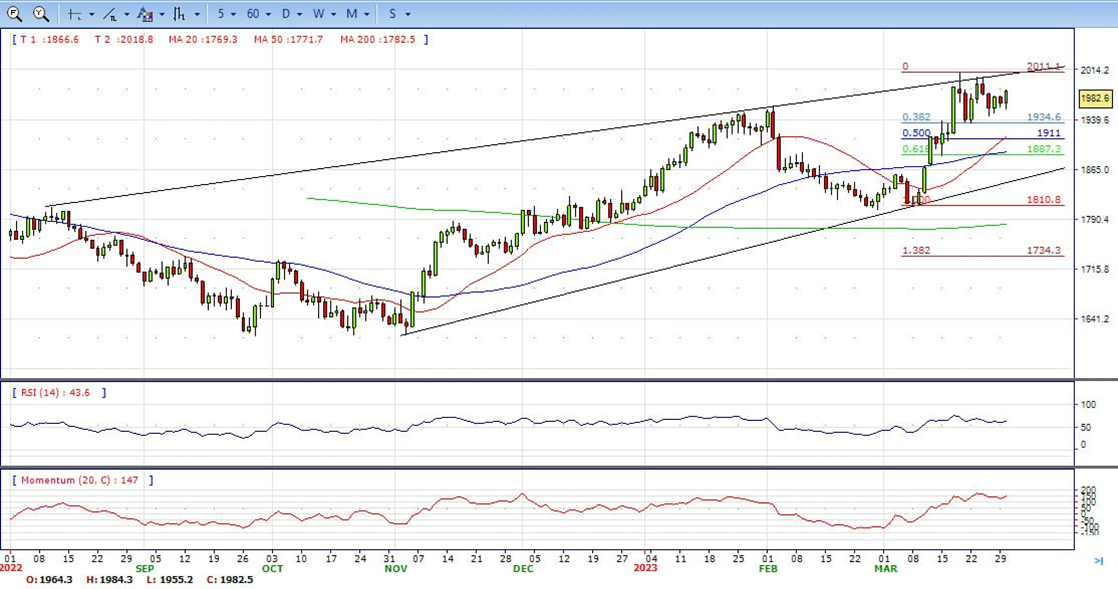
- Gold price stabilized around 1982, up for the day and bullish in the daily chart. The gold price still stabilizes above all main SMAs, suggesting bullish strength in short term. Meanwhile, the 20 continued accelerating north and continued developing far above 200 SMA, indicates bulls not exhausted yet. On upside, the immediate resistance is 2010, break above this level will open the gate for more advance to 2040 area.
- From a technical perspective, the RSI indicator holds above the mid-line and stabilizes around 63, on a bullish strength. The Momentum indicator hold in the positive territory, suggests upward potentials. On downside, the immediate support is 1934, below this area may resume the decline to 1919.


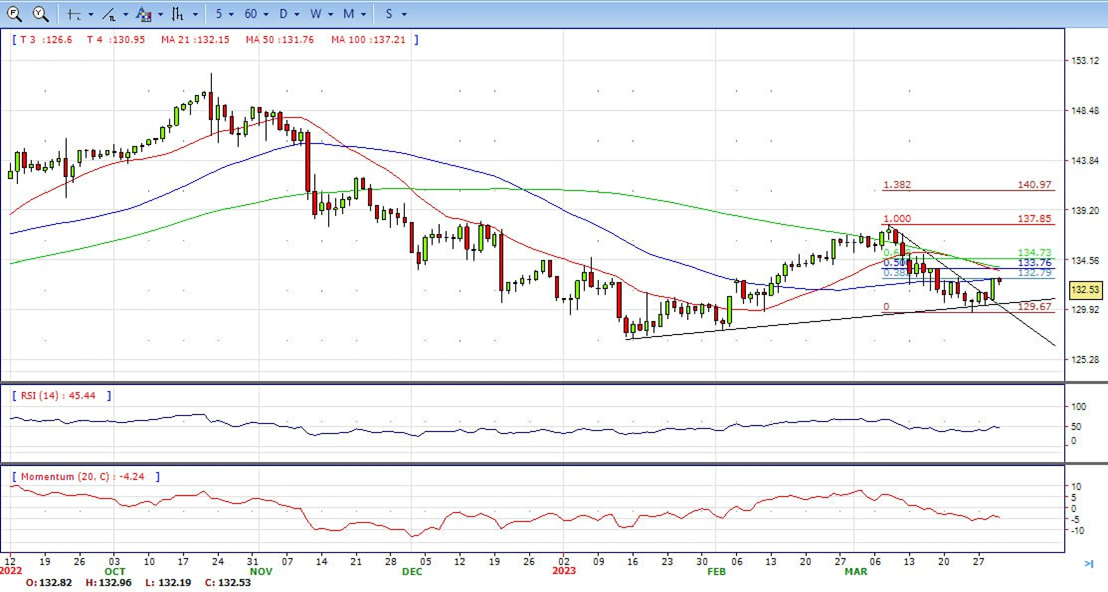
- The USD/JPY pair rebounds around 30 pips from the daily low and steadily climbs back closer to the top end of its daily trading range towards the end of US session. The pair is currently placed around the 132.55 region, modestly down for the day and just below the one-week high touched on Wednesday.
- An extension of the risk-on rally across the global equity markets undermines the safe-haven Japanese Yen (JPY) and assists the USD/JPY pair to attract some dip-buying near the 132.20 area. The global risk sentiment remains well supported by receding fears of a full-blown banking crisis, especially after the takeover of Silicon Valley Bank by First Citizens Bank & Trust Company. Furthermore, no further cracks have emerged in the banking sector over the past two weeks, which boosts investors’ appetite for riskier assets and continues to drive flows away from traditional safe-haven currencies, including the JPY.
- The USD/JPY pair stabilized around 132.55, down for the day and bearish in the daily chart. The price still stabilizes below 20 and 50 SMA, suggests bearish strength in short term. Meanwhile, 20 SMA continued accelerating south and heading towards 50 SMA, indicating bears not exhausted. On upside, overcome 133.00 may encourage bulls to challenge 133.80, break above that level will open the gate to 135.10.
- Technical indicators suggest the bearish strength. RSI stabilizes around 47, while the Momentum indicator stabilizes below the midline, suggests downward potentials. On downside, the immediate support is 131.60, break below this level will open the gate to 130.40 area.
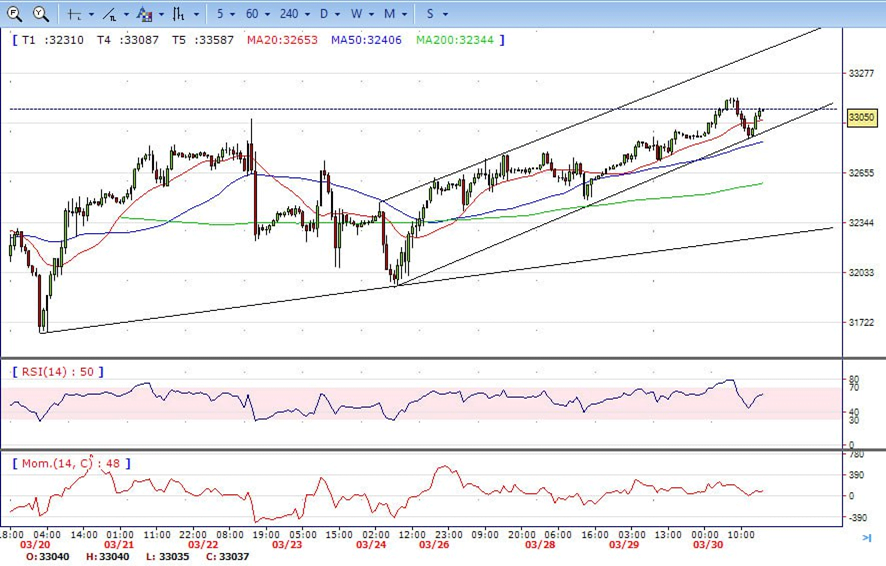
- DJI continued the advance, climbed from the intraday low 32860 area to intraday high 33123. It holds near the top and ended Wednesday around 33045, up for the day and indicates bullish sign in the hourly chart. Right now market is standing above 20 and 50 SMA, suggests bullish strength. Meanwhile, 20 SMA continued accelerating north and developing above longer ones, suggests bulls not exhausted yet. On upside, overcome 33300 may encourage bulls to challenge 33600, break above that level will open the gate to 33900.
- Technical indicators suggest the bullish movement. RSI stabilizes around 61, while the Momentum indicator stabilizes above the midline, suggests upward potentials. On downside, the immediately support is 32850, break below this level will open the gate for more decline to 32420 area.
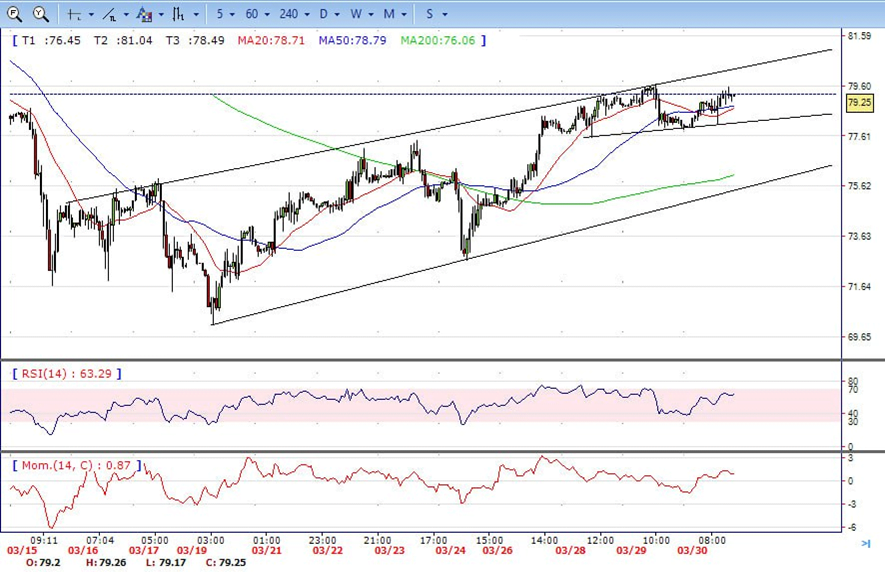
- Brent consolidated in the familiar range, traded from intraday low 77.84 area to intraday high 79.56. It holds near the top and ended Thursday around 79.25, up for the day and indicates bullish sign in the hourly chart. Meanwhile, the 20 SMA started turning north and continued developing far above 200 SMA, indicates bulls not exhausted yet. On upside, overcome 79.70 may encourage bulls to challenge 80.50, break above that level will open the gate to 82.00.
- Technical indicators also suggest bullish movement, hovering above the midline. RSI stabilizes at 62, while the Momentum indicator stabilizes in positive territory, suggests upward potentials. On downside, the immediately support is 77.50, break below this level will open the gate for more decline to 76.00 area.