28/06/2023 Daily Reports
- The Euro has continued its positive momentum from Monday, resulting in EUR/USD reaching the 1.0975/80 band, or 3-day highs, on Tuesday. On the other hand, the US Dollar is experiencing a downward correction, relegating the USD Index to trade in 3-day lows in the 102.30 region amidst declining US yields.
- Contributing to the daily uptick in EUR/USD emerges European Central Bank Board member Martin Kazaks after he stated that he sees rate hikes extending beyond July, despite the economy softening. He mentioned that he cannot determine at the moment the extent to which rates will increase. Moreover, he pointed out that the markets are making a mistake by predicting rate cuts.
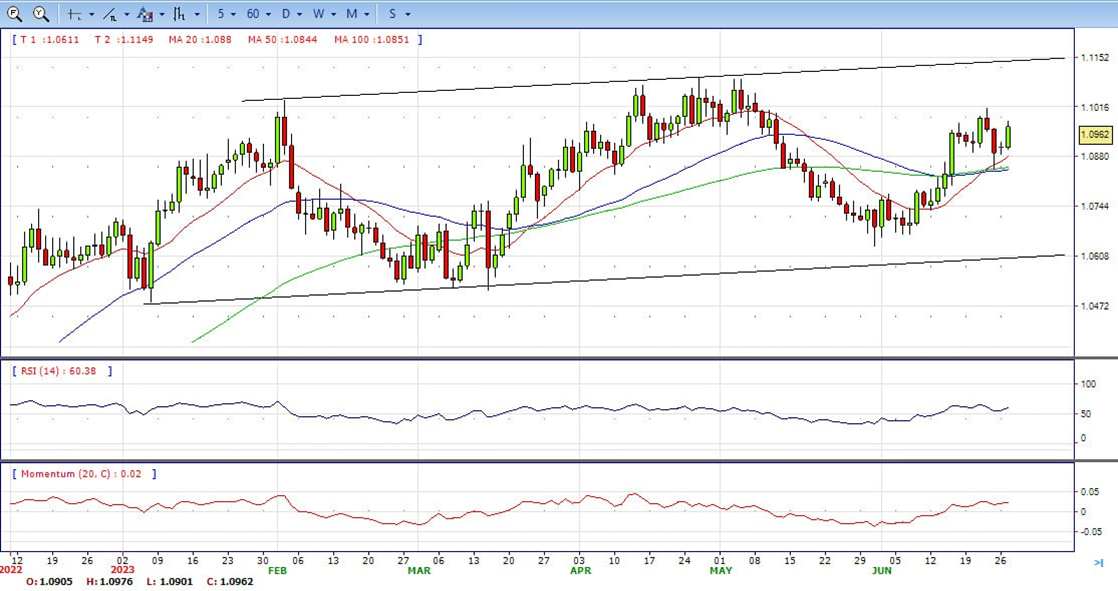
- The EUR/USD pair is trading near the 1.0960, up for the day with bullish stance in daily chart. The pair stabilized above all main SMAs, indicates bullish strength. Meanwhile, the 20 SMA continued accelerating north and heading towards 50 and 200 SMA, suggests bulls not exhausted yet. On upside, the immediate resistance is 1.1010, break above this level will extend the advance to 1.1100.
- Technical readings in the daily chart support the bullish stance. The RSI indicator stabilizes around 60. The Momentum indicator holds above the midline, indicating upward potentials. On downside, the immediate support is 1.0840 and below this level will open the gate to 1.0800.
- The GBP/USD pair is trading back and forth in a narrow range of 1.2700-1.2750 in the early London session. The upside in the Cable is restricted as higher inflationary pressures in the United Kingdom have dampened its economic outlook while the downside is supported due to correction in the US Dollar Index.
- The US Dollar Index is hovering near 102.60 as investors are divided about the monetary outlook by the Fed. Fed chair Jerome Powell conveyed last week that the central bank will continue tightening interest rates but at a careful pace. Going forward, the speech from Bank of England (BoE) Governor Andrew Bailey will remain in focus. BoE Bailey is expected to remain hawkish as UK’s core inflation has printed a fresh high of 7.1%.
- The GBP/USD offers bullish stance in daily chart. Cable stabilizes above 20 and 50 SMA, indicating bullish strength in short term. Meanwhile, the 20 and 50 SMA started turning flat but continued developing above longer ones, suggests bulls not exhausted yet. On upside, the immediate resistance is 1.2850 with a break above it exposing to 1.3000.
- Technical readings in the daily chart support the bullish stances. RSI indicator stabilizes around 62, while the Momentum indicator stabilizes above the midline, suggesting upward potentials. On downside, the immediate support is 1.2680, unable to defend this level will resume the decline to 1.2550.


- Gold price retreats after hitting a daily high of $1930 due to overall upbeat data from the US, which portrays the economy’s resilience, despite higher borrowing costs set by the US Fed. US Treasury bond yields edge up a headwind for the yellow metal. The XAU/USD is trading at $1914, with losses of 0.48%.
- XAU/USD remains under pressure as market sentiment shifts positively. Durable Goods Orders in the US surprised market participants by rising 1.7% MoM in May, above estimates of -1% plunge, and 0.5% above April’s 1.2% data. Data eases fears for a hard landing in the US, as witnessed by Gold prices sliding, which is usually sought as a safe-haven asset in times of global economic slowdown.
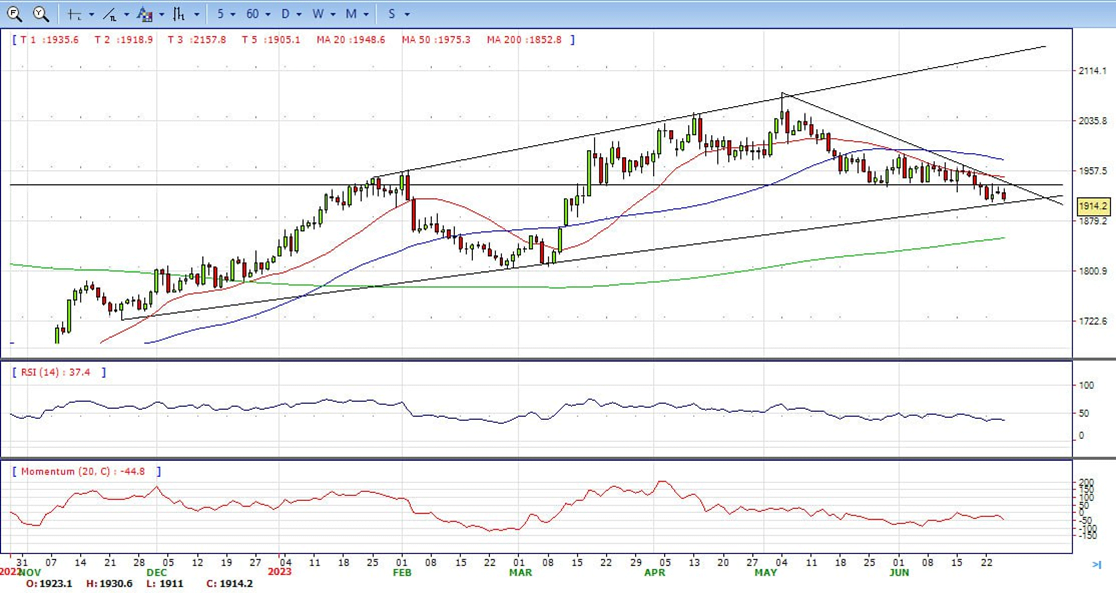
- Gold price stabilized around 1914, down for the day and bearish in the daily chart. The gold price stabilizes below 20 SMA, suggesting bearish strength in short term. Meanwhile, the 20 SMA continued accelerating south and developing below 50 SMA, indicates bears not exhausted yet. On upside, the immediate resistance is 1938, break above this level will open the gate for more advance to 1960 area.
- From a technical perspective, the RSI indicator holds below the midline and stabilizes around 37, on a bearish strength. While the Momentum indicator also stabilized in the negative territory, suggests downward potentials. On downside, the immediate support is 1900, below this area may resume the decline to 1885.


- On Tuesday, the USD/JPY jumped to a fresh multi-month high at 144.16 following optimistic economic activity data. The Greenback gained traction on the back of rising US Treasury Bond yields ahead of Jerome Powell’s speech on Wednesday. Governor Ueda from the BoJ will also deliver a speech, potentially impacting the JPY price dynamics.
- The DXY Index found support at a daily low of 102.32 and recovered to 102.50. US bond yields also recovered as strong economic activity may hint at a more aggressive Federal Reserve (Fed) tightening in the future. The 2-year rate rebounded from a low of 4.65% to 4.75%, while the 5 and 10-year yields increased to 4.01% and 3.75%. In addition, the bond market may see volatility on Wednesday, when Jerome Powell will deliver a speech at the European Central Bank Forum in Sintra, Portugal.
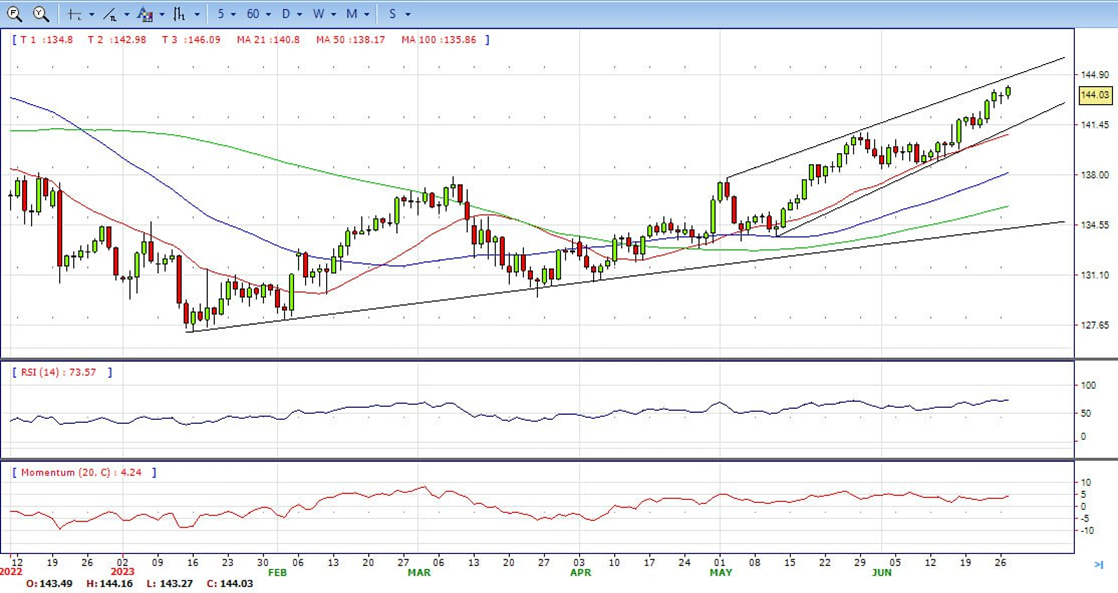
- The USD/JPY pair stabilized around 144.00, up for the day and bullish in the daily chart. The price stabilizes above 20 and 50 SMA, suggests bullish strength in short term. Meanwhile, 20 SMA continued accelerating north and developing above longer ones, indicating bulls not exhausted. On upside, overcome 144.20 may encourage bulls to challenge 145.50, break above that level will open the gate to 147.00.
- Technical indicators suggest the bullish strength. RSI stabilizes around 73, while the Momentum indicator stabilizes above the midline, suggests upward potentials. On downside, the immediate support is 142.60, break below this level will open the gate to 141.20 area.
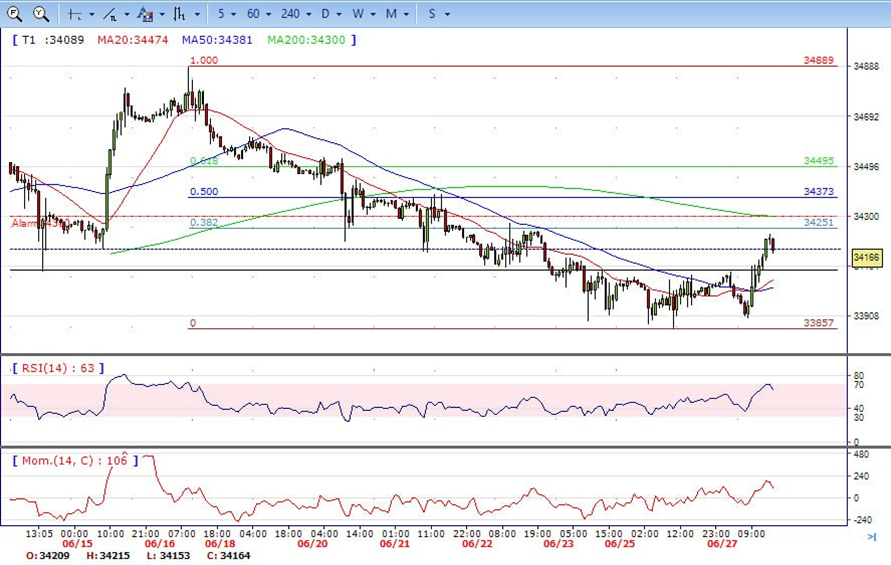
- DJI made a strong rally on Tuesday, traded from intraday low 33900 level to high 34230. It holds near the top and ended the day around 34160, above 50 and 200 SMA, suggests bullish strength. Meanwhile, 20 SMA started turning north and heading towards longer ones, suggests bulls not exhausted yet. On upside, overcome 34250 may encourage bulls to challenge 34400, break above that level will open the gate to 34530.
- Technical indicators suggest the bullish movement. RSI stabilizes around 62, while the Momentum indicator stabilizes above the midline, suggests upward potentials. On downside, the immediately support is 34070, break below this level will open the gate for more decline to 33850 area.
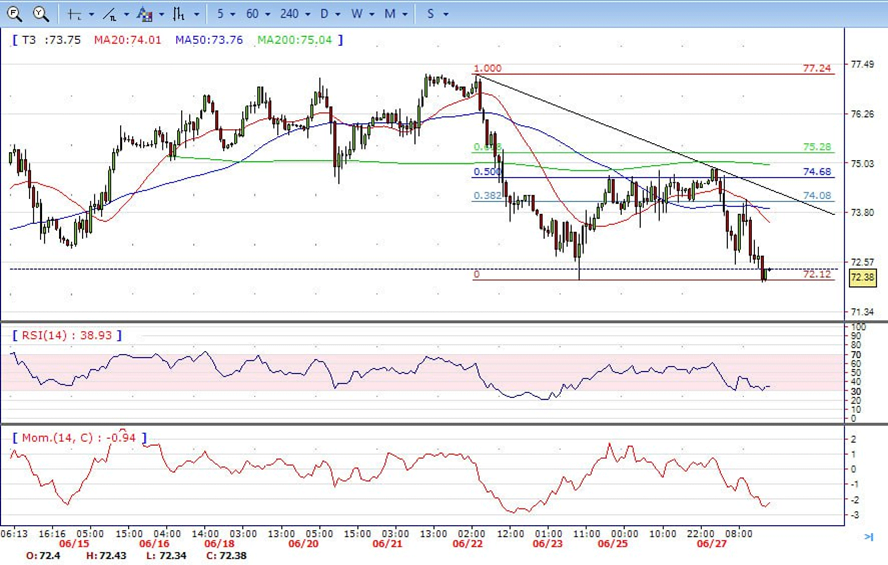
- Brent suffered big losses, tumbled from intraday high 74.90 level to low 72.08 and ended the day around 72.40, down for the day and stabilized below 20 SMA, indicates bearish sign in the hourly chart. Meanwhile, the 20 SMA continued accelerating south and developing below longer ones, indicates bears not exhausted yet. On upside, overcome 73.80 may encourage bulls to challenge 75.00, break above that level will open the gate to 76.00.
- Technical indicators suggest bearish movement, hovering below the midline. RSI stabilizes at 33, while the Momentum indicator stabilizes in negative territory, suggests downward potentials. On downside, the immediately support is 72.00, break below this level will open the gate for more decline to 71.50 area.