25/10/2022 Daily Reports
- The EUR/USD makes a U-turn, pairing some of its earlier losses, amidst a critical week for the Euro, with the European Central Bank (ECB) monetary policy meeting on Thursday. The shared currency recovery is due to some US data reporting S&P Global PMIs, which showed the US economy continues to deteriorate. The pair ended the week at around 0.9880, bullish in the daily chart.
- The US S&P Global Flash Composite for October showed that business activity in the country shrank by the fourth-consecutive month, with the Composite PMI hitting 47.3 less than estimates. The Manufacturing and Services PMI dropped, each at 49.9, less than September’s 52.0, while Services tumbled to 46.6, against 49.3 in the previous month’s reading.
- Across the pond, the Eurozone also reported PMIs for France, Germany, and the whole bloc, further cementing that the Euro area economy is headed toward a recession. The S&P Global PMI Composite fell to 47.1 from 48.1 in September, below economists’ estimates of 47.5.
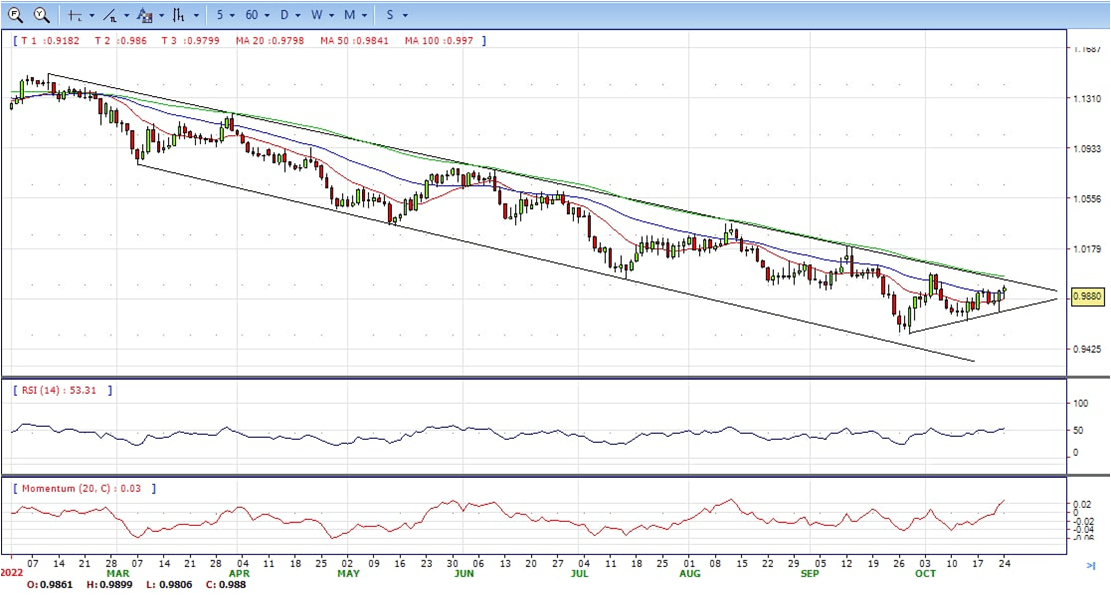
- The EUR/USD pair is trading near the 0.9880, up for the day with the neutral stance in daily chart. The pair stabilized above 20 and 50 SMA, indicates bullish strength. However, the 20 SMA continued developing below longer ones despite it started turning north, suggests bears not exhausted yet. On upside, the immediate resistance is 0.9900, break above this level will extend the advance to 1.0000.
- Technical readings in the daily chart support the neutral to bullish stances. The RSI indicators hovering near the midlines and stabilized around 54. The Momentum indicator stabilized in the positive territory, indicating upward potentials. On downside, the immediate support is 0.9800 and below this level will open the gate to 0.9700.
- The GBP/USD is hovering around 1.1300 since the American session, unable to benefit from a modestly weaker US dollar. Cable peaked after the weekly opening at 1.1410 and then pulled back to as low as 1.1271. During the last hours is has been moving between 1.1340 and 1.1275, neutral to bullish in the daily chart.
- Rishi Sunak will become UK Primer Minister after Penny Mordaunt dropped out of the Tory race on Monday. The transition from Liz Truss to Sunak could take place on Tuesday. The government announced that is up to Sunak to decide whether to announce a fiscal plan on October 31. Speaking to Tory MPs, Sunak said there will be no early election.
- The US dollar lost momentum during the American session weakened by the US S&P Global PMI preliminary October report. The Manufacturing Index dropped more than expected to the lowest level in 28 months and below the 50 level. US yields remain higher for the day despite the economic report. The 10-year yield stands at 4.25% and the 2-year at 4.51%.
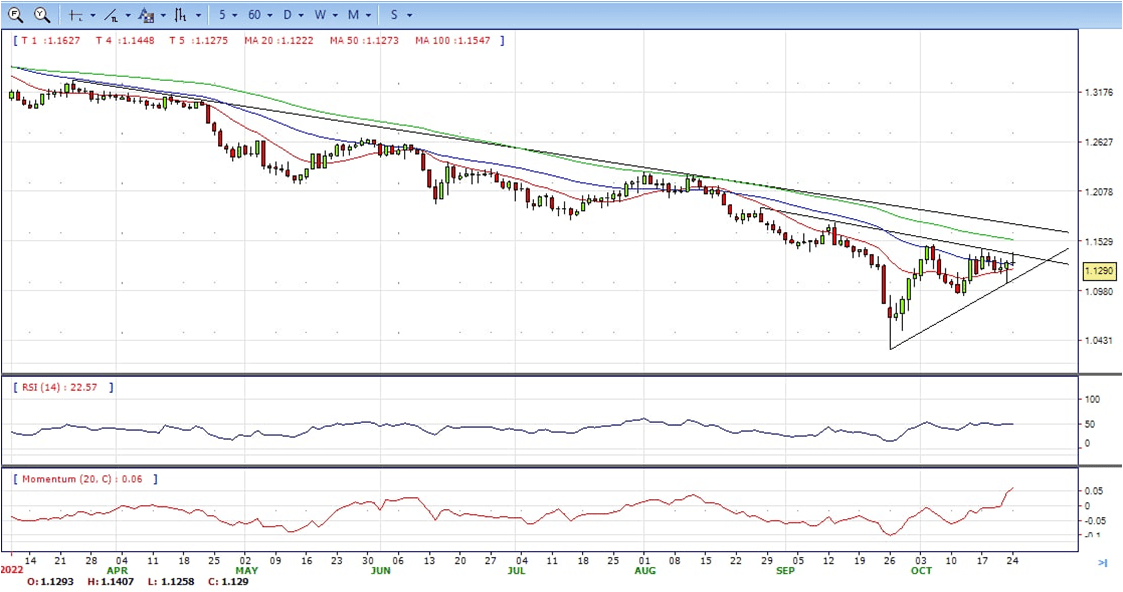
- The GBP/USD offers neutral to bullish stance in daily chart. Cable now is stabilizing above 20 and 50 SMA, indicating bullish strength in short term. However, the 20 SMA continued developing below longer ones despite it started turning north and the upside still capped by the long-term bearish trend line, suggesting bears not exhausted yet. On upside, The immediate resistance is 1.1410 with a break above it exposing to 1.1500.
- Technical readings in the daily chart support neutral to bullish stances. RSI indicator stabilized around 50, while the Momentum indicator stabilized above the midline, suggesting upward potentials. On downside, the immediate support is 1.1200, unable to defend this level will resume the decline to 1.1050.


- Gold futures have opened the week on a moderately bearish tone, giving away some of the ground taken on the sharp recovery witnessed last Friday. The yellow metal has pulled back from a 10-day high at $1,670 and got some support area at $1,640, now is trading at around $1,650, still bearish in the daily chart.
- Investors remain cautious in the week opening, awaiting the monetary policy decisions by the European Central Bank and the Bank of Canada, while stock markets are mixed. In the US, the Dow Jones and the S&P Indexes appreciate 0.8% and 0.6%, while the Nasdaq Index eases 0.1%.
- The market seems to have digested a news report published by the Wall Street Journal on Friday, suggesting that the Federal Reserve would be open to moderate its tightening cycle in December. The US dollar, as a result, has shrugged off Friday’s weakness to appreciate moderately higher which is weighing on gold prices.
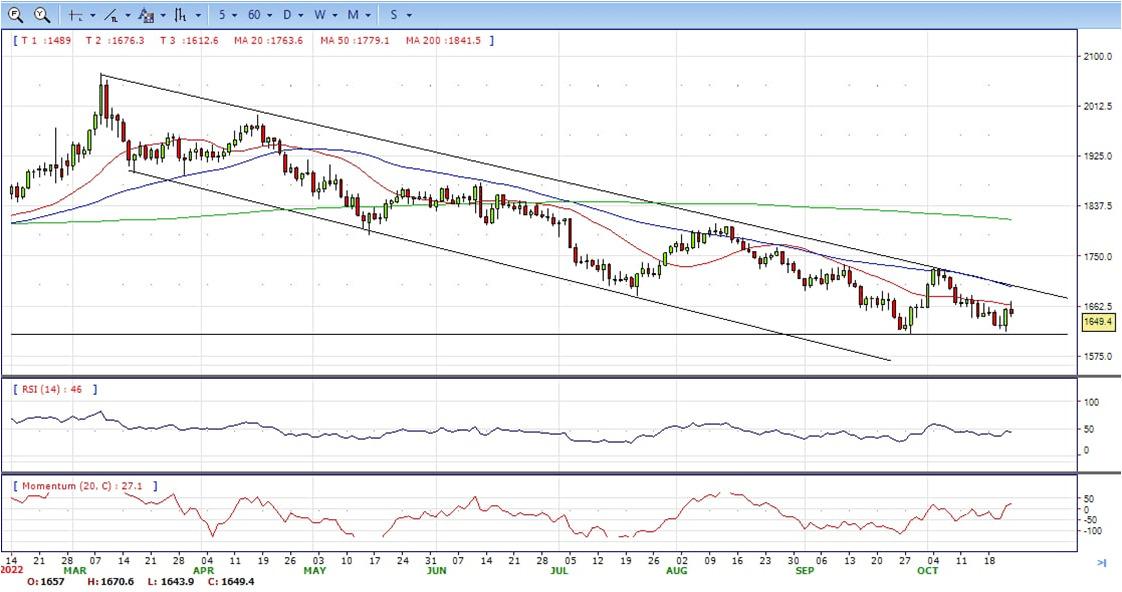
- Gold price stabilized around 1650, down for the day and bearish in the daily chart. The gold price stabilized below 20 and 50 SMA, suggesting bearish strength. Meanwhile, the 20 SMA continued developing far below longer ones despite it started turning flat, indicating bears not exhausted yet. On upside, the immediate resistance is 1670, break above this level will open the gate to extend the advance to 1685 area.
- From a technical perspective, the RSI indicator hold below the midline and stabilized around 46, suggesting bearish strength. The Momentum indicator struggled above the midline, suggests upward potentials. On downside, the immediate support is 1614, below this area may resume the decline to 1600.


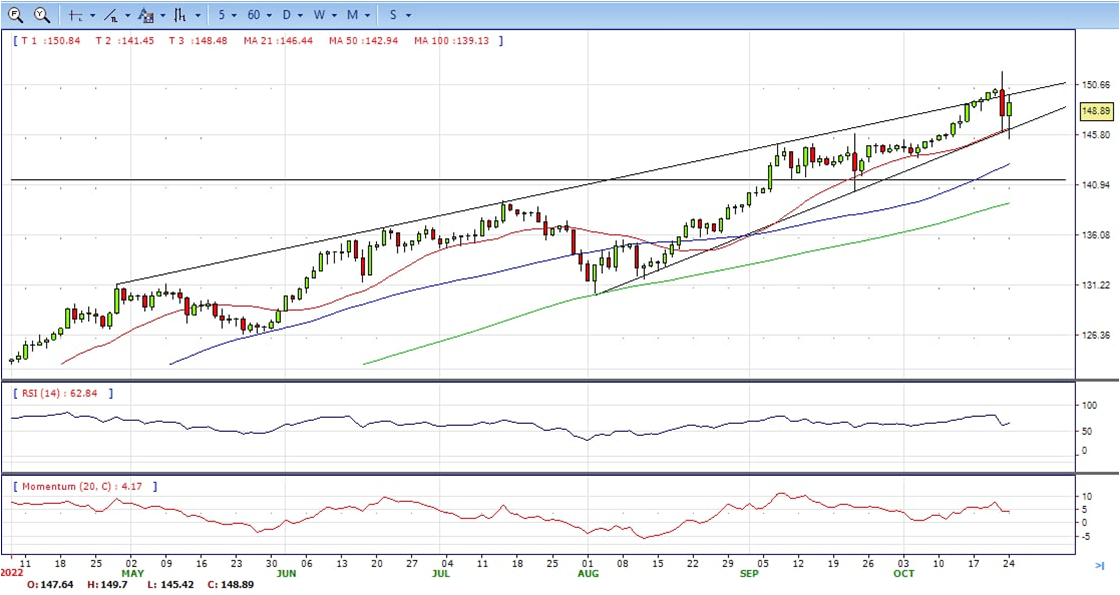
- The USD/JPY is hovering around 148.90, up more than a hundred pips for the day on another session of extreme volatility. Earlier it bottomed at 145.36, the lowest since October 10 and then rebound, being unable to regain the 149.50 area, still bullish in the daily chart.
- Japanese authorities seem to be behind the sharp moves seen in the USD/JPY earlier on Monday. More recently, the US dollar lost momentum particularly during the American session following the release of US economic data. The preliminary S&P Global Manufacturing PMI decline to 49.9 from 52 in September, the lowest level in 28 months.
- Volatility is set to remain at extreme levels with the upside in USD/JPY still being supported by the divergence between the ultra-accommodative Bank of Japan and the aggressive tightening of the Federal Reserve. The Bank of Japan Monetary Policy Committee will meet this week (decision on Friday) and the Federal Reserve will have the FOMC meeting next week (decision on Wednesday).
- The USD/JPY pair stabilized around 148.90, up for the day and bullish in the daily chart. The price still maintains the upward slope and stabilized above all main SMAs, suggests bullish strength. Meanwhile, 20 SMA continued accelerating north and developing above longer ones, indicating bulls not exhausted in the long term. On upside, overcome 152.00 may encourage bulls to challenge 153.00, break above that level will open the gate to 154.00.
- Technical indicators suggest the bullish strength. RSI stabilized around 66, while the Momentum indicator continued developing above the midline, suggests upward potentials. On downside, the immediate support is 145.30, break below this level will open the gate to 144.00 area.
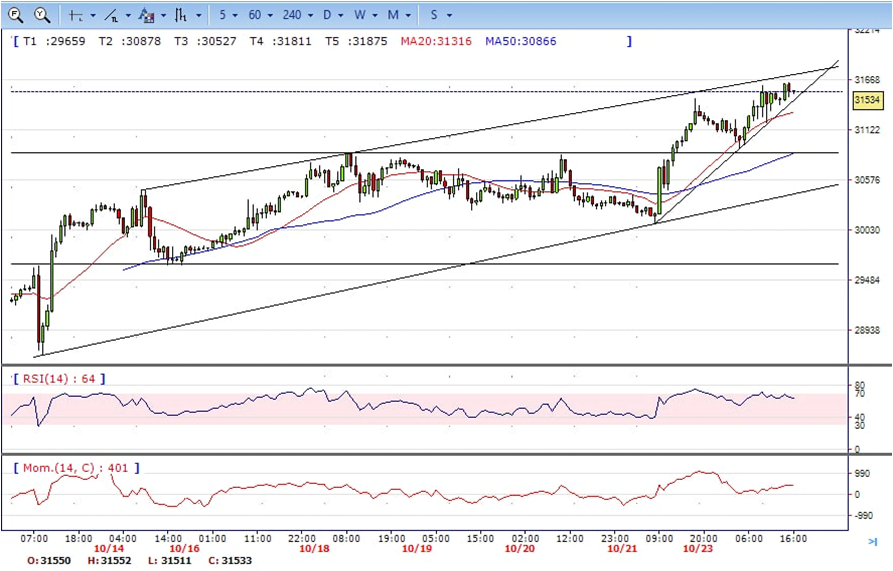
- DJI continued the advance, jumped from the intraday low 300922 area to 31639 daily high. It hold near the top to ended Monday, up for the day and bullish in the hourly chart. It stabilized above all main SMAs, suggests bullish strength. Meanwhile, 20 SMA continued accelerating north and developing above longer one, suggests bulls not exhausted yet. On upside, overcome 31700 may encourage bulls to challenge 32000, break above this level will open the gate to 32300.
- Technical indicators suggest the bullish strength. RSI stabilized around 64, while the Momentum indicator stabilized above the midline, suggests upward potentials. On downside, the immediate support is 31200, break below this level will open the gate for more decline to 30900 area.
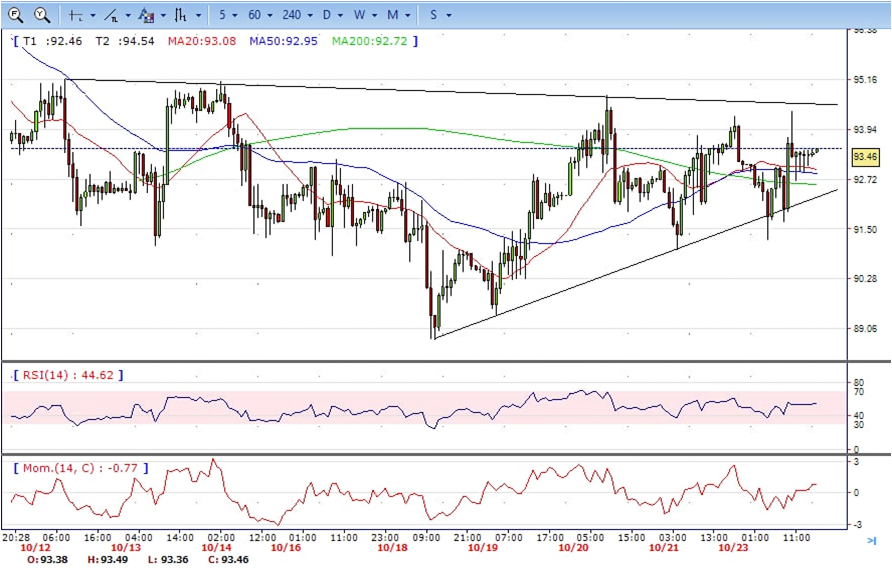
- Brent still consolidated in the familiar range , jumped from intraday low 91.24 to intraday high 94.39, it retreated modestly and ended Monday at around 93.40, unchanged for the day and bullish in the hourly chart. The price stabilized above 20 and 50 SMA, suggests bullish strength in short term. Meanwhile, the 20 SMA continued developing above longer ones despite it started turning flat, indicating bulls not exhausted yet. On upside, overcome 95.00 may encourage bulls to challenge 96.50, break above this level will open the gate to 98.60.
- Technical indicators suggest the bullish movement, hovering above the midline. RSI stabilized around 54, while the Momentum indicator stabilized in positive territory, suggests upward potentials. On downside, the immediate support is 91.00, break below this level will open the gate for more decline to 90.00 area.