25/01/2023 Daily Reports
- EUR/USD appears to have met some decent resistance in the proximity of the 1.0900 hurdle so far on Tuesday. It ended the day at around 1.0880, still bullish in the daily chart.
- Indeed, market participants appear prudent ahead of the upcoming FOMC event and the ECB gathering, both due next week and with bets favouring a 25 bps and 50 bps rate hike, respectively.
- In the domestic calendar, Consumer Confidence in Germany tracked by GfK improved to -33.9 for the month of February. Additionally, the flash prints for the Manufacturing and Services PMIs in the euro area came at 48.8 and 50.7, respectively, while the same gauges for Germany came at 47 and 50.4, respectively. In the US, the Manufacturing PMI is expected at 46.8 and the Services PMI at 46.6 in January.
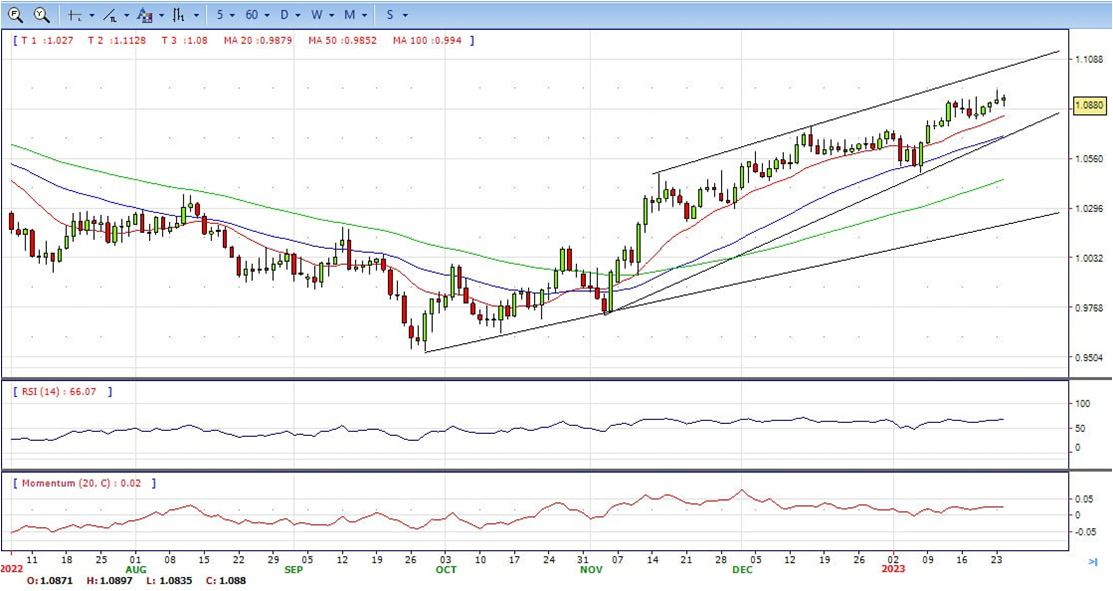
- The EUR/USD pair is trading near the 1.0880, up for the day with bullish stance in daily chart. The pair still stabilized above 20 and 50 SMA, indicates bullish strength. Meanwhile, the 20 SMA continued accelerating north and developing far above longer ones, suggests bulls not exhausted yet. On upside, the immediate resistance is 1.0930, break above this level will extend the advance to 1.1000.
- Technical readings in the daily chart support the bullish stance. The RSI indicator is above 68. The Momentum indicator stabilizes in positive territory, indicating bullish potentials. On downside, the immediate support is 1.0760 and below this level will open the gate to 1.0710.
- GBP/USD surrenders 1.2400 and drops towards the 1.2250 regions amid a mixed mood trading session, as US equities fluctuate between gainers/losers. Nevertheless, the USD is losing traction and edging lower, capping the GBP/USD’s fall. At the time of writing, the GBP/USD is trading at 1.2330 after hitting a high of 1.2413.
- Wall Street portrays a mixed picture, but it’s a matter of time before it turns positive. S&P Global reported that December’s PMIs for the US improved, with the Services PMI coming at 46.6 vs. 44.7 expected, while Manufacturing rose by 46.8 vs. estimates of 46.2. The S&P Global Composite, which measures both indices, increased by 46.6, higher than the foreseen 45 figure. Although business activity continues to show deterioration in the US economy, the downward trend moderated some.
- Across the pond, UK’s business activity disappointed investors, with business activity falling at its fastest rate in two years, according to an S&P Global/CIPS Survey. In the meantime, a Reuters Poll showed that 29 of 42 economists estimate the Bank of England to raise the Bank’s rate by 50 bps to 4% on February 2, while 13 estimated a 25 bps hike. In addition, the economists expect a peak rate of 4.25%.
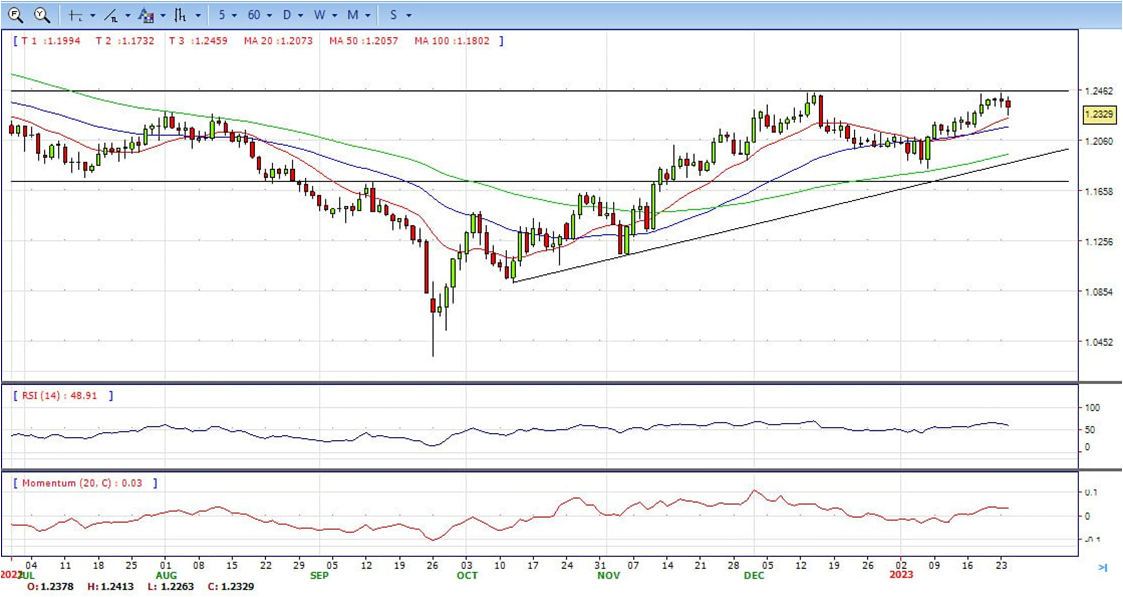
- The GBP/USD offers bullish stance in daily chart. Cable stabilizes above 20 and 50 SMA, indicating bullish strength in short term. Meanwhile, the 20 and 50 SMA continues accelerating north and developing above 200 SMA, suggests bulls not exhausted yet. On upside, The immediate resistance is 1.2450 with a break above it exposing to 1.2670.
- Technical readings in the daily chart support the bullish stances. RSI indicator stabilizes around 60, while the Momentum indicator stabilizes above the midline, suggesting upward potentials. On downside, the immediate support is 1.2250, unable to defend this level will resume the decline to 1.2150.


- Gold price struggles to continue its rally after hitting a new 9-month high at $1,942.5, retreats to the $1,930s area, as Wall Street opened low. Factors like a risk-off impulse, and the greenback erasing earlier losses, weighs on the XAU/USD. Therefore, the XAU/USD exchanges hands at $1,936 to ended the day, still bullish in the daily chart..
- The US cash equity market is poised for a lower open. The XAU/USD main driver so far in the day has been the USD, which, according to the US Dollar Index, is bottoming around 102.000, and so far is up 0.13%, at 102.150. Contrarily, US Treasury bond yields, namely the 10-year benchmark note rate, which usually influences Gold’s price, are unchanged at 3.532%.
- The US economic docket featured January’s PMIs, revealed by S&P Global, with the Services PMI coming at 46.6 vs. 44.7 expected, while Manufacturing rose by 46.8 vs. estimates of 46.2. The S&P Global Composite, which measures both indices, increased by 46.6, higher than the foreseen 45 figure. Even though US business activity remains in contractionary territory, the downward trend moderated.
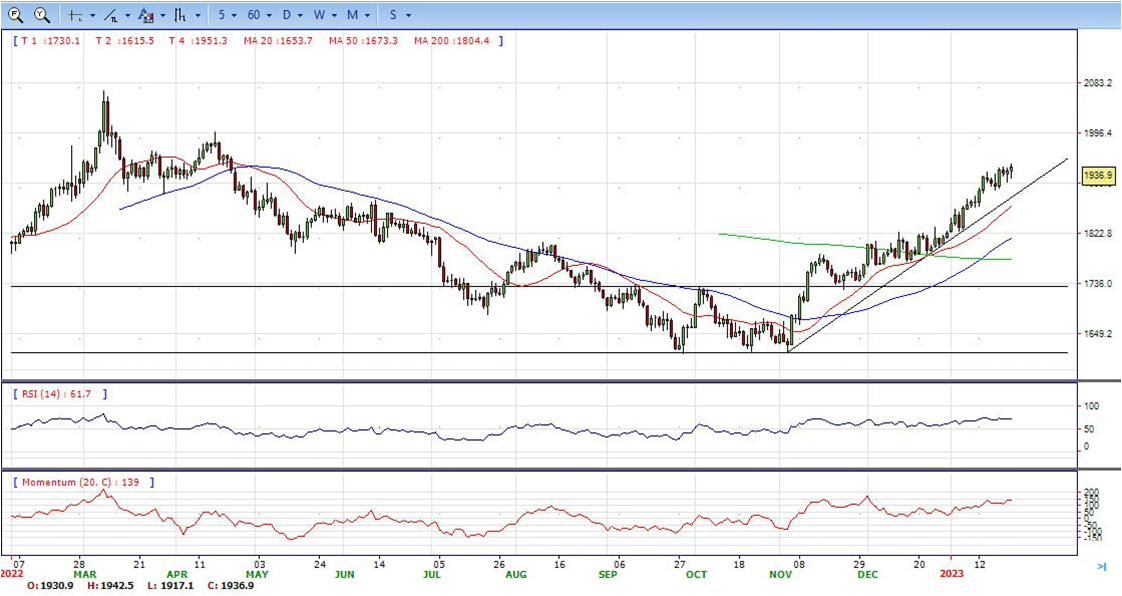
- Gold price stabilized around 1936, up for the day and bullish in the daily chart. The gold price still stabilized above 20 and 50 SMA, suggesting bullish strength in short term. Meanwhile, the 20 and 50 SMA continued accelerating north and developing above 200 SMA, indicating bulls not exhausted yet. On upside, the immediate resistance is 1943, break above this level will open the gate for more advance to 1960 area.
- From a technical perspective, the RSI indicator holds above the mid-line and stabilizes around 71, still on a bullish strength. The Momentum indicator continues developing in positive territory, suggests more upside potentials. On downside, the immediate support is 1896, below this area may resume the decline to 1868.


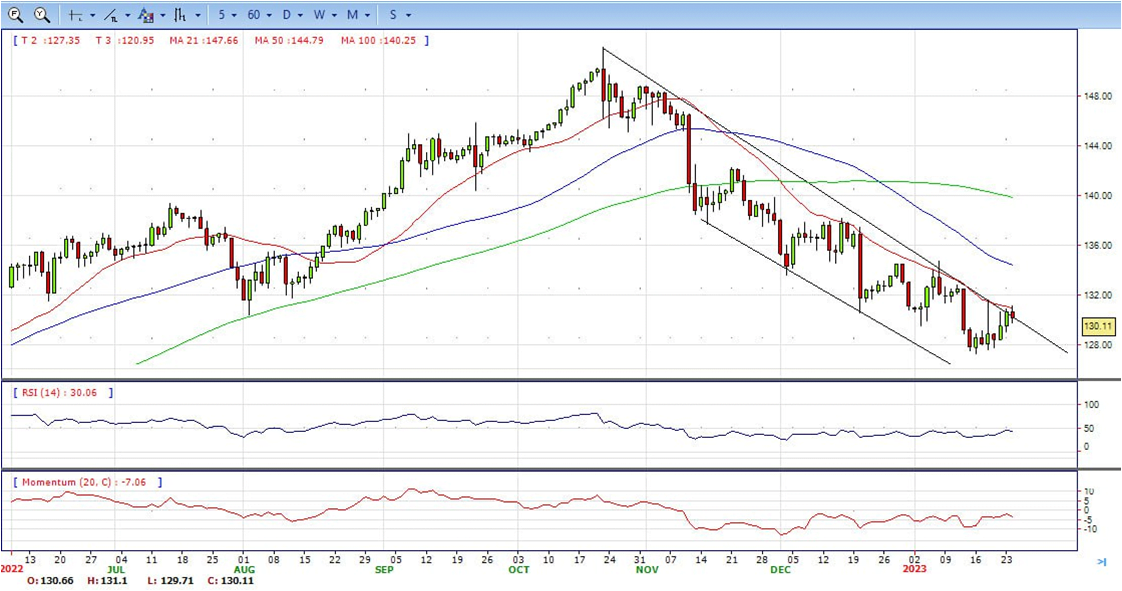
- The USD/JPY spiked to 131.21, following the release of US economic data but then pulled back toward 130.00 as stocks turned positive on Wall Street. The improvement in risk sentiment weighed on the US dollar.
- Data released on Tuesday showed the PMI S&P Global Manufacturing rose in January according to preliminary numbers from 46.2 to 46.8, above the 46.1 of market consensus. The Service index climbed from 44.7 to 46.6, surpassing expectations of 44.5. Immediately after the release, the US dollar peaked but only to retreat later.
- The US Dollar struggles to capitalize on the overnight gains and meets with a fresh supply, which, in turn, is seen dragging the USD/JPY pair lower. The markets now seem convinced that the Federal Reserve will soften its hawkish stance amid signs of easing inflationary pressures and have been pricing in a smaller 25 bps rate hike in February. This keeps a lid on the recent recovery in the US Treasury bond yields and continues to act as a headwind for the Greenback.
- The USD/JPY pair stabilized around 130.10, down for the day and bearish in the daily chart. The price maintains the downward slope and develops below all main SMAs, suggests bearish strength in short term. Meanwhile, 20 SMA continued accelerating south and developing below longer ones, indicating bears not exhausted. On upside, overcome 131.10 may encourage bulls to challenge 131.60, break above that level will open the gate to 133.00.
- Technical indicators still suggest the bearish strength. RSI fell to 44, while the Momentum indicator stabilize in negative territory, suggests downward potentials. On downside, the immediate support is 129.00, break below this level will open the gate to 128.00 area.
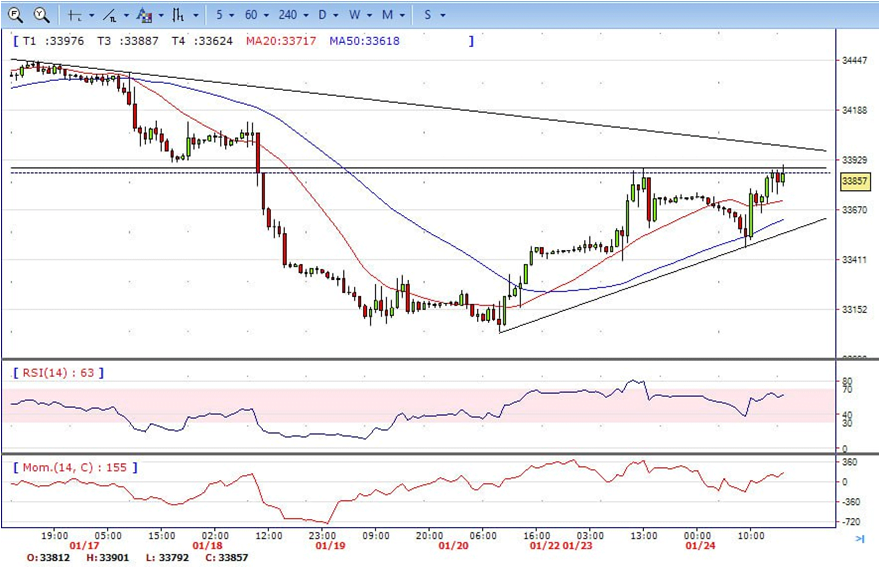
- DJI fell to low 33473 area on the first half of the day, then changed the direction to upside, climbed to high 33900 and ended Tuesday nearby, indicates bullish sign in the hourly chart. Right now market is standing above 20 and 50 SMAs, suggests a bullish strength. Meanwhile, 20 SMA continued accelerating north and heading towards 200 SMA, suggests bulls not exhausted yet. On upside, overcome 33900 may encourage bulls to challenge 34130, break above that level will open the gate to 34500.
- Technical indicators also suggest the bullish movement, developing above the mid-line. RSI stabilized around 64, while the Momentum indicator hovering far above the mid-line, suggests upside potentials. On downside, the immediately support is 33400, break below this level will open the gate for more decline to 33000 area.
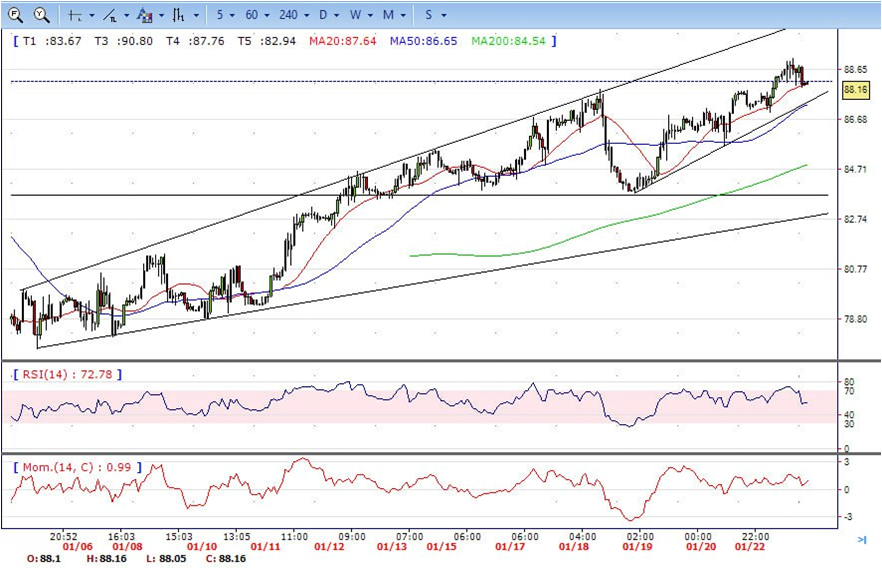
- The Brent under the sell pressure on Tuesday. It fell from high 88.70 area to low 85.81. It hold near the bottom and ended the day around 86.25 The price stabilizes below 20 and 50 SMA, suggests bearish strength in the hourly chart. Meanwhile, the 20 SMA continued accelerating south and heading towards longer ones, indicates bears not exhausted yet. On upside, overcome 89.20 may encourage bulls to challenge 90.50, break above that level will open the gate to 92.00.
- Technical indicators also suggest bearish movement, hovering below the midline. RSI drops to 35, while the Momentum index is well below the midline, suggests downward potentials. On downside, the immediately support is 85.60, break below this level will open the gate for more decline to 83.70 area.