24/11/2022 Daily Reports
- The EUR jumped against the US Dollar USD following the release of the Federal Reserve (Fed) monetary policy minutes showed that policymakers agreed to slow the pace of rate hikes at the Federal Reserve’s (Fed) November meeting. At the time of writing, the EUR/USD is volatile, trading at around 1.0400.
- As mentioned above, Fed officials agreed to slow the rate hikes spurred US Dollar weakness, as the EUR/USD advanced towards its daily high of 1.0400. Furthermore, policymakers expressed that monetary policy is approaching a “sufficiently restrictive” level, acknowledging that the Federal Funds rate (FFR) peak is more important than the rate itself.
- Officials expressed a high level of uncertainty about the peak of the FFR. However, several predicted interest rates would peak at a higher level, as the Federal Reserve Chairman Jerome Powell expressed at the monetary policy press conference. In the meantime, money market interest-rate futures odds for a 50 bps hike increased to 79% in the December meeting after the release of the FOMC minutes.
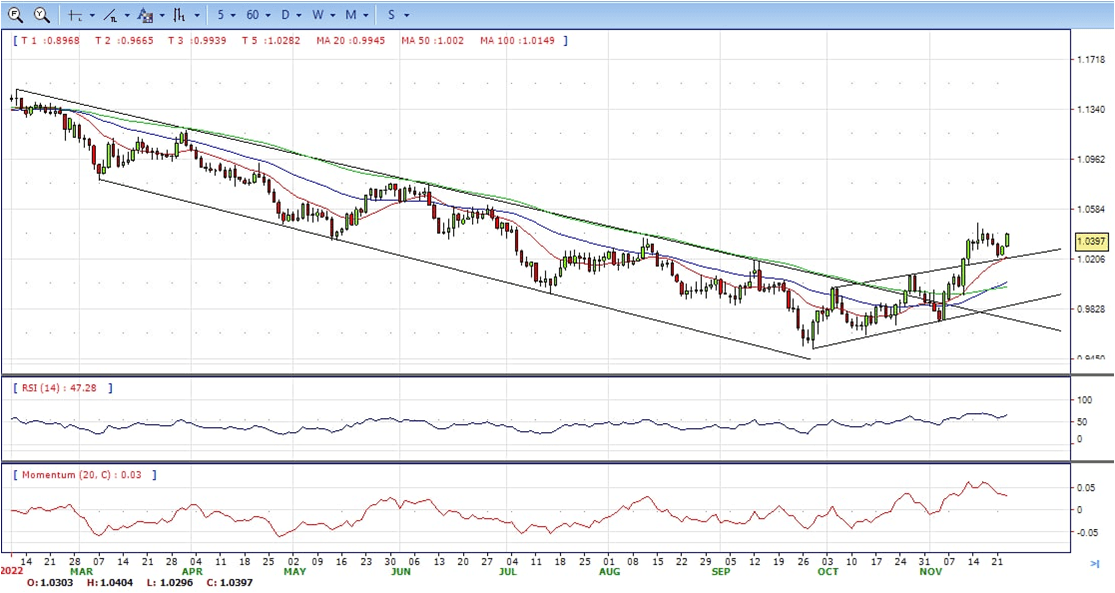
- The EUR/USD pair is trading near the 1.0400, up for the day with bullish stance in daily chart. The pair stabilized above 20 and 50 SMA, indicates bullish strength. Meanwhile, the 20 SMA continued accelerating north and developing above longer ones, suggests bulls not exhausted yet. On upside, the immediate resistance is 1.0400, break above this level will extend the advance to 1.0480.
- Technical readings in the daily chart support the bullish stances. The RSI indicators hovering above the midline and stabilized around 66. The Momentum indicator stabilized above the midline, indicating upward potentials. On downside, the immediate support is 1.0300 and below this level will open the gate to 1.0200.
- The Pound Sterling is rallying back above 1.2000 after the release of mixed economic data out of the (US, weighed on the US Dollar (USD). At the same time, a risk-on impulse keeps European and US equities trading with gains after the release of the Fed last meeting minutes. At the time of writing, the GBP/USD is trading at 1.2060 after hitting a daily low of 1.1872.
- Data released from the US came mixed, undermining the US Dollar. The University of Michigan (UoM) Consumer sentiment came at 56.9, above estimates but below the preliminary reading of November. Delving into the report, 1-year inflation expectations were lowered from 5.1% to 4.9%, while the 5-10 year horizon remained unchanged at 3.0%. Meanwhile, US New Home Sales surprisingly jumped to 632K from 570K, even though higher mortgage rates, nearly 7%, were sparked by the Federal Reserve tightening monetary conditions,
- Data revealed during the European session showed that the UK S&P Global/CIPS PMIs were unchanged, at contractionary territory, further cementing the case of an economic contraction. After the Bank of England (BoE) revealed its latest monetary policy report, policymakers expressed that the UK was already in a recession.
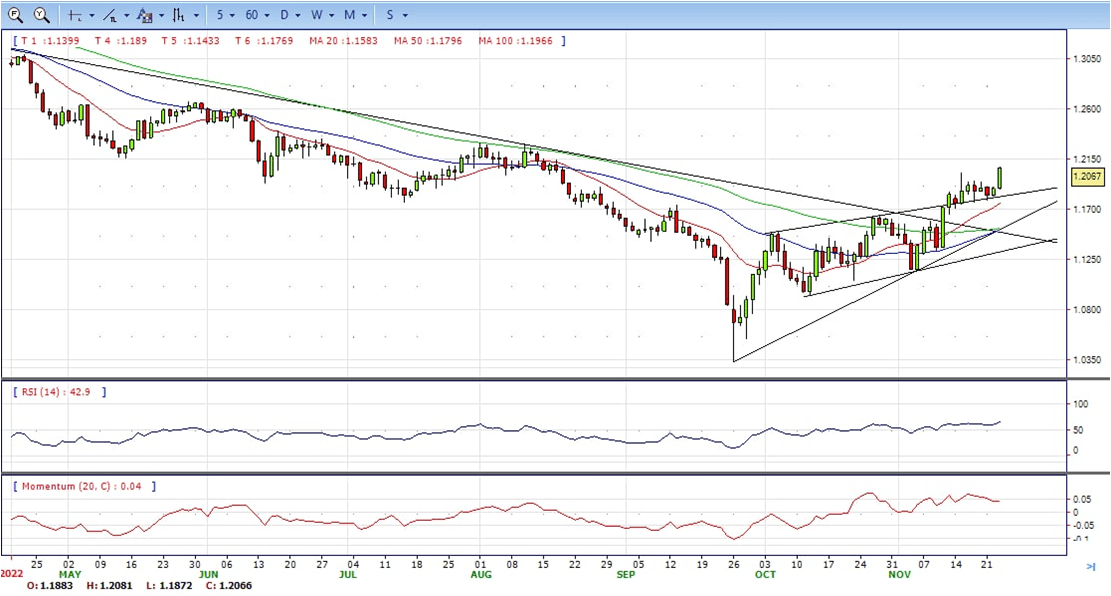
- The GBP/USD offers bullish stance in daily chart. Cable still stabilized above all main SMAs, indicating bullish strength in short term. Meanwhile, the 20 SMA continued accelerating north and developing above longer ones, suggests bulls not exhausted yet. On upside, The immediate resistance is 1.2150 with a break above it exposing to 1.2300.
- Technical readings in the daily chart support the bullish stances. RSI indicator stabilized around 65, while the Momentum indicator stabilized above the midline, suggesting upward potentials. On downside, the immediate support is 1.2000, unable to defend this level will resume the decline to 1.1900.


- Gold had rallied to a high of $1,753 on the back of a dovish set of Federal Open Market Committee minutes but has since come off to test below $1,750 again and is oscillating between the range of the move. Thanksgiving holidays are upon us which likely means there are fewer participants around the event.
- Nevertheless, the minutes show that a substantial majority of participants at the November meeting judged a slowing in the pace of the interest rate hikes would likely still be appropriate. In other key statements, the minutes showed that a slower pace of rate hikes would better allow the FOMC to assess progress toward its goals given the uncertain lags around monetary policy. A few participants said slowing the pace of rate hikes could reduce the financial system risks; others that slowing should await more progress on inflation.
- Prior to the event, the US PMI data had given the US Dollar bears a head start before the FOMC minutes were released. A slew of US economic data (including durable goods orders, PMIs, claims, new home sales, and final Michigan sentiment), for the most part, was solid but the emphasis was put on the shocking result in the US Manufacturing PMI that missed expectations by a mile.
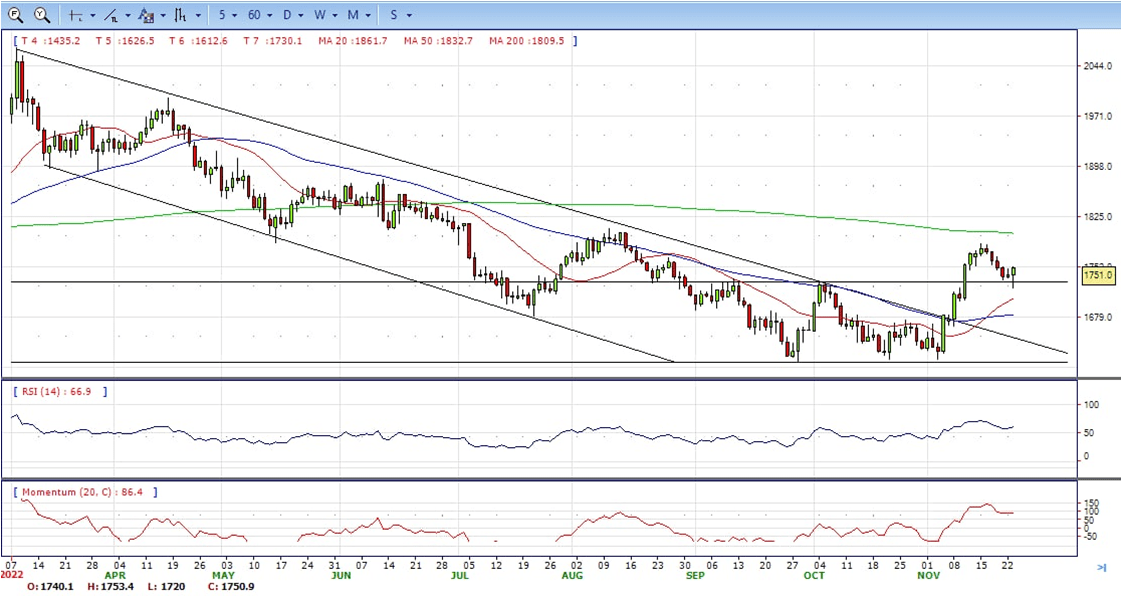
- Gold price stabilized around 1750, up for the day and bullish in the daily chart. The gold price still stabilized above 20 and 50 SMA, suggesting bullish strength. Meanwhile, the 20 SMA continued accelerating north and developing above longer ones, indicating bulls not exhausted yet. On upside, the immediate resistance is 1787, break above this level will open the gate to extend the advance to 1800 area.
- From a technical perspective, the RSI indicator hold above the midline and stabilized around 61, suggesting bullish strength. The Momentum indicator stabilized above the midline, suggests upward potentials. On downside, the immediate support is 1730, below this area may resume the decline to 1700.


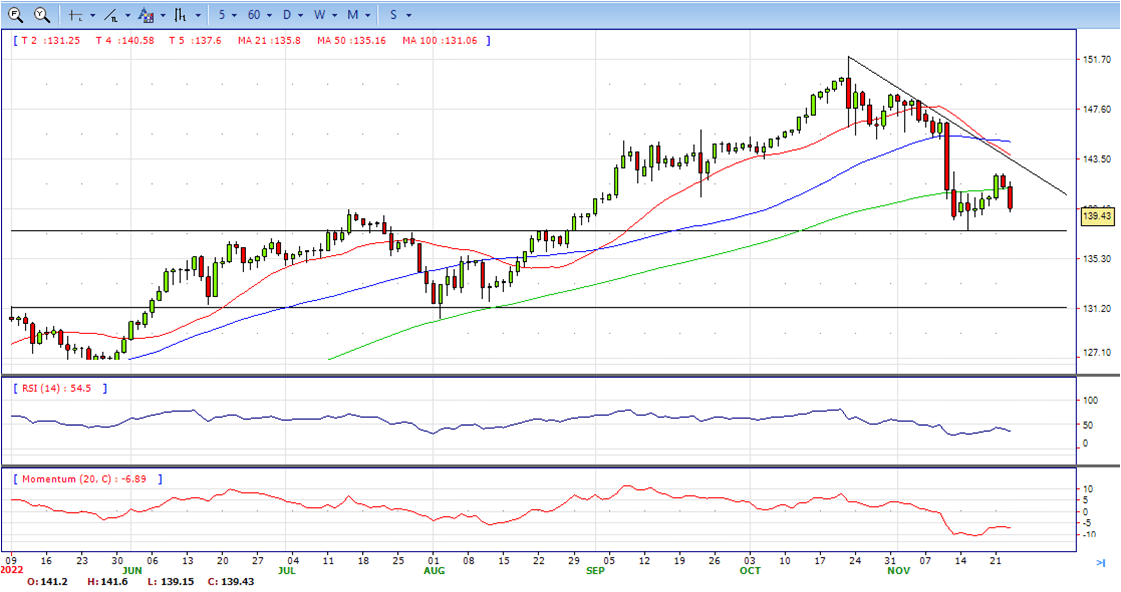
- The USD/JPY is falling for the second day in a row on Wednesday after the FOMC minutes. The pair continues to pull back after hitting the highest level in two weeks above 142.00 on Monday. Recently the pair printed a fresh daily low at 139.16 and it remains near the lows, with a bearish bias.
- The Greenback came under selling pressure on Wednesday and finished the day sharply down against all of its major rivals. The American Dollar got hit by poor growth-related data and dovish US FOMC Meeting Minutes.
- The document showed that most participants agreed that, despite the risk to the inflation outlook remaining skewed to the upside, a slower pace of interest rate hikes would be appropriate soon. Furthermore, they believe the monetary policy is approaching a “sufficiently restrictive” level. The US Dollar fell further as an immediate reaction to the news, while US indexes picked up an upward pace. Chances of a 50 bps hike rose to 79% following the release and according to Fedwatch, while the terminal rate is now seen at 5.03%.
- The USD/JPY pair stabilized around 139.45, down for the day and bearish in the daily chart. The price still maintains the downward slope and develops below all main SMAs, suggests bearish strength in short term. Meanwhile, 20 SMA continued accelerating south and heading towards longer ones, indicating bears not exhausted. On upside, overcome 140.00 may encourage bulls to challenge 141.00, break above that level will open the gate to 141.60.
- Technical indicators suggest the bearish strength. RSI stabilized around 37, while the Momentum indicator continued developing below the midline, suggests downward potentials. On downside, the immediate support is 139.00, break below this level will open the gate to 137.60 area.
- DJI consolidates in the familiar range, trades between 34000 to 34280 range and ends Wednesday at around 34210, up for the day and bullish in the hourly chart. The price stabilized above all main SMAs, suggests bullish strength. Meanwhile, 20 continued accelerating north and developing above longer ones, suggests bulls not exhausted yet. On upside, overcome 34330 may encourage bulls to challenge 34600, break above this level will open the gate to 34800.
- Technical indicators suggest the bullish strength. RSI stabilized around 61, while the Momentum indicator stabilized above the midline, suggests upward potentials. On downside, the immediate support is 34000, break below this level will open the gate for more decline to 33800 area.

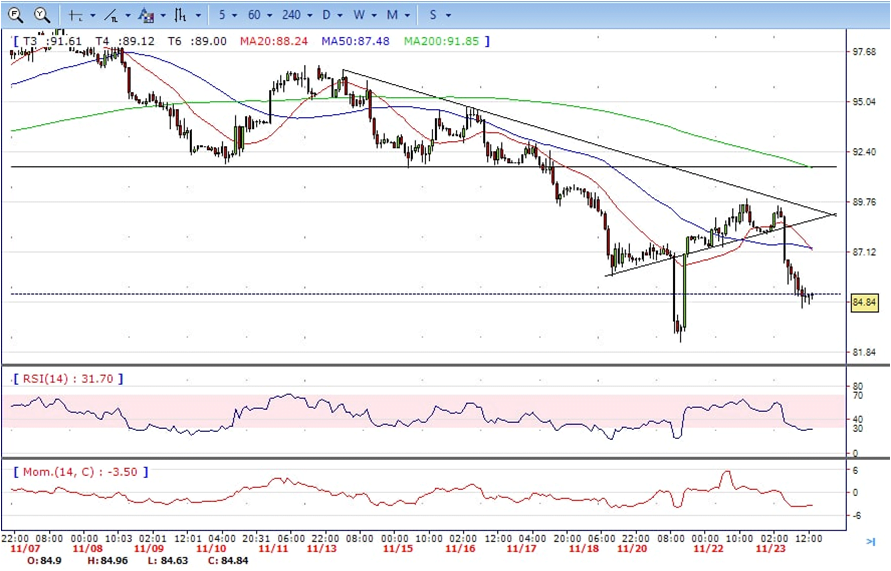
- Brent under the strong sell pressure, slumped from intraday high 89.50 to intraday high 84.12 area, it bounced modestly on the last hour of US session and ended Wednesday at around 84.85, down for the day and bearish in the hourly chart. The price stabilized below 20 and 50 SMA, suggests bearish strength in short term. Meanwhile, the 20 SMA continued accelerating south and heading towards 50 SMA, indicating bearish bias. On upside, overcome 86.00 may encourage bulls to challenge 88.00, break above this level will open the gate to 90.00.
- Technical indicators suggest the bearish movement, hovering below the midline. RSI stabilized at around 28, while the Momentum indicator stabilized below the midline, suggests downward potentials. On downside, the immediate support is 84.00, break below this level will open the gate for more decline to 82.40 area.