24/04/2023 Daily Reports
- The EUR/USD prepares to finish the week on a higher note, though it remains below the 1.1000 figure, albeit economic data from the US bolstered the USD. However, late into the Wall Street close, the greenback lost strength, US equities rose, and the Euro recovered some ground. Hence, the EUR/USD is trading at 1.0985 after reaching a low of 1.0937.
- Sentiment across the New York session fluctuated between risk-on/off. Investors’ recessionary fears about the US were pushed away by April’s S&P Global PMI figures, which showed the economy’s resilience, despite the US Fed 475 bps of tightening. Manufacturing and Services PMIs exceeded estimates, with the former at 50.4, above 49 expectations, while the latter jumped to 53.7 from 51.5 estimates. Therefore, the Composite Index aimed higher to 53.5.
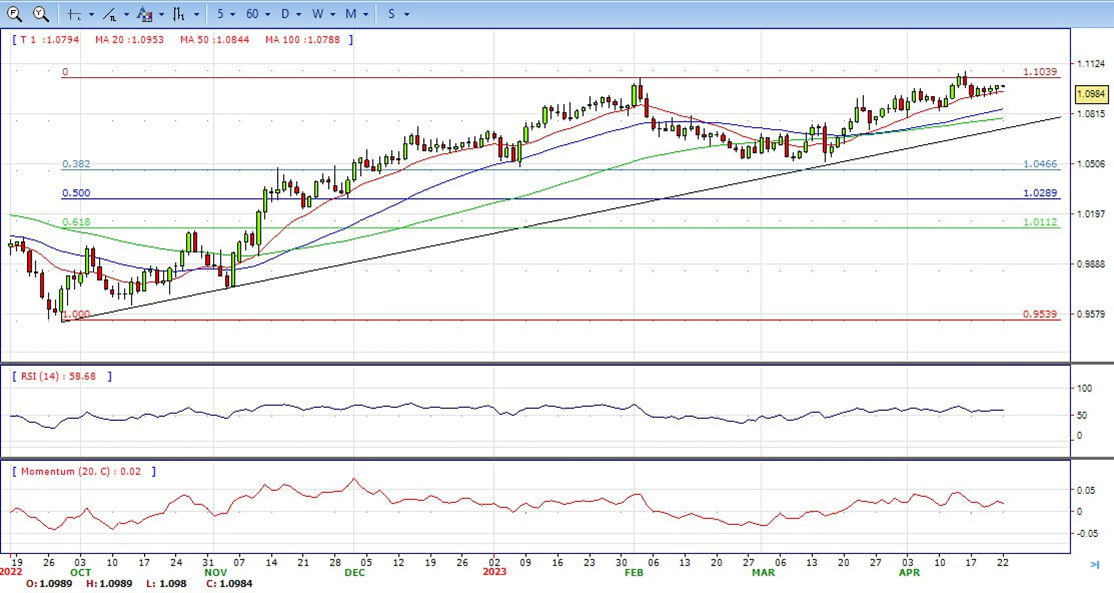
- The EUR/USD pair is trading near the 1.0985, modestly up for the day with bullish stance in daily chart. The pair stabilized above 20 and 50 SMA, indicates bullish strength. Meanwhile, the 20 SMA continued accelerating north and heading towards 50 and 200 SMA, suggests bulls not exhausted yet. On upside, the immediate resistance is 1.1000, break above this level will extend the advance to 1.1070.
- Technical readings in the daily chart support the bullish stance. The RSI indicator stabilizes around 59. The Momentum indicator holds above the midline, indicating bullish potentials. On downside, the immediate support is 1.0900 and below this level will open the gate to 1.0830.
- The GBP/USD pair stalls its intraday decline near the 1.2375 region and recovers over 70 pips from a three-day low touched earlier this Friday. Spot prices, however, unchanged through the North American session and currently trade around the 1.2440 area.
- The British Pound weakens across the board following the disappointing UK macro releases, which, along with an intraday USD uptick, exert some downward pressure on the GBP/USD pair. In fact, the UK Office for National Statistics reported that domestic Retail Sales contracted by 0.9% in March and sales excluding fuel dropped by 1% during the reported month, both missing consensus estimates. Adding to this, the flash UK Manufacturing PMI delivers a negative surprise and drops further into contraction territory, to 46.6 in April, offsetting the better-than-expected Services PMI, which rose to 54.9 in April.
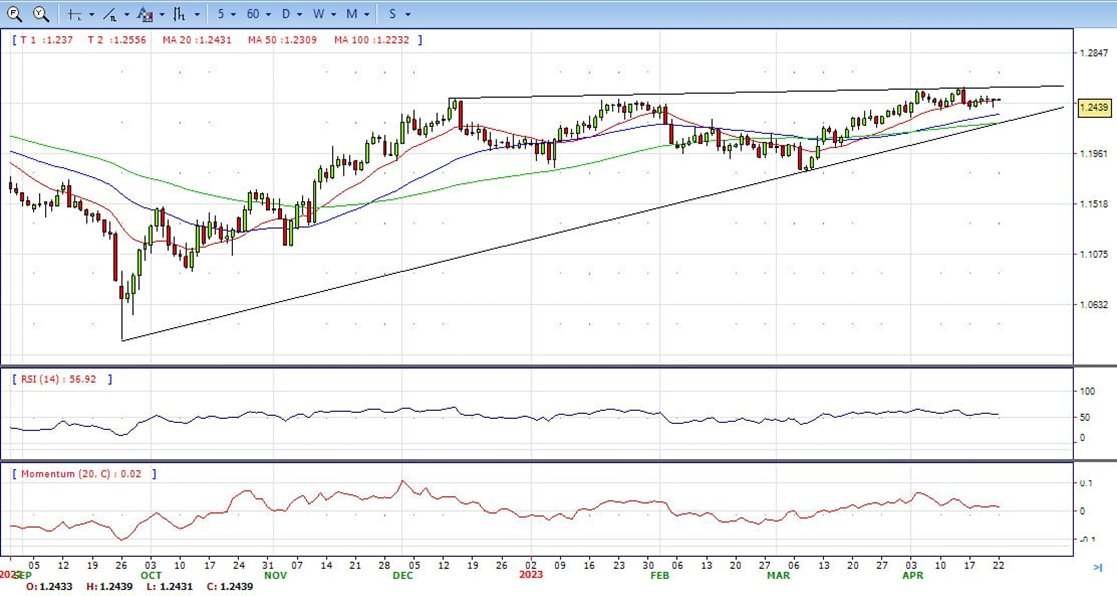
- The GBP/USD offers bullish stance in daily chart. Cable stabilizes above 20 and 50 SMA, indicating bullish strength in short term. Meanwhile, the 20 SMA continued accelerating north and developing far above longer ones, suggests bulls not exhausted yet. On upside, the immediate resistance is 1.2470 with a break above it exposing to 1.2550.
- Technical readings in the daily chart support the bullish stances. RSI indicator stabilizes around 56, while the Momentum indicator stabilizes above the midline, suggesting upward potentials. On downside, the immediate support is 1.2340, unable to defend this level will resume the decline to 1.2270.


- Gold price plunges below $2,000 and hit a daily low of $1,971.74 after the release of economic data from the United States (US) showed that the economy continues to expand, despite recent reports flashing a recession. Therefore, XAU/USD is trading at $1,983, losses 1.07%, at the time of writing.
- S&P Global reported the final PMI readings for the US, which surprised most investors, which were caught off guard, as shown by the market’s reaction. The S&P Global Manufacturing PMI was 50.4, above 49 estimates, while the Services rose to 53.7, exceeding the consensus of 51.5. Therefore, the Composite reading was 53.5, above its previous reading.
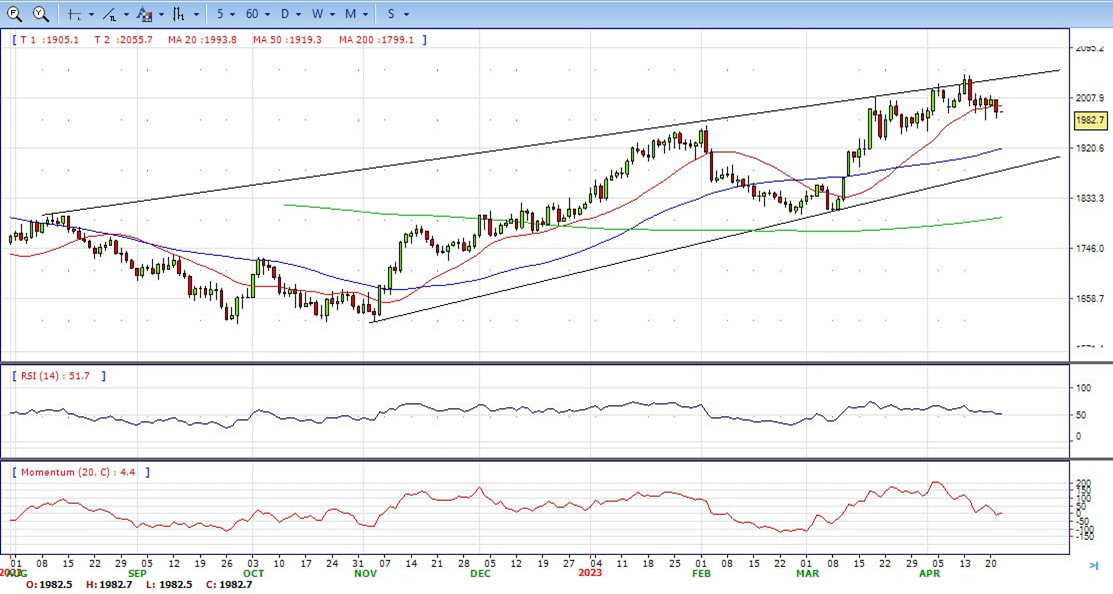
- Gold price stabilized around 1983, down for the day and neutral in the daily chart. The gold price stabilizes below 20 SMA for the first time since March 10, suggesting bearish strength in short term. Meanwhile, the 20 SMA started turning flat but continued developing far above 50 and 200 SMA, indicates bulls not exhausted yet. On upside, the immediate resistance is 2015, break above this level will open the gate for more advance to 2032 area.
- From a technical perspective, the RSI indicator holds above the mid-line and stabilizes around 52, on a bullish strength. The Momentum indicator hold near the midline, suggests directionless potentials. On downside, the immediate support is 1969, below this area may resume the decline to 1950.


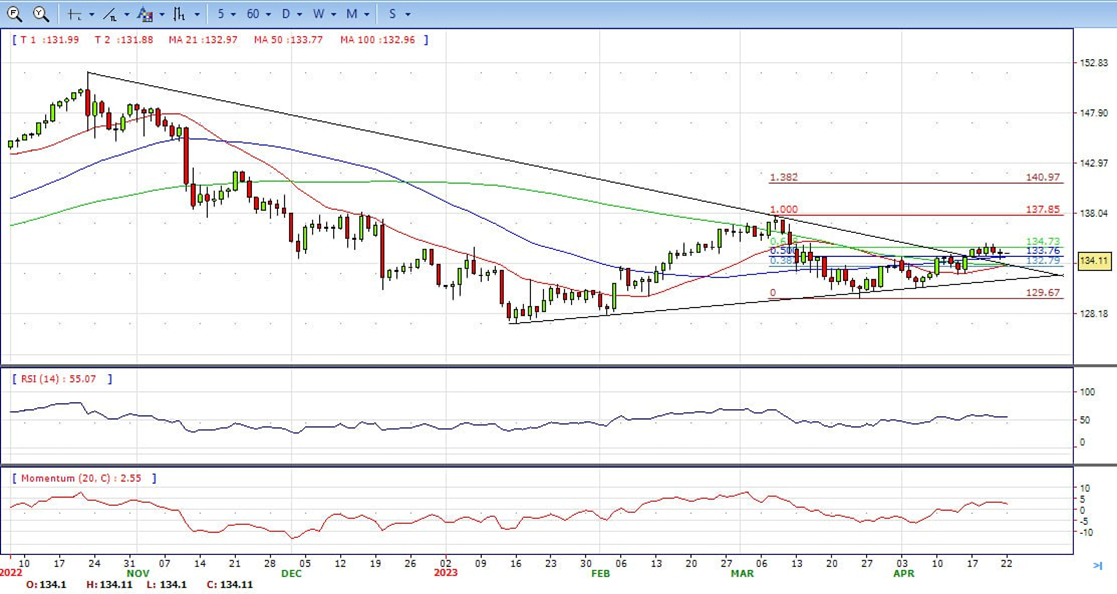
- The USD/JPY pair attracts some dip-buying in the vicinity of the 133.55 region during the early North American session and recovers its early lost ground to the weekly low. Spot prices touch a fresh daily peak, around the 134.30 region, and for now, seem to have stalled this week’s retracement slide from the highest level since mid-March.
- The US Dollar jumps back closer to the weekly high following the release of the US PMI prints, which, in turn, is seen as a key factor pushing the USD/JPY pair higher. In fact, S&P Global reported this Friday that business activity in the US private sector expanded at a strengthening pace in April, with the Composite PMI rising to 53.5 from 52.3 in March. Adding to this, the gauge for the manufacturing moves in the expansion territory and comes in at 50.4, while Services PMI edges higher to 53.7, also surpassing consensus estimates.
- The USD/JPY pair stabilized around 134.10, slightly down for the day and bullish in the daily chart. The price stabilizes above 20 and 50 SMA, suggests bullish strength in short term. However, 20 SMA started turning flat but continued developing below longer ones, indicating bears not exhausted. On upside, overcome 135.15 may encourage bulls to challenge 137.00, break above that level will open the gate to 138.00.
- Technical indicators suggest the bullish strength. RSI stabilizes around 55, while the Momentum indicator stabilizes above the midline, suggests upward potentials. On downside, the immediate support is 133.50, break below this level will open the gate to 132.00 area.
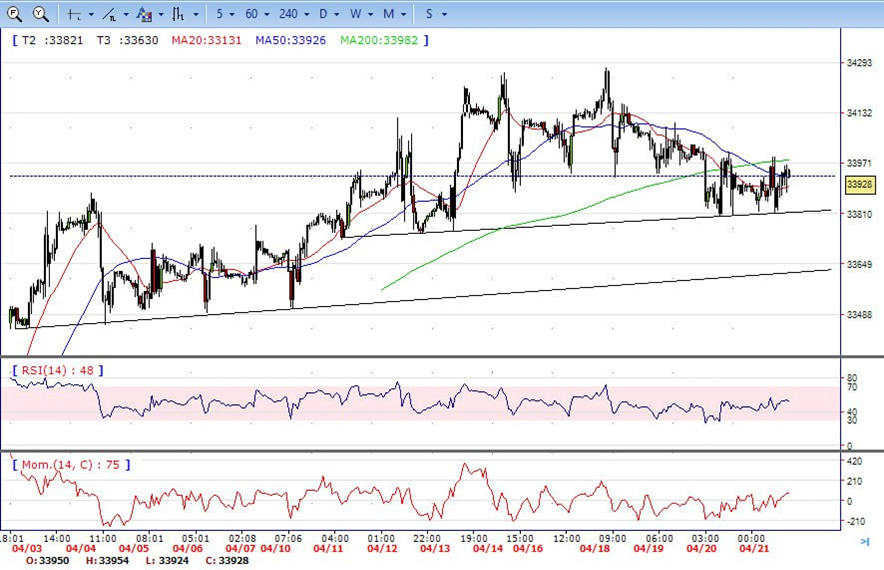
- DJI fluctuated in the familiar range on Friday, traded between 33800 low to 34000 high, unchanged for the day and indicates neutral to bullish sign in the hourly chart. Right now market is standing above 20 and 50 SMA, suggests bullish strength. Meanwhile, 20 SMA started turning north and developing towards longer ones, suggests bulls not exhausted yet. On upside, overcome 34000 may encourage bulls to challenge 34280, break above that level will open the gate to 34410.
- Technical indicators suggest the bullish movement. RSI stabilizes around 53, while the Momentum indicator stabilizes above the midline, suggests upward potentials. On downside, the immediately support is 33730, break below this level will open the gate for more decline to 33450 area.
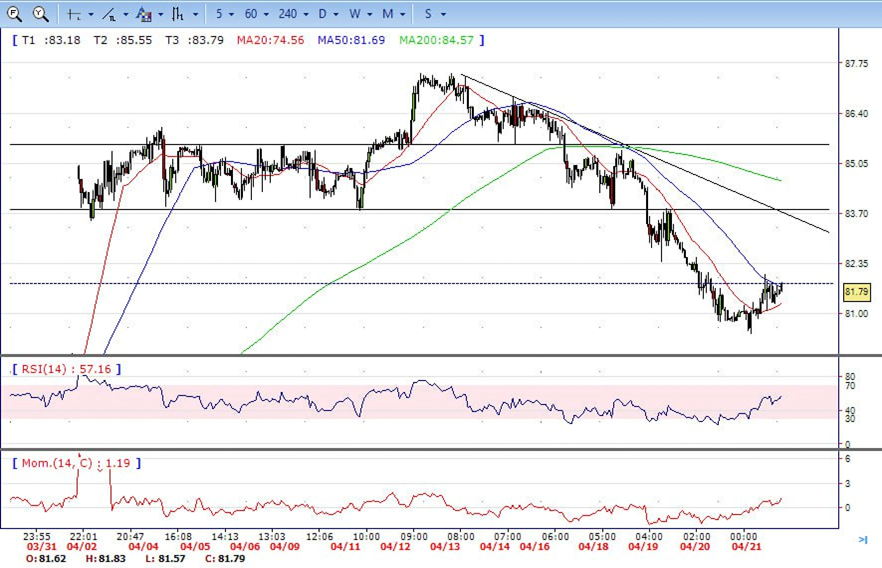
- Brent still under the sell pressure on the first half of the day, tumbled to intraday low 80.45 and bounced from here to 81.80 to end the week, up for the day and indicates bullish sign in the hourly chart. Meanwhile, the 20 SMA started turning north and heading towards longer ones, indicates bulls not exhausted yet. On upside, overcome 82.50 may encourage bulls to challenge 83.80, break above that level will open the gate to 85.50.
- Technical indicators also suggest bullish movement, hovering above the midline. RSI stabilizes at 56, while the Momentum indicator stabilizes in positive territory, suggests upward potentials. On downside, the immediately support is 80.40, break below this level will open the gate for more decline to 78.40 area.