21/04/2023 Daily Reports
- EUR/USD advances, trimming some of its Wednesday’s losses after data from the United States displays further economic deterioration, which reignited recession fears. Hence, investors seeking safety bought the Euro to the detriment of the US Dollar. The EUR/USD trades at 1.0960, above its opening price by 0.05%.
- The US economic calendar revealed that Initial Jobless Claims for the week ending on April 15 rose by 245K, exceeding estimates of 240K, as data from the Department of Labor showed. At the same time, the Philadelphia Fed reported that manufacturing activity decelerated in the mid-Atlantic region, with the manufacturing index plunging -31.3 beneath March’s -23.3, a headwind for the American Dollar.
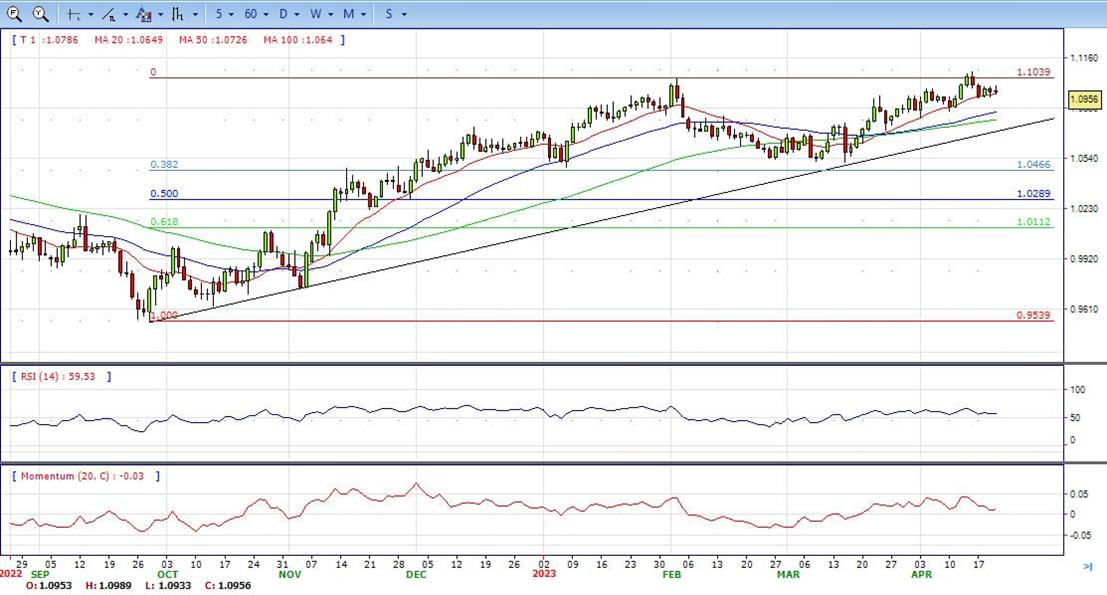
- The EUR/USD pair is trading near the 1.0960, modestly up for the day with bullish stance in daily chart. The pair stabilized above 20 and 50 SMA, indicates bullish strength. Meanwhile, the 20 SMA continued accelerating north and heading towards 50 and 200 SMA, suggests bulls not exhausted yet. On upside, the immediate resistance is 1.1000, break above this level will extend the advance to 1.1070.
- Technical readings in the daily chart support the bullish stance. The RSI indicator stabilizes around 57. The Momentum indicator holds above the midline, indicating bullish potentials. On downside, the immediate support is 1.0900 and below this level will open the gate to 1.0830.
- GBP/USD is up 0.13% at the time of writing and has travelled between a low of 1.2392 and 1.2475 while data today confirmed that Britain has the highest inflation in Western Europe, solidifying the consensus that the Bank of England’s meeting in May will result in a rate hike.
- Data on Thursday revealed that the United Kingdom´s inflation is far more persistent and the highest in Western Europe. Headline inflation dropped to 10.1% in March from February’s 10.4%. However, this was above expectations for the forecasted drop to 9.8%. The Office for National Statistics showed price pressures all over and has raised the prospect of the Bank of England having to raise rates more than previously expected.
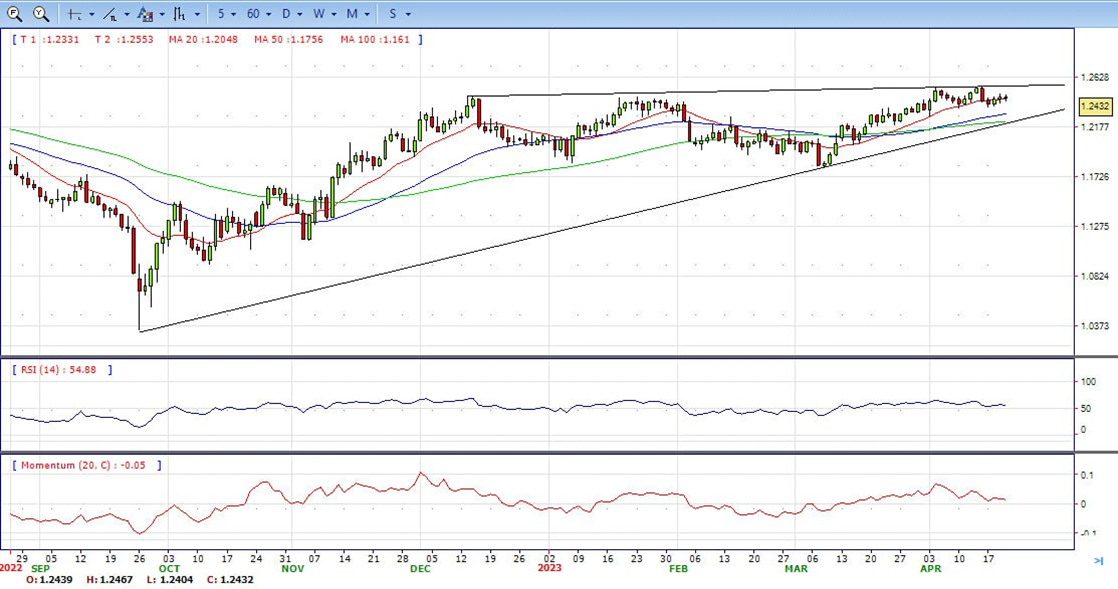
- The GBP/USD offers bullish stance in daily chart. Cable stabilizes above 20 and 50 SMA, indicating bullish strength in short term. Meanwhile, the 20 SMA continued accelerating north and developing far above longer ones, suggests bulls not exhausted yet. On upside, the immediate resistance is 1.2470 with a break above it exposing to 1.2550.
- Technical readings in the daily chart support the bullish stances. RSI indicator stabilizes around 55, while the Momentum indicator stabilizes above the midline, suggesting upward potentials. On downside, the immediate support is 1.2340, unable to defend this level will resume the decline to 1.2270.


- Gold price climbs and reclaims the $2,000 after traveling towards weekly lows on Wednesday at $1,969.34, though economic data from the US bolstered the yellow-metal. In addition, US bond yields are falling, weakening the USD. At the time of typing, the XAU/USD is trading at $2,004, above its opening price by 0.5%.
- Risk aversion is the game’s name, even though the CBOE Volatility Index remains below 17.00. Wall Street remains pressured after the US Bureau of Labor Statistics (BLS) revealed that unemployment claims rose. Initial Jobless Claims for the latest week rose by 245K, exceeded estimates of 240K, and weighed on US bond yields, a tailwind for Gold.
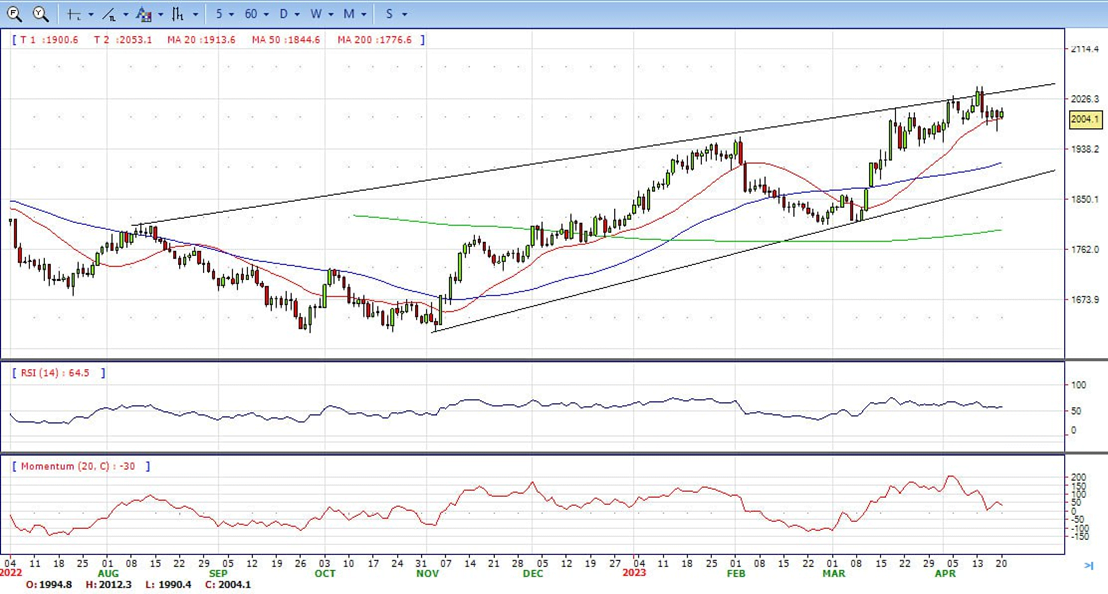
- Gold price stabilized around 2004, up for the day and bullish in the daily chart. The gold price still stabilizes above all main SMAs, suggesting bullish strength in short term. Meanwhile, the 20 continued accelerating north and developing far above 50 and 200 SMA, indicates bulls not exhausted yet. On upside, the immediate resistance is 2015, break above this level will open the gate for more advance to 2032 area.
- From a technical perspective, the RSI indicator holds above the mid-line and stabilizes around 57, on a bullish strength. The Momentum indicator hold in the positive territory, suggests upward potentials. On downside, the immediate support is 1969, below this area may resume the decline to 1950.


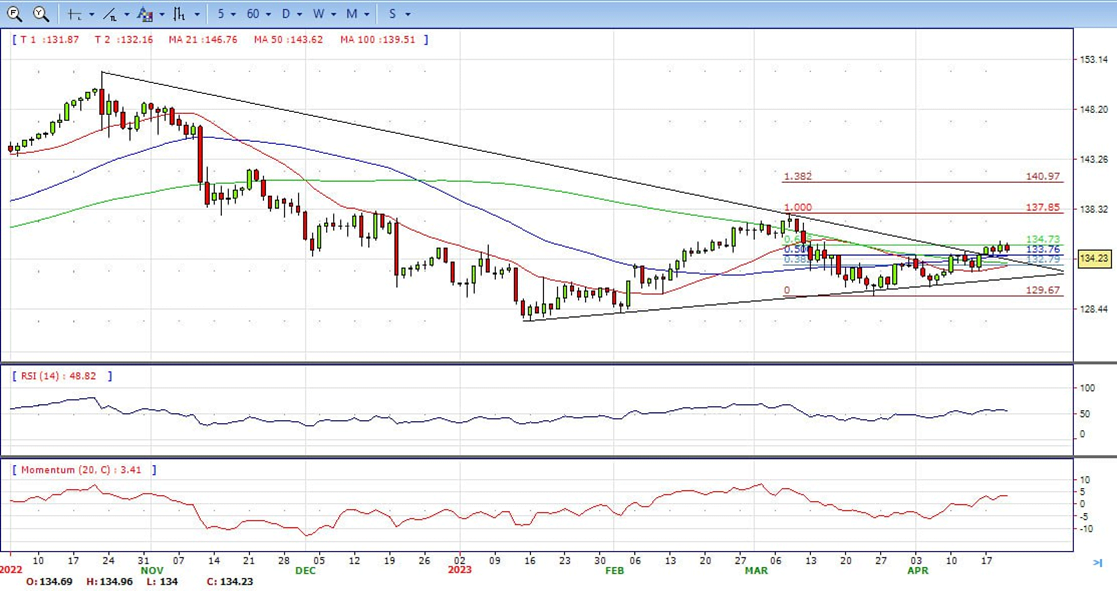
- USD/JPY is down 0.26%, losing ground in late New York trade within the day´s range of 134.01 the earlier low and last Asian high of 134.97.
- The renewed selling pressure in the greenback forces the USD Index to give away earlier gains and return to the sub-102.00 region, while the corrective decline in US yields across the curve collaborate further with the daily pullback in spot. In the Japanese docket, the trade deficit shrank to ¥754.5B in March, while Foreign Bond Investment rose to ¥500.2B in the week to April 15 and the Tertiary Industry Index rose 0.7% MoM in February.
- The USD/JPY pair stabilized around 134.25, down for the day and bullish in the daily chart. The price stabilizes above 20 and 50 SMA, suggests bullish strength in short term. However, 20 SMA started turning flat but continued developing below longer ones, indicating bears not exhausted. On upside, overcome 135.15 may encourage bulls to challenge 137.00, break above that level will open the gate to 138.00.
- Technical indicators suggest the bullish strength. RSI stabilizes around 56, while the Momentum indicator stabilizes above the midline, suggests upward potentials. On downside, the immediate support is 133.70, break below this level will open the gate to 132.80 area.
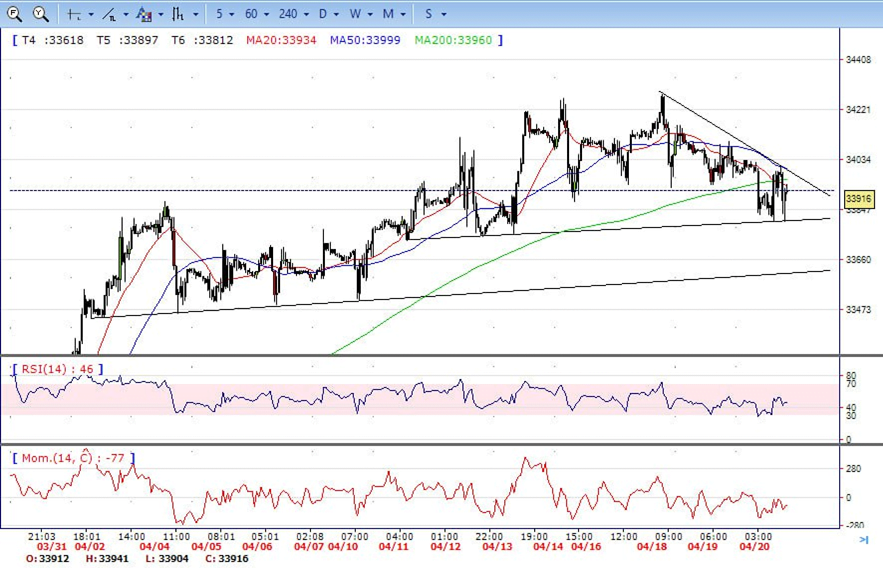
- DJI still under the sell pressure on Thursday, It tumbled to low 33800 area, then recovered modestly and ended the day around 33910, down for the day and indicates bearish sign in the hourly chart. Right now market is standing below 20 and 50 SMA, suggests bearish strength. Meanwhile, 20 SMA continued accelerating south and developing below longer ones, suggests bears not exhausted yet. On upside, overcome 34000 may encourage bulls to challenge 34280, break above that level will open the gate to 34410.
- Technical indicators suggest the bearish movement. RSI stabilizes around 46, while the Momentum indicator stabilizes below the midline, suggests downward potentials. On downside, the immediately support is 33730, break below this level will open the gate for more decline to 33450 area.
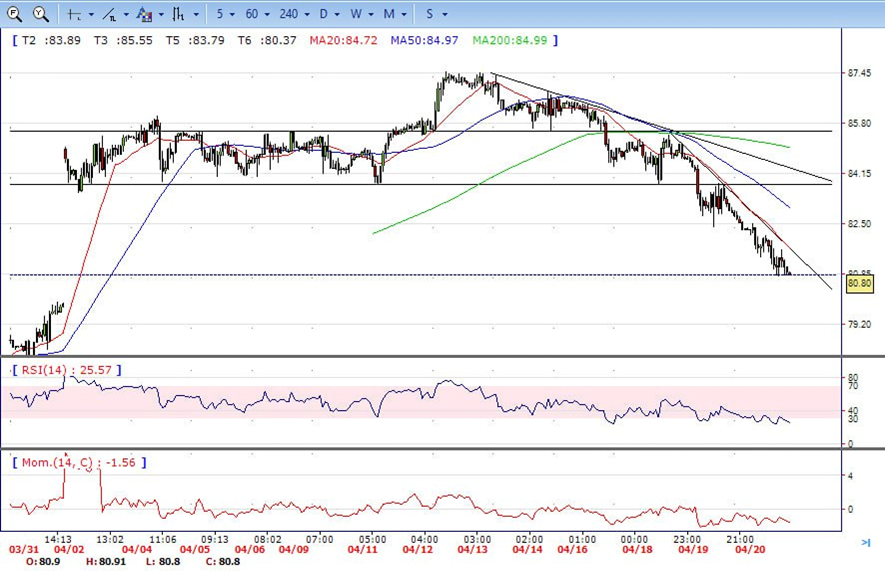
- Brent still under the sell pressure on Thursday, tumbled to intraday low 80.80 and holds near the bottom at the end of US session, down for the day and indicates bearish sign in the hourly chart. Meanwhile, the 20 SMA continued accelerating south and developing far below longer ones, indicates bears not exhausted yet. On upside, overcome 82.50 may encourage bulls to challenge 83.80, break above that level will open the gate to 85.50.
- Technical indicators also suggest bearish movement, hovering below the midline. RSI stabilizes at 24, while the Momentum indicator stabilizes in negative territory, suggests downward potentials. On downside, the immediately support is 80.00, break below this level will open the gate for more decline to 78.40 area.