

24/02/2023 Daily Reports
- EUR/USD printed fresh lows on Thursday on the third day of there being shorts in the market which gives rise to the prospects of a move up for the final stages of the week. It ended the day near the bottom and bearish in the daily chart.
- Risk aversion continued underpinning the American Dollar on Thursday, reaching fresh February highs against most major rivals. The Greenback advanced during Asian trading hours on the back of hawkish FOMC Meeting Minutes, picking up momentum during the US session and after mixed United States figures.
- On the one hand, the annualized pace of growth in the country was downwardly revised to 2.7% from 2.9% in the last quarter of 2022, according to the second estimate of the Q4 GDP estimate. On the other, inflationary pressures in the same period were higher than previously estimated, as Personal Consumption Expenditure Prices rose by 3.7%, while the core reading came in at 4.3% higher than the 3.9% gain from the third quarter of 2022. The figures further fuelled speculation the US Federal Reserve will continue to hike rates in the upcoming meetings while a potential pivot on monetary policy is farther away.
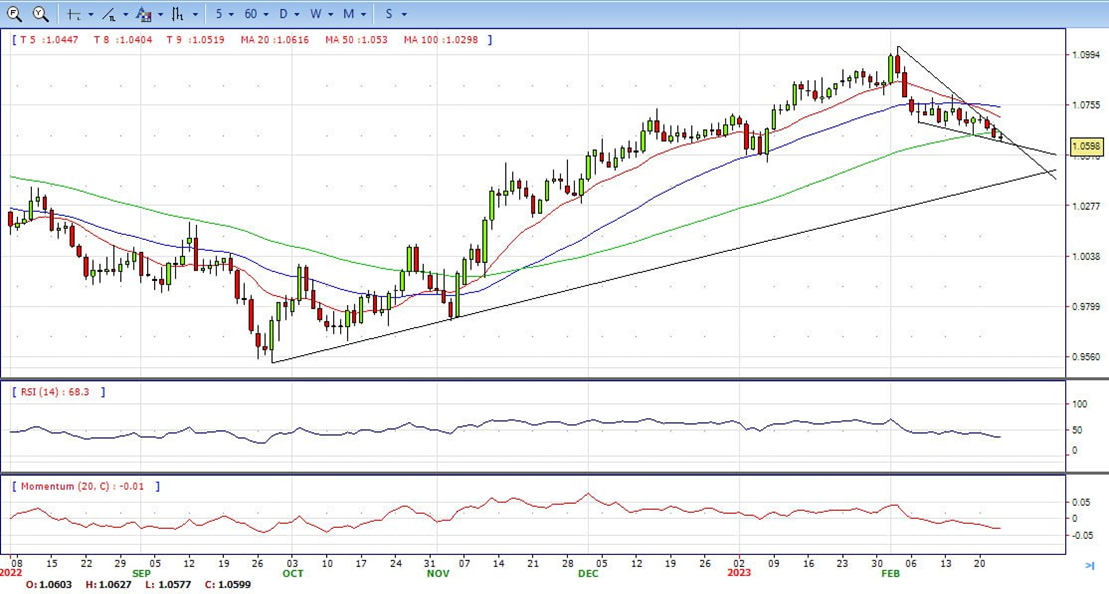
- The EUR/USD pair is trading near the 1.0600, slightly down for the day with bearish stance in daily chart. The pair still stabilized below 20 and 50 SMA, indicates bearish strength. Meanwhile, the 20 SMA started turning south and heading towards longer ones, suggests bears not exhausted yet. On upside, the immediate resistance is 1.0700, break above this level will extend the advance to 1.0800.
- Technical readings in the daily chart support the bearish stance. The RSI indicator stabilizes around 36. The Momentum indicator holds below the midline, indicating downward potentials. On downside, the immediate support is 1.0570 and below this level will open the gate to 1.0470.
- The GBP/USD pair meets with a fresh supply following an intraday uptick to the 1.2075 region and drops to a fresh daily low during the late-US session. Spot prices have leaked lower all session despite multiple attempts at a rebound and are now trading just below the 1.2020 mark.
- The US Dollar remains pinned near a multi-week high, which, in turn, is seen as a key factor exerting some downward pressure on the GBP/USD pair. A swathe of US data out today presented a mixed picture. On the one hand Q4 GDP came out at 2.7%, and was below expectations of 2.9% and Q3’s 3.2%, suggesting the economy was slowing at a faster rate than expected, raised fears rising borrowing costs might be impacting on growth. This suggests a less hawkish approach is likely from the US Federal Reserve – which would be negative for the USD.
- Whilst on the other, the Core PCE Prices, the Fed’s preferred gauge of inflation, showed signs of price stickiness, coming out at 4.3% in Q4, which was above the 3.9% forecast by economists but still below the 4.7% of Q3. This might encourage a more hawkish bias for the Federal Reserve in its wrestle with inflation, which would be US Dollar positive.
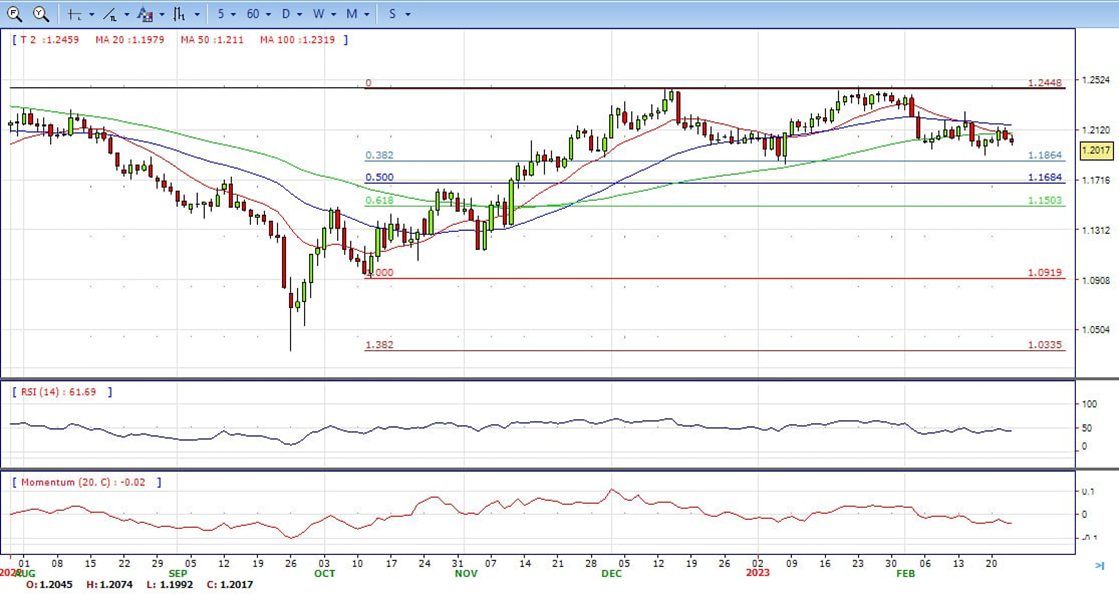
- The GBP/USD offers bearish stance in daily chart. Cable stabilizes below 20 and 50 SMA, indicating bearish strength in short term. Meanwhile, the 20 SMA continued accelerating south and heading towards longer ones, suggests bears not exhausted yet. On upside, The immediate resistance is 1.2150 with a break above it exposing to 1.2270.
- Technical readings in the daily chart support the neutral to bearish stances. RSI indicator stabilizes around 43, while the Momentum indicator stabilizes below the midline, suggesting downward potentials. On downside, the immediate support is 1.1910, unable to defend this level will resume the decline to 1.1840.


- Gold prices rebounded after hitting fresh monthly lows amid risk appetite and an intraday reversal of the US Dollar. XAU/USD bottomed at $1,817 following the release of US economic data, the lowest level since late December and then bounced back above the $1,820 area.
- Data released in the US came in mixed. Initial Jobless Claims dropped to 192K, the lowest level in three weeks. The second reading of Q4 GDP showed a lower annualized growth rate of 2.7% below the 2.9% of the previous estimate. Inflation indicators of the GDP report were revised higher. The Chicago Fed’s National Activity Index rose from -0.43 to 0.23, surpassing expectations.
- Investors continue to digest the FOMC minutes and the new economic numbers. The Dow Jones is climbing 0.43% and the Nasdaq is rising 0.50%. US yields are modestly lower, hovering near monthly highs.
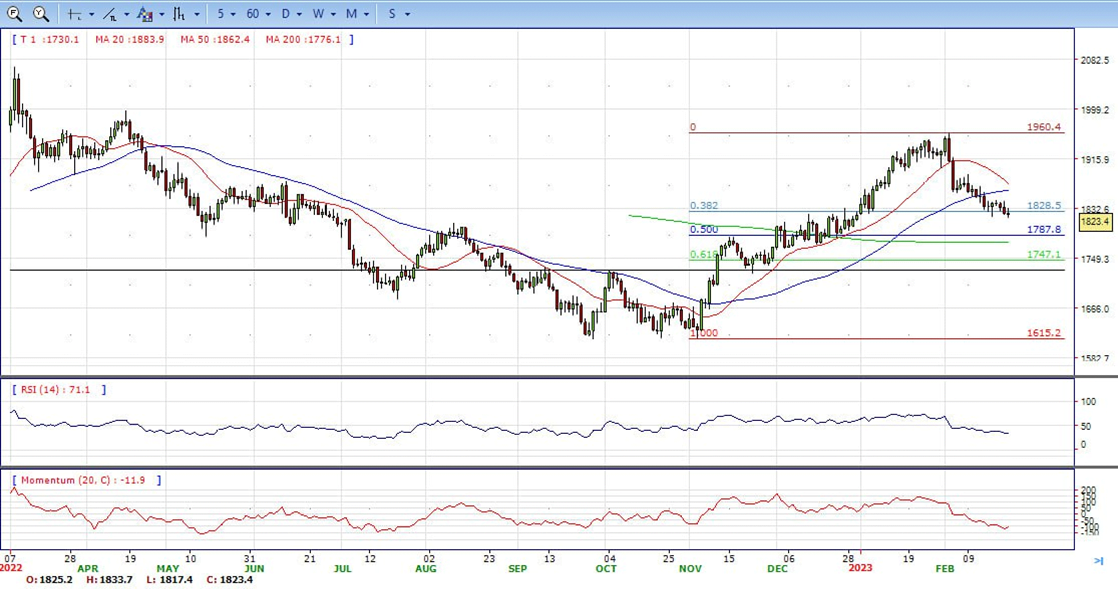
- Gold price stabilized around 1823, unchanged for the day and bearish in the daily chart. The gold price stabilized below 20 and 50 SMA, suggesting bearish strength in short term. Meanwhile, the 20 SMA started turning south and heading towards longer ones, indicating bears not exhausted yet. On upside, the immediate resistance is 1860, break above this level will open the gate for more advance to 1891 area.
- From a technical perspective, the RSI indicator holds below the mid-line and stabilizes around 35, on a bearish strength. The Momentum indicator hold below the midline, suggests downward potentials. On downside, the immediate support is 1817, below this area may resume the decline to 1800.


- USD/JPY is trading offered in the afternoon on Wall Street and is down some 0.2% within the range of the day between 135.36 and 134.60. It is hovering around 134.60 at the ended of the day, still bullish in the daily chart.
- US Treasury yields edged lower in choppy trading, with those on the 10-year pulling back from three-month highs. This occurred despite investors pricing in the strong economic data of late that commenced with the last Nonfarm Payrolls report at the start of this month.
- Benchmark 10-year Treasury notes were down at 3.881%, while the yield curve measuring the gap between the two- and 10-year Treasury notes was still inverted indicating a looming recession. Nevertheless, the US Dollar retained its strength against its major peers. The US Dollar index, which measures the greenback vs. a basket of currencies, DXY climbed to a high of 104.779 before falling back to the 104.50s. The index is still up from the day’s low of 104.308.
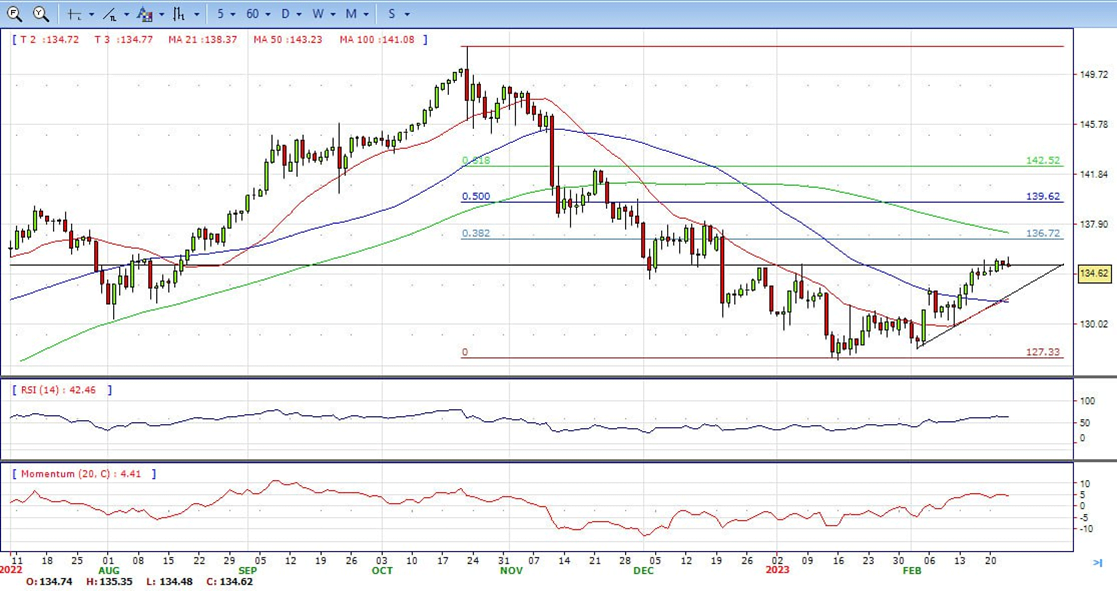
- The USD/JPY pair stabilized around 134.60, unchanged for the day and bullish in the daily chart. The stabilizes above 20 and 50 SMA, suggests bullish strength in short term. Meanwhile, 20 SMA continued accelerating north and heading towards longer ones, indicating bulls not exhausted. On upside, overcome 135.35 may encourage bulls to challenge 136.70, break above that level will open the gate to 138.20.
- Technical indicators suggest the bullish strength. RSI stabilizes around 63, while the Momentum indicator stabilizes in the positive territory, suggests upward potentials. On downside, the immediate support is 133.50, break below this level will open the gate to 132.50 area.
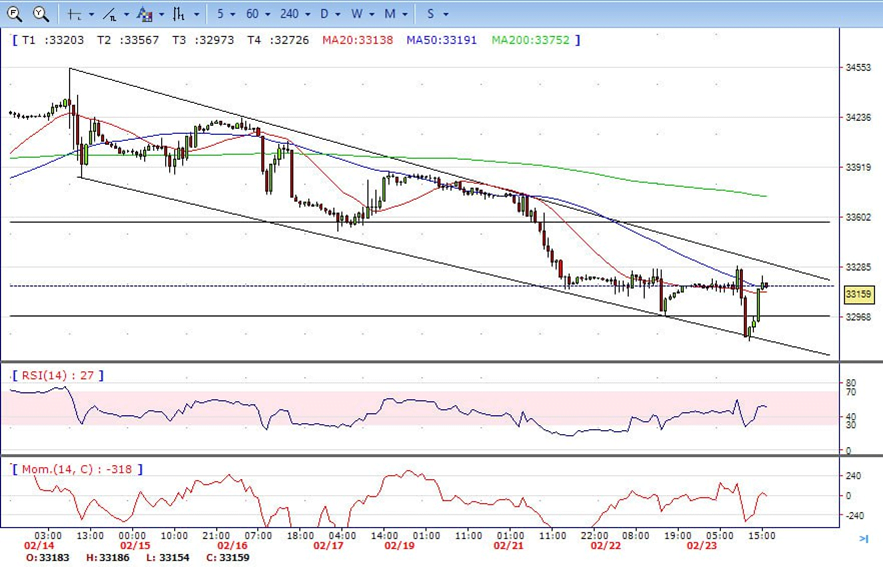
- DJI continued under the sell pressure on the earlier of the day, retreated to low 32820 area. It reversed its direction after then, recovered all the losses and jumped to high 33228 area. It ended Thursday around 33150, up for the day and indicates neutral sign in the hourly chart. Right now market is standing above 20 and 50 SMA, suggests bullish strength. Meanwhile, 20 and 50 SMA continued accelerating south and developing far below 200 SMA, suggests bears not exhausted yet. On upside, overcome 33270 may encourage bulls to challenge 33550, break above that level will open the gate to 33750.
- Technical indicators suggest the neutral movement. RSI stabilizes around 50, while the Momentum indicator stabilizes near the midline, suggests directionless potentials. On downside, the immediately support is 32950, break below this level will open the gate for more decline to 32800 area.
- The Brent continued the advance after hit intraday low 80.40, It climbed to high 82.77 and retreated modestly to ended Thursday around 82.50. The price currently stabilizes above 20 and 50 SMA, suggests bullish strength in the hourly chart. Meanwhile, the 20 SMA started turning north and heading towards longer ones, indicates bulls not exhausted yet. On upside, overcome 82.80 may encourage bulls to challenge 84.30, break above that level will open the gate to 85.70.
- Technical indicators also suggest bullish movement, hovering above the midline. RSI climbs to 61, while the Momentum indicator stabilizes in positive territory, suggests downward potentials. On downside, the immediately support is 81.50, break below this level will open the gate for more decline to 80.40 area.


