24/01/2023 Daily Reports
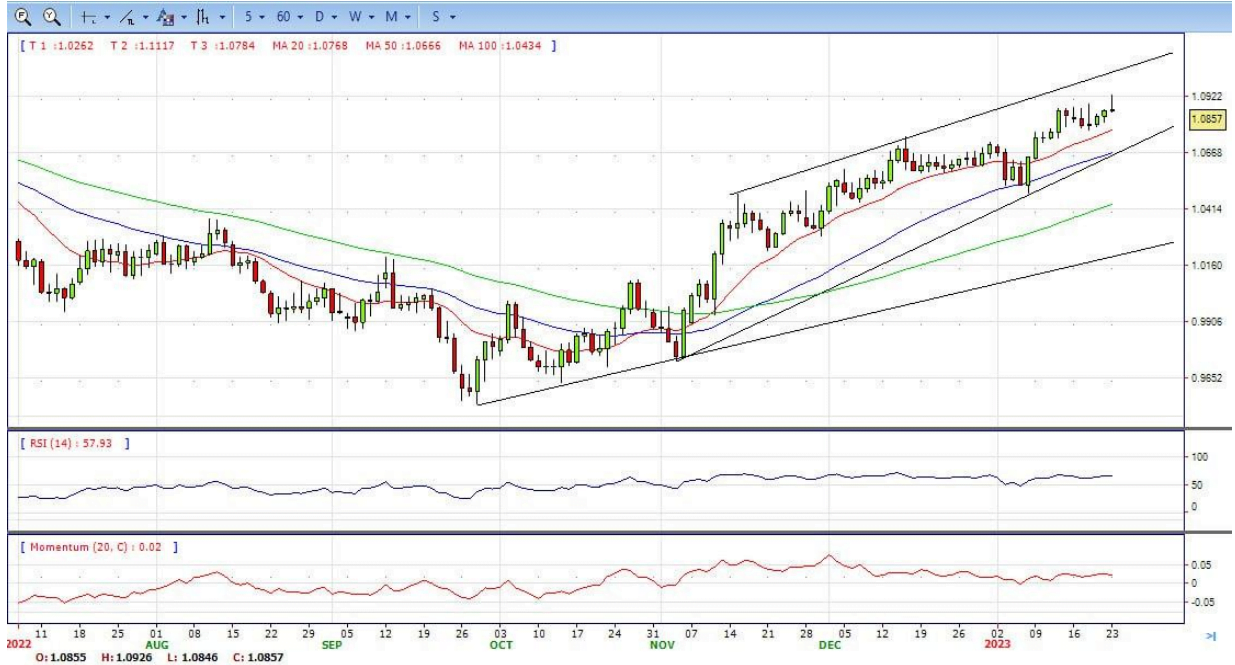
- EUR/USD extends further the auspicious start of the new year and advances past the 1.0900 barrier for the first time since April 2022. It retreated from the top and ended Monday around 1.0860, still bullish in the daily chart.
- In trade on Monday, futures have priced out almost any chance the Fed could move by 50 basis points next month and have steadily lowered the likely peak for rates to 4.75% to 5.0%, from the current 4.25% to 4.50%. By contrast, ECB policymaker Peter Kazimir said on Monday that inflation easing was good news but added that it was not a reason to slow the pace of interest rate hikes, as reported by Reuters.
- In more recent trade, ECB President Christine Lagarde largely repeated the bank’s most recent policy guidance. “We have made it clear that ECB interest rates will still have to rise significantly at a steady pace to reach levels that are sufficiently restrictive, and stay at those levels for as long as necessary,” Lagarde said in a speech.
- The EUR/USD pair is trading near the 1.0860, unchanged for the day with bullish stance in daily chart. The pair still stabilized above 20 and 50 SMA, indicates bullish strength. Meanwhile, the 20 SMA continued accelerating north and developing far above longer ones, suggests bulls not exhausted yet. On upside, the immediate resistance is 1.0930, break above this level will extend the advance to 1.1000.
- Technical readings in the daily chart support the bullish stance. The RSI indicator is above 66. The Momentum indicator stabilizes in positive territory, indicating bullish potentials. On downside, the immediate support is 1.0760 and below this level will open the gate to 1.0710.
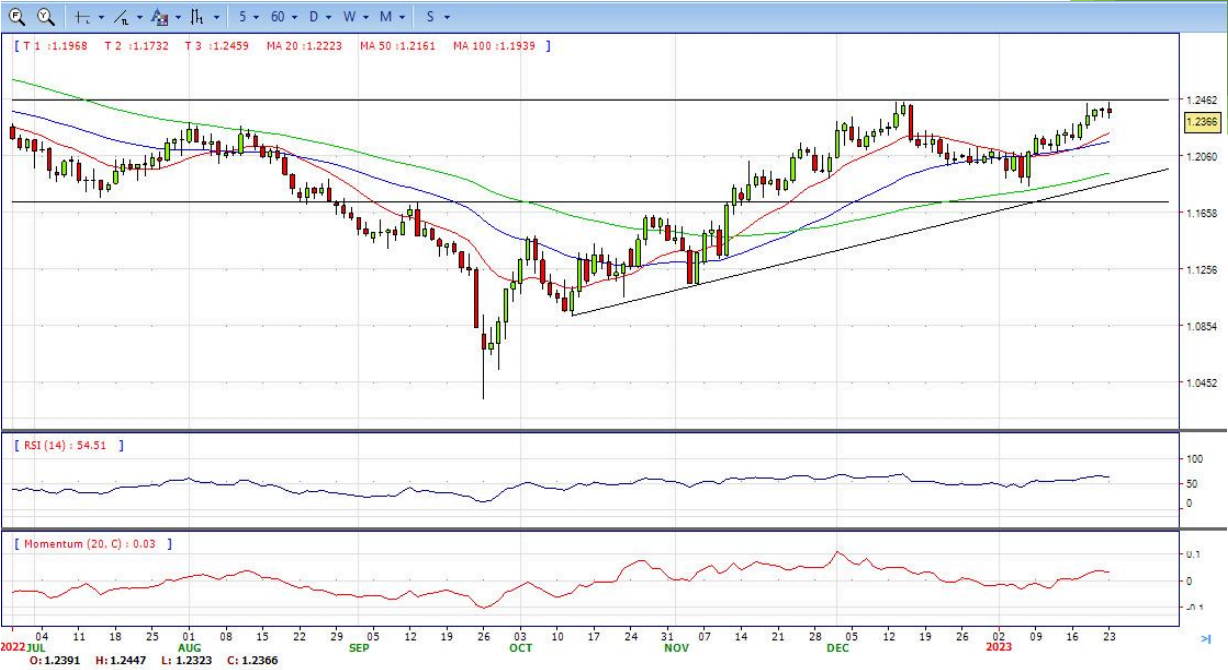
- The Pound Sterling is retreating after hitting a seven-month high at 1.2447, though it lacked the strength to hold to the 1.2400 figure and is meandering in the 1.2380s area. At the time of writing, the GBP/USD exchanges hands at 1.2368, below its opening price by a minimal margin.
- Sentiment remains upbeat, as shown by Wall Street’s trading in the green. Factors like a steady US Dollar and US Treasury bond yields holding to its gains weigh the GBP/USD pair. The lack of US and UK economic data keeps investors leaning on last week’s news and expectations for interest rate hikes.
- Last week’s UK’s CPI report, with inflation staying at 10.5% though eased from 10.7% of its last month’s previous reading. That increased the likelihood of a 50 bps rate hike by the Bank of England, which according to Reuters, stand at a 70% chance, while a 25 bps rate lift is fully priced in.
- The GBP/USD offers bullish stance in daily chart. Cable stabilizes above 20 and 50 SMA, indicating bullish strength in short term. Meanwhile, the 20 and 50 SMA continues accelerating north and developing above 200 SMA, suggests bulls not exhausted yet. On upside, The immediate resistance is 1.2450 with a break above it exposing to 1.2670.
- Technical readings in the daily chart support the bullish stances. RSI indicator stabilizes around 64, while the Momentum indicator stabilizes above the midline, suggesting upward potentials. On downside, the immediate support is 1.2250, unable to defend this level will resume the decline to 1.2150.


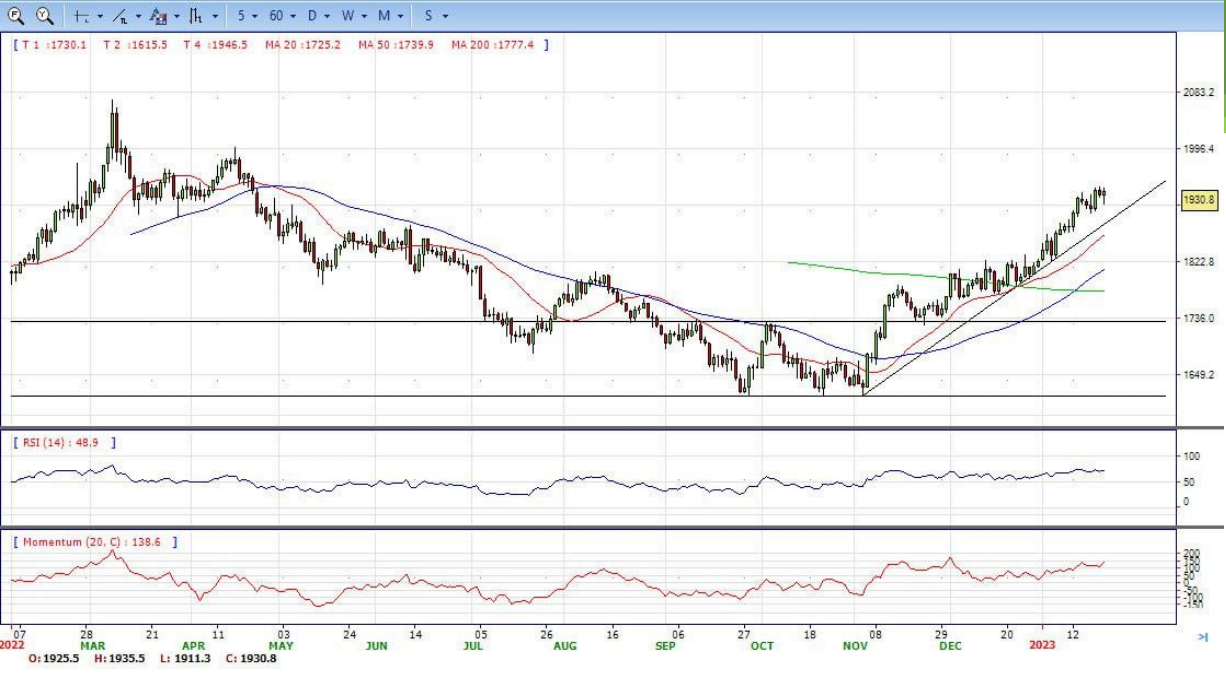
- Gold price retraces from around daily highs hit at $1935.50 and drops beneath $1915 as US Treasury bond yields recover some ground and underpin the USD, although market sentiment remains upbeat. It then trimmed all the losses and back to above $1930 area, still bullish in the daily chart.
- Factors like US Treasury bond yields advancing, particularly the 10-year benchmark note rate up three and a half bps, at 3.517%, is weighing on Gold prices. Consequently, the greenback edges up 0.16%, as shown by the US Dollar Index, a measure of the buck’s value against a basket of peers, trading at 102.142, a headwind for XAU/USD.
- Data-wise, the US economic calendar would unveil the Gross Domestic Product (GDP) results for the fourth quarter in the US, with estimates of around 2.6% QoQ. Additionally, Flash PMIs, Unemployment Claims, Durable Good Orders, and the Fed’s favorite gauge for inflation, Personal Consumption Expenditures, would provide fresh impetus to Gold traders.
- Gold price stabilized around 1931, up for the day and bullish in the daily chart. The gold price still stabilized above 20 and 50 SMA, suggesting bullish strength in short term. Meanwhile, the 20 and 50 SMA continued accelerating north and developing above 200 SMA, indicating bulls not exhausted yet. On upside, the immediate resistance is 1938, break above this level will open the gate for more advance to 1960 area.
- From a technical perspective, the RSI indicator holds above the mid-line and stabilizes around 71, still on a bullish strength. The Momentum indicator continues developing in positive territory, suggests more upside potentials. On downside, the immediate support is 1896, below this area may resume the decline to 1868.


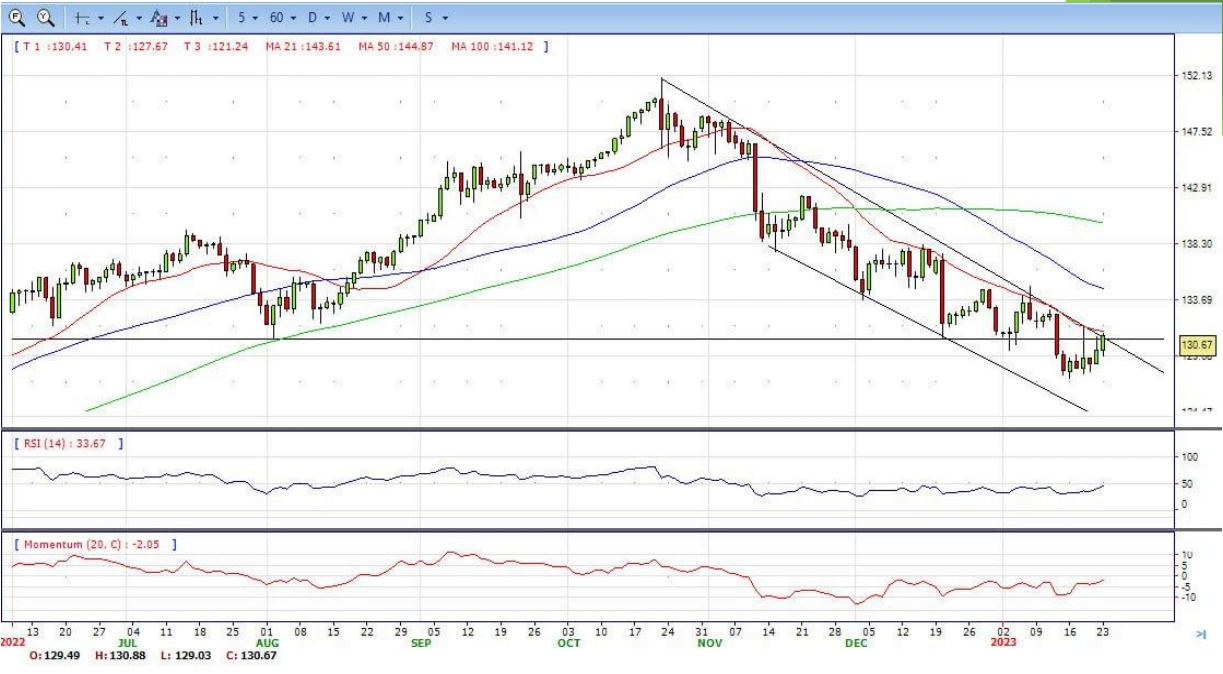
- The now better tone in the greenback helps USD/JPY advance to the area just below 131.00 the figure at the
beginning of the week. It retreated modestly in the US session and ended the day around 130.68, still bearish in the daily chart. - USD/JPY trades with strong gains and adds to Friday’s decent advance in response to the change of direction in the buck and the continuation of the upside momentum in US yields across the curve.
- In the Japanese money market, instead, JGB 10-year benchmark yields remain in the negative territory around the 0.40% region following the release of the BoJ Minutes of the January gathering. On the latter, Board members emphasized that the recent announcement regarding a wider YCC band did not imply any plans to start normalizing the monetary stance.
- The USD/JPY pair stabilized around 130.68, up for the day and bearish in the daily chart. The price maintains the downward slope and develops below all main SMAs, suggests bearish strength in short term. Meanwhile, 20 SMA continued accelerating south and developing below longer ones, indicating bears not exhausted. On upside, overcome 130.90 may encourage bulls to challenge 131.60, break above that level will open the gate to 133.00.
- Technical indicators still suggest the bearish strength. RSI fell to 41, while the Momentum indicator stabilize in negative territory, suggests downward potentials. On downside, the immediate support is 128.70, break below this level will open the gate to 127.20 area.
- DJI continued the advance on Friday, climbed from intraday low of 33400 area to high 33880. It trimmed some gains and ended Monday around 33710, indicates bullish sign in the hourly chart. Right now market is standing above 20 and 50 SMAs, suggests a bullish strength. Meanwhile, 20 SMA continued accelerating north and heading towards 200 SMA, suggests bulls not exhausted yet. On upside, overcome 33900 may encourage bulls to challenge 34130, break above that level will open the gate to 34500.
- Technical indicators also suggest the bullish movement, developing above the mid-line. RSI stabilized around 60, while the Momentum indicator hovering far above the mid-line, suggests upside potentials. On downside, the immediately support is 33400, break below this level will open the gate for more decline to 33000 area.

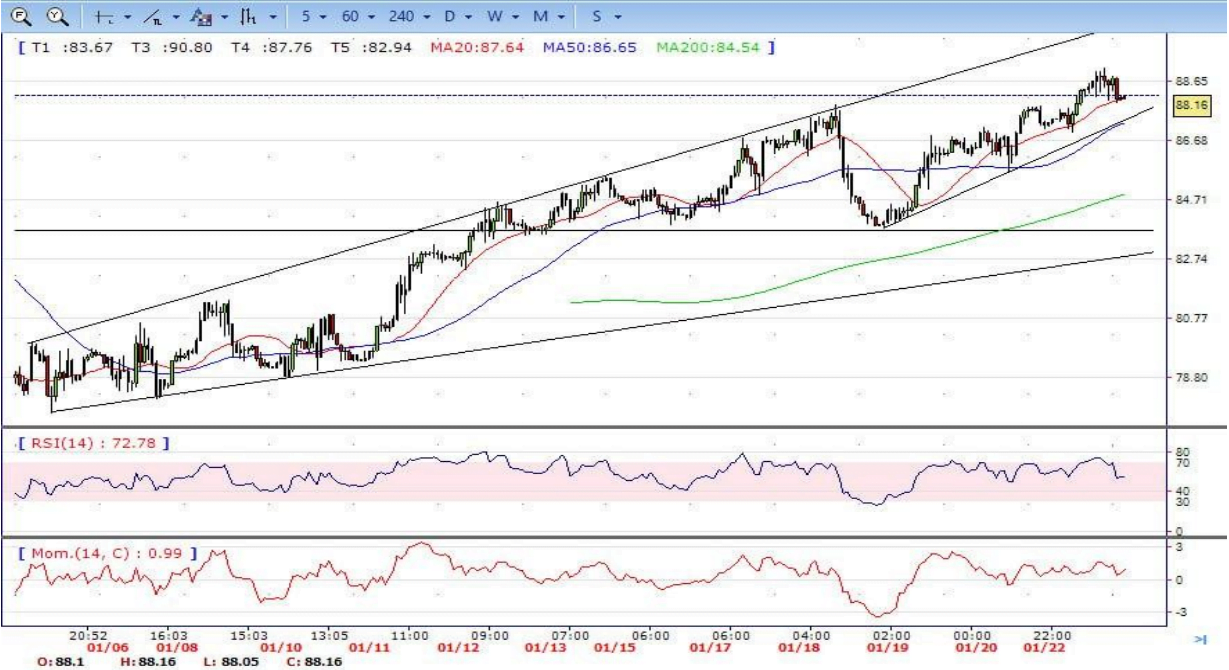
- The Brent continued the advance on Monday. It climbed to high 89.08, but retreated modeslty in the US session and ended the day around 88.18, still bullish in the hourly chart. The price stabilizes above 20 and 50 SMA, suggests bullish strength in short term. Meanwhile, the 20 SMA continued accelerating north and developing above 50 SMA, indicates bulls not exhausted yet. On upside, overcome 89.20 may encourage bulls to challenge 90.50, break above that level will open the gate to 92.00.
- Technical indicators also suggest bullish movement, hovering above the midline. RSI climbs to 56, while the Momentum index is well above the midline, suggests upward potentials. On downside, the immediately support is 87.00, break below this level will open the gate for more decline to 85.60 area.