22/11/2022 Daily Reports
- EUR/USD maintains the corrective downside well in place for yet another session and threatens to challenge the key support around the 1.0200 neighbourhood sooner rather than later.
- Indeed, in quite an uneventful session, the Greenback extends the recent bounce backed by the recent hawkish message from some Fed speakers, which lent renewed oxygen to both the buck and yields, while at the same time mitigated the optimism around a potential Fed pivot. Earlier in the calendar, German Producer Prices contracted 4.2% MoM in October and rose 34.5% vs. the same month of 2021. In the US data space, the Chicago Fed National Activity Index dropped to -0.05 in October
- In the meantime, the European currency is expected to closely follow Dollar dynamics, geopolitical concerns and the Fed-ECB divergence. In addition, markets repricing of a potential pivot in the Fed’s policy remains the exclusive driver of the pair’s price action for the time being.
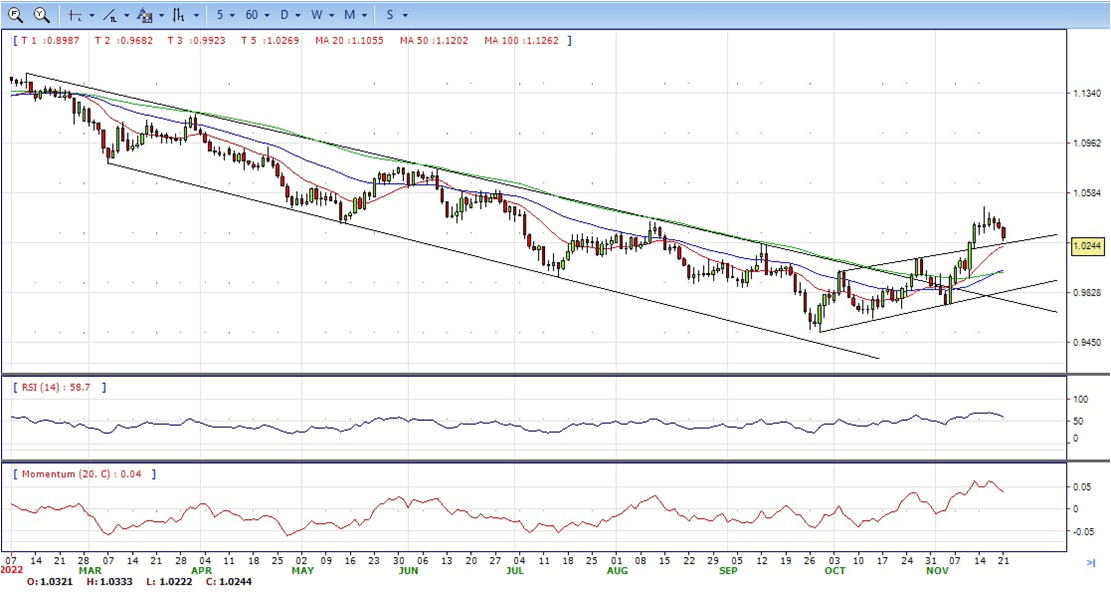
- The EUR/USD pair is trading near the 1.0240, down for the day with bullish stance in daily chart. The pair stabilized above 20 and 50 SMA, indicates bullish strength. Meanwhile, the 20 SMA continued accelerating north and developing above longer ones, suggests bulls not exhausted yet. On upside, the immediate resistance is 1.0300, break above this level will extend the advance to 1.0400.
- Technical readings in the daily chart support the bullish stances. The RSI indicators hovering above the midlines and stabilized around 57. The Momentum indicator stabilized above the midline, indicating upward potentials. On downside, the immediate support is 1.0200 and below this level will open the gate to 1.0100.
- The Pound Sterling strumbled sharply below the 1.1900 figure in the North American session amid risk aversion as China’s Covid-19 crisis worsens. In the last week, hawkish Federal Reserve (Fed) rhetoric weighed on investors, which lifted global equities from their yearly lows. At the time of writing, the GBP/USD is trading at 1.1816, beneath its opening price by 0.60%.
- Equities remain downbeat, hit hard by China’s Covid-related news that three people died during the weekend, sparking fears that authorities could reimpose strict measures to curb the outbreak. The economic docket in the US revealed the Chicago National Activity index fell into negative territory in October, to -0.05 from 0.17 in September. Aside from this, even though US October CPI and PPI reports were softer-than-expected, a solid US Retail Sales report increased the chances that the Fed will continue tightening monetary conditions.
- On the UK side, the Office for Budget Responsibility (OBR) foresees a drop of 1.4% in GDP for 2023, worst than the estimated 1.8% growth in March. Meanwhile, expectations that the BoE would tighten monetary policy
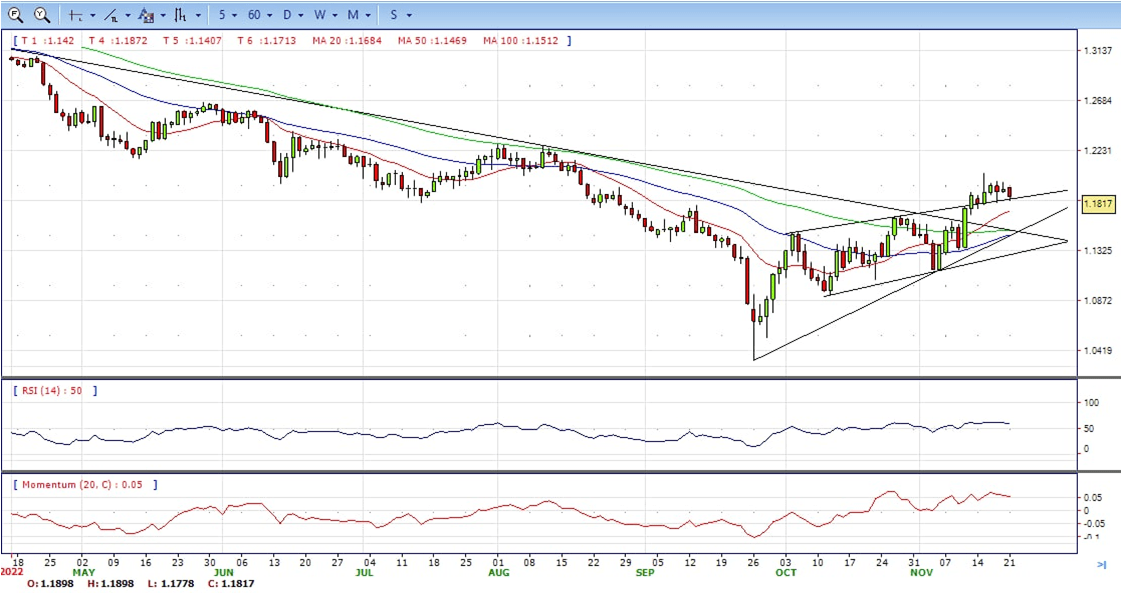
- The GBP/USD offers bullish stance in daily chart. Cable stabilized above all main SMAs, indicating bullish strength in short term. Meanwhile, the 20 SMA continued accelerating north and developing above longer ones, suggests bulls not exhausted yet. On upside, The immediate resistance is 1.2030 with a break above it exposing to 1.2150.
- Technical readings in the daily chart support the bullish stances. RSI indicator stabilized around 59, while the Momentum indicator stabilized above the midline, suggesting upward potentials. On downside, the immediate support is 1.1750, unable to defend this level will resume the decline to 1.1640.


- Gold Price grinds lower amidst a risk-off impulse, which triggered a flight to safe-haven assets. The US Dollar remains underpinned by investors’ concerns that the recent Covid-19 outbreak in China could spur authorities to reimpose restrictions. Therefore, the metals segment is down, as shown by the XAU/USD trading at $1738, below its opening price by 0.87%.
- Sentiment remains negative, as shown by Wall Street posting losses between 0.32% and 1.08%. The financial markets narrative has not changed since October’s CPI report from the US, which cooled down, while the PPI followed suit. Even though both reports showed that prices are stabilizing, speculations that the Fed might pause hiking rates were used to spur a rally in equities, which weighed on the US Dollar. However, last week’s solid US Retail Sales data increased the likelihood that the Fed would continue tightening conditions.
- Data-wise, the US economic calendar featured the Chicago National Activity index falling to negative territory in October, to -0.05 from 0.17 in September, which triggered to reaction in the XAU/USD. In the meantime, the US Dollar Index, a measure of the buck’s value against its peers, extends its gains by 0.93%, at 107.967, registering a fresh one-week high.
- Gold price stabilized around 1738, down for the day and bullish in the daily chart. The gold price still stabilized above 20 and 50 SMA, suggesting bullish strength. Meanwhile, the 20 SMA started turning north and heading towards longer ones, indicating bulls not exhausted yet. On upside, the immediate resistance is 1787, break above this level will open the gate to extend the advance to 1800 area.
- From a technical perspective, the RSI indicator hold above the midline and stabilized around 57, suggesting bullish strength. The Momentum indicator stabilized above the midline, suggests upward potentials. On downside, the immediate support is 1730, below this area may resume the decline to 1700.


- The USD/JPY pair gains strong positive traction on Monday and recovers further from its lowest level since August 29 touched last week. Spot prices climb to over a one-week high during the early North American session, with bulls now looking to build on the momentum further beyond the 142.00 mark.
- The worsening COVID-19 situation in China and the imposition of fresh lockdowns fuel worries about a deeper economic downturn. This, in turn, boosts the US Dollar’s status as the global reserve currency. This, along with a big divergence in the monetary policy stance adopted by the Federal Reserve and the Bank of Japan, provides an additional lift to the USD/JPY pair.
- The US Dollar builds on its recovery from the lowest level since August 12 – touched in the aftermath of softer US consumer inflation figures last week – and acts as a tailwind for the USDJPY pair. The better-than-expected US Retail Sales data released on Thursday cast doubts on the peak inflation narrative. Adding to this, hawkish signals from several Fed officials suggest that the US central bank is still far from pausing its policy-tightening cycle. This is seen as a key factor that continues to lend some support to the greenback.
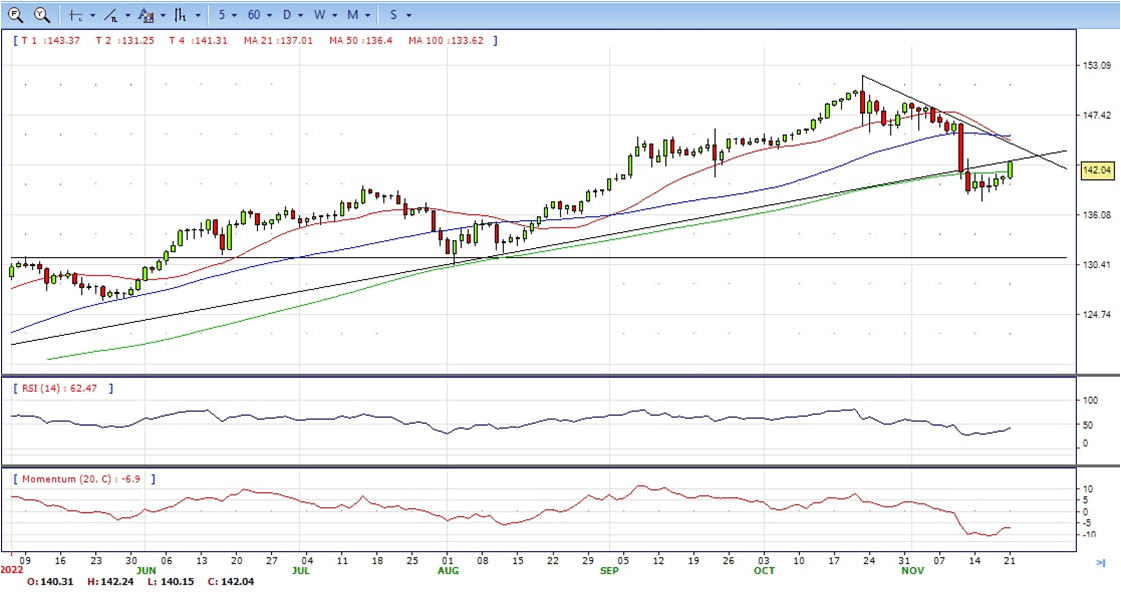
- The USD/JPY pair stabilized around 142.10, up for the day and bearish in the daily chart. The price still maintains the downward slope and develops below all main SMAs, suggests bearish strength in short term. Meanwhile, 20 SMA continued accelerating south and heading towards longer ones, indicating bears not exhausted. On upside, overcome 142.50 may encourage bulls to challenge 144.00, break above that level will open the gate to 145.30.
- Technical indicators suggest the bearish strength. RSI stabilized around 43, while the Momentum indicator continued developing below the midline, suggests downward potentials. On downside, the immediate support is 140.80, break below this level will open the gate to 139.00 area.
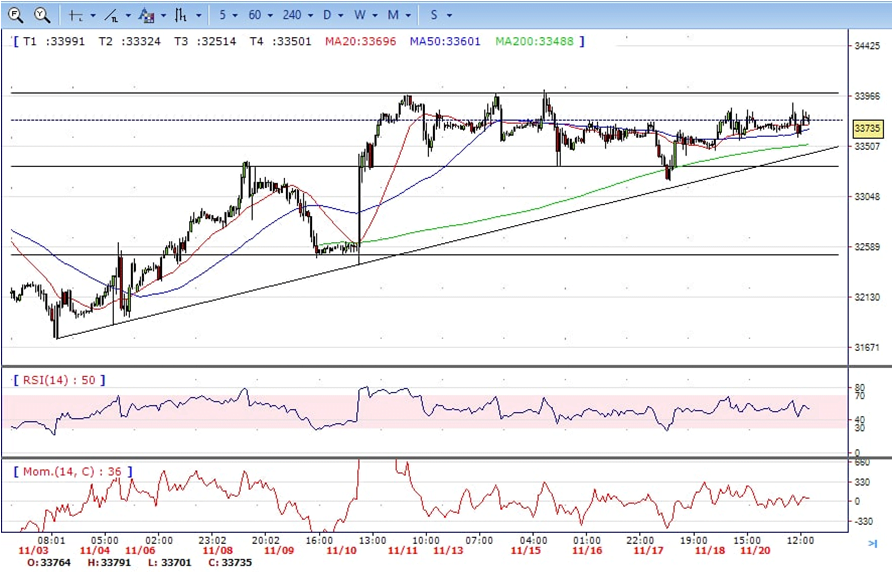
- DJI consolidated in the familiar range, traded between intraday high 33900 to intraday low 33580. It ended Monday at around 33740, up for the day and neutral to bullish in the hourly chart. The price stabilized above 20 and 50 SMA, suggests bullish strength. Meanwhile, 20 and 50 SMA started turning flat but continued developing above 200 SMA, suggests bulls not exhausted in the long term yet. On upside, overcome 34030 may encourage bulls to challenge 34030, break above this level will open the gate to 34300.
- Technical indicators suggest the bullish strength. RSI stabilized around 54, while the Momentum indicator stabilized above the midline, suggests upward potentials. On downside, the immediate support is 33300, break below this level will open the gate for more decline to 33180 area.
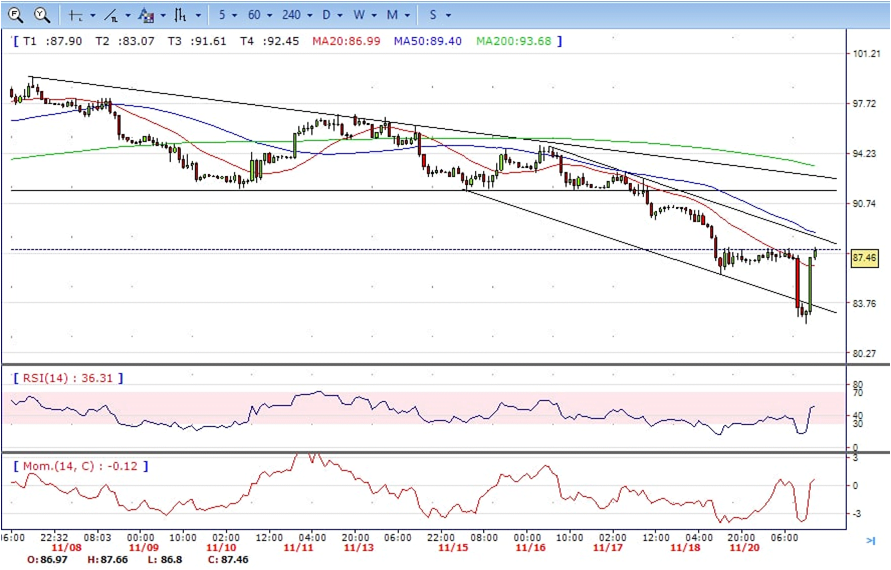
- Brent still under the strong sell pressure in the US session, retreated from intraday high 87.70 to intraday low 82.30 area, it then bounded sharply and ended Monday at around 87.50, unchanged for the day and neutral to bullish in the hourly chart. The price stabilized above 20 SMA, suggests bullish strength in short term. However, the 20 SMA continued accelerating south and developing below longer ones, indicating bearish bias. On upside, overcome 87.70 may encourage bulls to challenge 89.00, break above this level will open the gate to 90.70.
- Technical indicators suggest the bullish movement, hovering above the midline. RSI stabilized at around 52, while the Momentum indicator stabilized above the midline, suggests upward potentials. On downside, the immediate support is 85.80, break below this level will open the gate for more decline to 82.30 area.