

21/12/2022 Daily Reports
- The EUR/USD pair seesaws between tepid gains/minor losses through the early North American session and is currently placed in neutral territory, around the 1.0600 mark, still bullish in the daily chart.
- The Bank of Japan-inspired rally in the Japanese Yen is seen weighing on the USD, which, in turn, is seen lending some support to the EUR/USD pair. That said, a combination of factors continues to act as a tailwind for the greenback and keeps a lid on any meaningful upside for the major, at least for the time being.
- Investors seem worried that a surge in COVID-19 cases in China could delay a broader reopening. This, in turn, overshadows the optimism over the easing of lockdown measures and takes its toll on the global risk sentiment. This is evident from a weaker tone around the equity markets and should benefit the safe-haven buck.
- The EUR/USD pair is trading near the 1.0610, unchanged for the day with bullish stance in daily chart. The pair stabilized above 20 and 50 SMA, indicates bullish strength. Meanwhile, the 20 SMA continued accelerating north and developing far above longer ones, suggests bulls not exhausted yet. On upside, the immediate resistance is 1.0660, break above this level will extend the advance to 1.0740.
- Technical readings in the daily chart support the bullish stances. The RSI indicators hovering above the midline and stabilized around 64. The Momentum indicator stabilized above the midline, indicating upward potentials. On downside, the immediate support is 1.0570 and below this level will open the gate to 1.0500.

- GBP/USD was last -0.6% having fluctuated in and out of the positive territory on Tuesday, driven by volatility due to the BoJ surprise tweak to its bond yield control. The pair ended the day at around 1.2170, still bullish in the daily chart.
- An unexpected hawkish twist by the Bank of Japan triggers a massive rally in the Japanese Yen, which, in turn, weighs on the greenback. Apart from this, an intraday recovery in the risk sentiment is seen as another factor undermining the safe-haven buck and acting as a tailwind for the GBP/USD pair. That said, any meaningful upside still seems elusive, warranting some caution for aggressive bullish traders and positioning for a further intraday appreciating move.
- It is worth recalling that the US central bank indicated that it will continue to raise rates to crush inflation. Furthermore, policymakers projected at least an additional 75 bps increases in borrowing costs by the end of 2023. This, in turn, leads to a fresh leg up in the US Treasury bond yields and favours the USD bulls. Apart from this, a dovish outcome from the Bank of England meeting last week might contribute to capping the upside for the GBP/USD pair.
- The GBP/USD offers bullish stance in daily chart. Cable still stabilized above 50 SMA, indicating bullish strength in short term. Meanwhile, the 20 SMA continued developing above longer ones despite it started turning flat, suggests bulls not exhausted yet. On upside, The immediate resistance is 1.2250 with a break above it exposing to 1.2340.
- Technical readings in the daily chart support the bullish stances. RSI indicator stabilized around 56, while the Momentum indicator stabilized above the midline, suggesting upward potentials. On downside, the immediate support is 1.2080, unable to defend this level will resume the decline to 1.1900.


- The Gold price is higher on Tuesday due to volatility in the market that has sent the USD Dollar lower on the back of a surge in the Japanese Yen following a surprise move by the Bank of Japan (BoJ) in Asian markets. The pair ended Tuesday at around 1818, still bullish in the daily chart.
- A decision by BoJ to raise a cap on the yield of its 10-year Japanese government bonds sent markets into a state of shock and lured investors away from US debt. The BoJ is allowing 10-year bonds to trade at interest rates up to 0.5%, up from 0.25% and such a rise in the cap encourages domestic buying of its bonds. However, the Gold price has rallied despite the subsequent lower global borrowing costs and sell-off in bonds across the world, likely as a direct effect of a cheaper US Dollar.
- Nevertheless, the US Dollar has sunk as per the DXY index as the BoJ switches gears which sent the Yen around 5% higher vs the USD. USD/JPY fell from a pre-BoJ high of 137.40 to a low of 130.56. Consequently, the US Dollar as measured against a basket of currencies, including the yen which makes up 13.6% of the basket fell to a low of 103.77. DXY was trading at a high of 104.90 before the announcement by the BoJ.
- Gold price stabilized around 1818, up for the day and bullish in the daily chart. The gold price still stabilized above 20 and 50 SMA, suggesting bullish strength in short term. Meanwhile, the 20 SMA continued accelerating north and developing above 50 SMA, indicating bulls not exhausted yet. On upside, the immediate resistance is 1825, break above this level will open the gate for more advance to 1848 area.
- From a technical perspective, the RSI indicator hold above the midline and stabilized around 64, suggesting bullish strength. The Momentum indicator stabilized above the midline, suggests upward potentials. On downside, the immediate support is 1798, below this area may resume the decline to 1784.


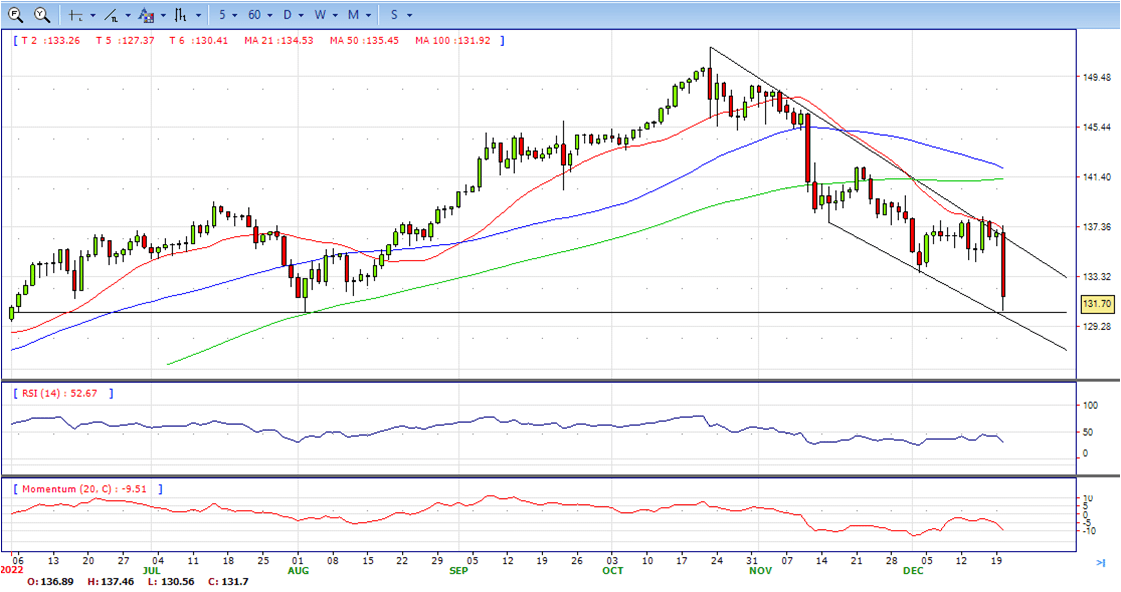
- The USD/JPY dropped even further during the American session and bottomed at 130.56, the lowest intraday level since August 2. It remains near the low, falling more than 500 pips or 4.00%, still bearish in the daily chart.
- The pair is headed toward the lowest daily close since June with the Yen having one of the biggest daily gains across the board boosted by the decision of the Bank of Japan to raise the upper banks of its yield curve control of the 10-year bond from 0.25% to 0.50%.
- It was a small change from the BoJ but market participants are seen a lot more. The impact of the announcement shows that a more significant policy shift could take place much sooner than expected. Until a few hours ago, higher US yields meant a weaker Japanese Yen and bearish pressure for gold. The Japanese Yen is having the best day in years across the board.
- The USD/JPY pair stabilized around 131.75, down for the day and bearish in the daily chart. The price still maintains the downward slope and develops below all main SMAs, suggests bearish strength in short term. Meanwhile, 20 SMA continued accelerating south and developing below longer ones, indicating bears not exhausted. On upside, overcome 132.00 may encourage bulls to challenge 132.90, break above that level will open the gate to 133.70.
- Technical indicators suggest the bearish strength. RSI stabilized around 30, while the Momentum indicator continued developing below the midline, suggests downward potentials. On downside, the immediate support is 130.50, break below this level will open the gate to 128.40 area.
- DJI made a steady advance, climbed from intraday low 32685 to high 33203. It retreated modestly and ended Tuesday at 33060, up for the day and bullish in the daily chart. The price stabilized above 20 and 50 SMA, suggests bearish strength in short term. However, 20 SMA continued developing flat and below 50 SMA , suggests bears not exhausted yet. On upside, overcome 33280 may encourage bulls to challenge 33500, break above this level will open the gate to 33930.
- Technical indicators suggests the bullish strength. RSI stabilized at around 52, while the Momentum indicator stabilized in positive territory, suggests upward potentials. On downside, the immediate support is 32850, break below this level will open the gate for more decline to 32680 area.

- Brent declined modestly, retreated from intraday high 80.88 to intraday low 78.28 and ended Tuesday at around 79.70, slightly down for the day and neutral in the hourly chart. The price stabilized around 20 and 50 SMAs, suggests neutral strength in short term. However, the 20 SMA started turning south and heading towards 50 SMA, indicating bears not exhausted yet. On upside, overcome 81.00 may encourage bulls to challenge 81.80, break above this level will open the gate to 83.20.
- Technical indicators suggest the neutral to bearish movement, hovering near the midline. RSI stabilized at around 47, while the Momentum indicator stabilized near the midline, suggests directionless potentials. On downside, the immediate support is 78.30, break below this level will open the gate for more decline to 77.00 area.


