21/11/2022 Daily Reports
- The EURUSD rejected by 1.0400 area again and fell during the American session to 1.0325 level, on a calm session across FX markets. The greenback spiked higher amid a deterioration in market sentiment that did not last much.
- Economic data released on Friday showed Home Sales in the US dropped for the ninth consecutive month in October. The annual rate fell from 4.71M to 4.43M, above the 4.38M of market consensus. The numbers did not impact markets. The DXY is posting modest weekly gains after more signs of a slowdown in inflation and better-than-expected retail sales numbers.
- Next week key events include the FOMC minutes on Tuesday. US markets will not open on Thursday due to Thanksgiving Day. November Flash PMIs are due on Wednesday. The European Central Bank will release the minutes of the latest meeting on Thursday.
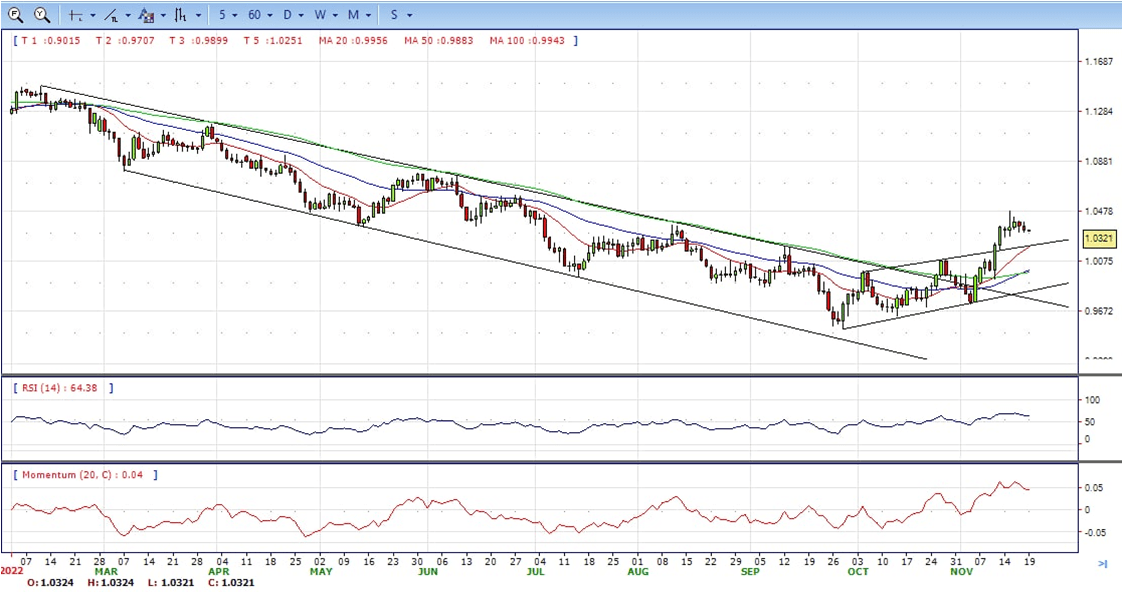
- The EUR/USD pair is trading near the 1.0325, down for the day with bullish stance in daily chart. The pair stabilized above 20 and 50 SMA, indicates bullish strength. Meanwhile, the 20 SMA continued accelerating north and developing above longer ones, suggests bulls not exhausted yet. On upside, the immediate resistance is 1.0480, break above this level will extend the advance to 1.0600.
- Technical readings in the daily chart support the bullish stances. The RSI indicators hovering above the midlines and stabilized around 64. The Momentum indicator stabilized above the midline, indicating upward potentials. On downside, the immediate support is 1.0270 and below this level will open the gate to 1.0200.
- The British Pound (GBP) edges north of 1.1880 amidst a risk-on impulse, as shown by equity futures in the United States climbing with no fundamental reason after a slew of Fed officials signaled rates would continue to rise. The pair ended the week at 1.1882, above its opening price by 0.35%, capitalizing on broad US Dollar (USD) weakness.
- Sentiment turned positive as North American traders waited for US economic data on Existing Home Sales. Given that the last two inflation reports in the United States, namely the CPI and the PPI propelled an improvement in market sentiment, Fed policymakers pushed against a possible Fed pivot. St. Louis Fed President James Bullard said that interest rates are not “sufficiently restrictive” and added that would be if the Federal Funds rate (FFR) hit the 5% to 5.25% area.
- Meanwhile, traders continue to asses a 4-decade high inflation level reached in the UK. The CPI expanded by 11.1% YoY in October, and above the Bank of England projections that inflation would peak at around 10.9%. As shown by STIRs, money market futures estimates an 82% chance that the Bank of England would hike 50 bps to 3..50%.
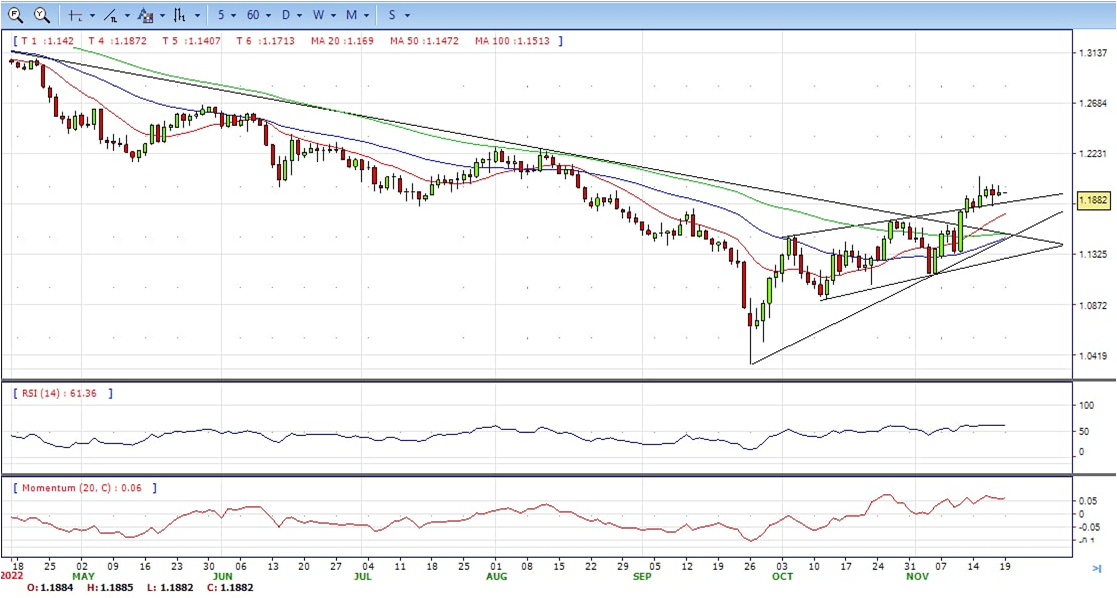
- The GBP/USD offers bullish stance in daily chart. Cable stabilized above all main SMAs, indicating bullish strength in short term. Meanwhile, the 20 SMA continued accelerating north and developing above longer ones, suggests bulls not exhausted yet. On upside, The immediate resistance is 1.2030 with a break above it exposing to 1.2150.
- Technical readings in the daily chart support the bullish stances. RSI indicator stabilized around 61, while the Momentum indicator stabilized above the midline, suggesting upward potentials. On downside, the immediate support is 1.1750, unable to defend this level will resume the decline to 1.1640.


- Gold Price tumbled across the board, courtesy of a risk-off impulse, as European equities turned negatively, while Wall Street is mixed. Additional Fed officials are crossing wires, emphasizing the need for higher interest rates after two soft October inflation reports. XAUUSD ended the week at $1750, below its opening price by 0.24%.
- The US National Association of Realtors reported that Existing Home Sales for October plunged a staggering 5.9%, below a 4.17% increase estimated by analysts. Home sales have fallen since February of 2022 due to the Federal Reserve’s tightening monetary conditions as they try to curb stubbornly high inflation, which peaked around 9%. However, market sentiment remains positive throughout the session on the back of soft CPI, and PPI October reports.
- In the meantime, Fed policymakers reiterated their commitment to taming inflation down. St. Louis Fed President James Bullard said that interest rates are not “sufficiently restrictive” and added that would be if the Federal Funds rate (FFR) hit the 5% to 5.25% area. On Thursday, Minnesota’s Fed President Neil Kashkari commented that one-month data can’t over-persuade the Fed, as it needs to keep at it until they’re sure that inflation has stopped climbing.
- Gold price stabilized around 1750, down for the day and bullish in the daily chart. The gold price stabilized above 20 and 50 SMA, suggesting bullish strength. Meanwhile, the 20 SMA started turning north and heading towards longer ones, indicating bulls not exhausted yet. On upside, the immediate resistance is 1787, break above this level will open the gate to extend the advance to 1800 area.
- From a technical perspective, the RSI indicator hold above the midline and stabilized around 62, suggesting bullish strength. The Momentum indicator stabilized above the midline, suggests upward potentials. On downside, the immediate support is 1747, below this area may resume the decline to 1732.


- The USDJPY pair comes under some selling pressure on Friday and reverses a part of the previous day’s positive move back closer to the weekly peak. The pair remains on the defensive through the early European session and is currently trading around the 140.00 psychological mark, down less than 0.15% for the day.
- The US Dollar continues with its struggle to register any meaningful recovery from the post-US CPI slump to a three-month low touched on Tuesday and acts as a headwind for the USDJPY pair. The Japanese Yen, on the other hand, is drawing some support from Friday’s release of stronger domestic consumer inflation data, which showed that the core CPI accelerated to a 40-year high in October. This exerts additional downward pressure on the major, though any meaningful downside still seems elusive, at least for the time being.
- The recent hawkish remarks by a slew of US central bank officials suggest that more interest rate hikes were on the way. This, in turn, pushes the US Treasury bond yields higher and should lend some support to the USD. In contrast, the Bank of Japan that the central bank will stick to its monetary easing to support the economy and achieve the 2% inflation target in a sustained, stable fashion. This marks a big divergence in the monetary policy stance adopted by the two major central banks, which could weigh on the JPY.
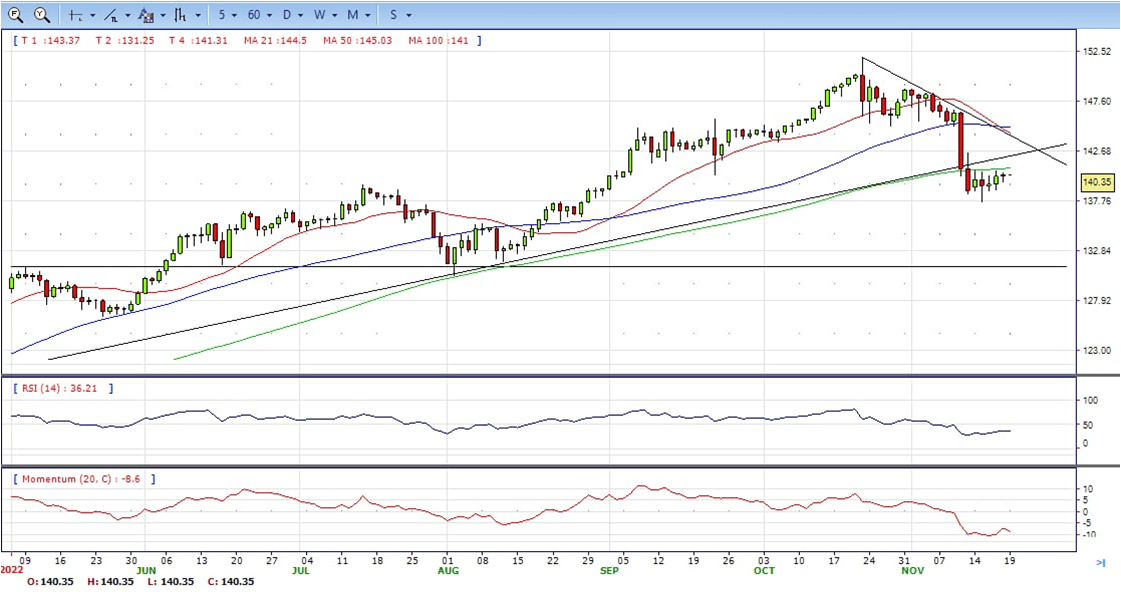
- The USD/JPY pair stabilized around 140.35, unchanged for the day and bearish in the daily chart. The price still maintains the downward slope and upside got strong resistance from 200 SMA, suggests bearish strength in short term. Meanwhile, 20 SMA started turning south and heading towards longer ones, indicating bears not exhausted. On upside, overcome 140.80 may encourage bulls to challenge 142.50, break above that level will open the gate to 145.30.
- Technical indicators suggest the bearish strength. RSI stabilized around 37, while the Momentum indicator continued developing below the midline, suggests downward potentials. On downside, the immediate support is 139.00, break below this level will open the gate to 137.60 area.
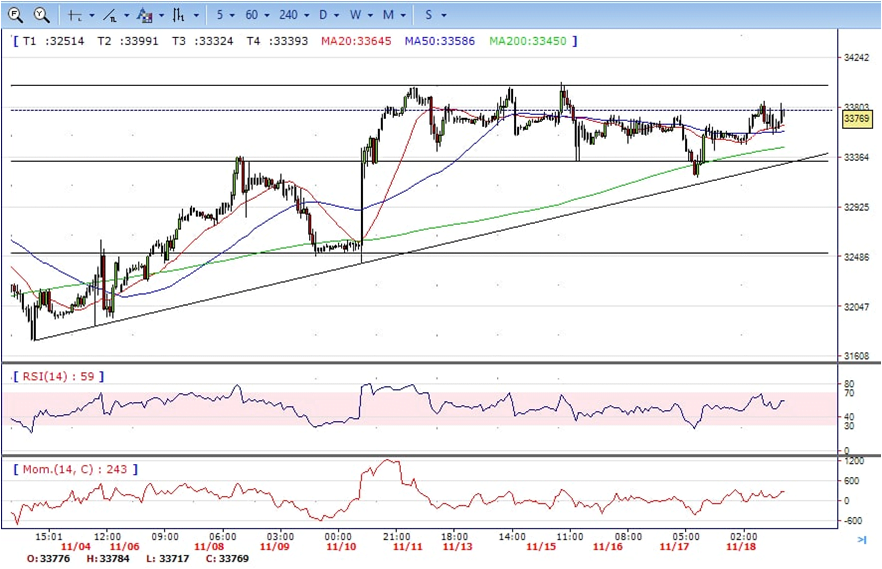
- DJI consolidated in the familiar range, traded between intraday high 33850 to intraday low 33560. It ended the week at around 33550, up for the day and neutral to bullish in the hourly chart. The price stabilized above 20 and 50 SMA, suggests bullish strength. Meanwhile, 20 and 50 SMA started turning flat but continued developing above 200 SMA, suggests bulls not exhausted in the long term yet. On upside, overcome 34030 may encourage bulls to challenge 34030, break above this level will open the gate to 34300.
- Technical indicators suggest the bullish strength. RSI stabilized around 60, while the Momentum indicator stabilized above the midline, suggests upward potentials. On downside, the immediate support is 33300, break below this level will open the gate for more decline to 33180 area.
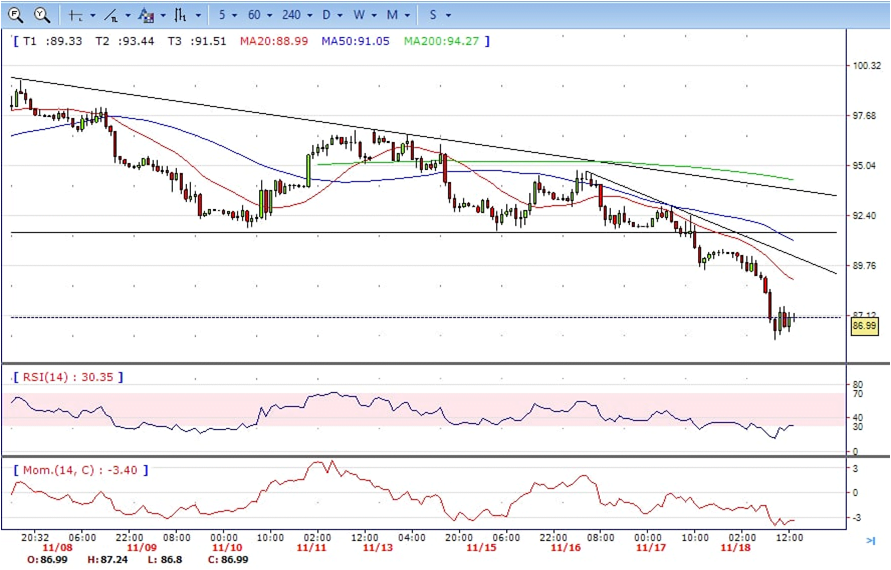
- Brent still under the strong sell pressure, retreated from intraday high 90.60 to intraday low 85.80 area, it then bounded modestly and ended Friday at around 86.90, down for the day and bearish in the hourly chart. The price stabilized below all main SMAs, suggests bearish strength in short term. Meanwhile, the 20 SMA continued accelerating south and developing below longer ones, indicating bearish bias. On upside, overcome 87.70 may encourage bulls to challenge 89.00, break above this level will open the gate to 90.70.
- Technical indicators suggest the bearish movement, hovering below the midline. RSI stabilized at around 31, while the Momentum indicator stabilized below the midline, suggests downward potentials. On downside, the immediate support is 85.80, break below this level will open the gate for more decline to 83.50 area.