20/04/2023 Daily Reports
- EUR/USD creeps lower in the mid-North American session as the financial markets are in a risk-off mode, expecting the next round of data that could rock the boat and give a clear direction to the pair. Inflation data in the EU maintained the EUR afloat, but high US Treasury bond yields cap the pair from reaching 1.1000. At the time of writing, the EUR/USD is trading at 1.0952, below its opening price by 0.15%.
- Wall Street is trading with losses. US Treasury bond yields continued to edge higher, with the 2-year, the most sensitive to shifts in monetary policy, up six bps at 4.267%. The CME FedWatch Tool shows a chance of 84% for a 25 bps rate hike by the Fed at the upcoming May meeting, weighing on investors’ mood. The latest round of US Federal Reserve (Fed) officials led by St. Louis Fed President James Bullard and Atlanta’s Raphael Bostic commented that inflation is too high, the labor market too tight, and the economy is solid. Both said that a recession is not their base case scenario.
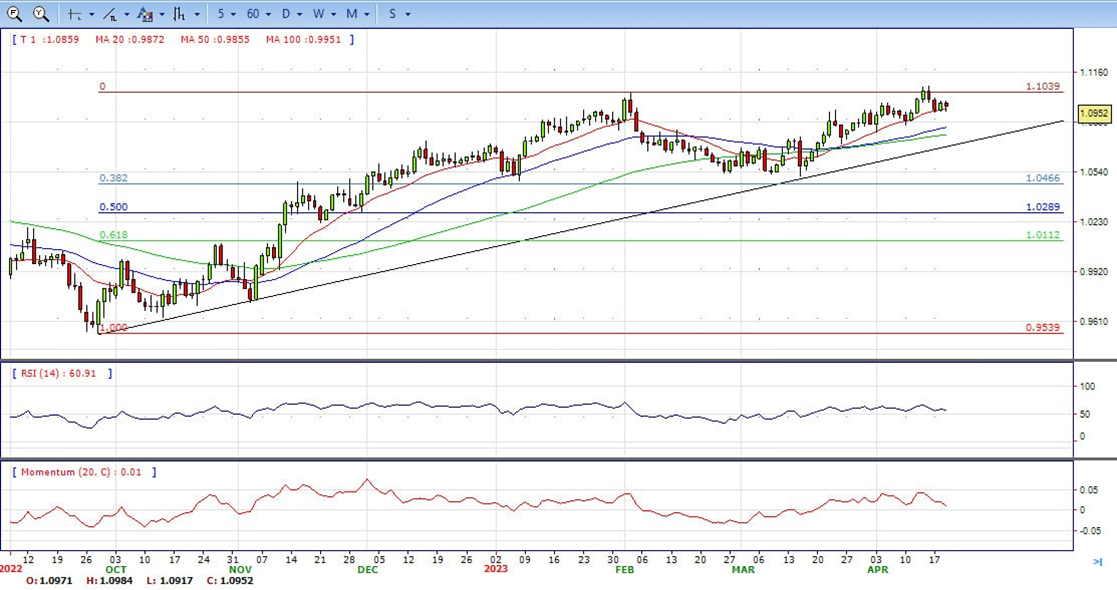
- The EUR/USD pair is trading near the 1.0952, down for the day with bullish stance in daily chart. The pair stabilized above 20 and 50 SMA, indicates bullish strength. Meanwhile, the 20 SMA continued accelerating north and heading towards 50 and 200 SMA, suggests bulls not exhausted yet. On upside, the immediate resistance is 1.1000, break above this level will extend the advance to 1.1070.
- Technical readings in the daily chart support the bullish stance. The RSI indicator stabilizes around 57. The Momentum indicator holds above the midline, indicating bullish potentials. On downside, the immediate support is 1.0900 and below this level will open the gate to 1.0830.
- GBP/USD is up 0.13% at the time of writing and has travelled between a low of 1.2392 and 1.2475 while data today confirmed that Britain has the highest inflation in Western Europe, solidifying the consensus that the Bank of England’s meeting in May will result in a rate hike.
- Data on Wednesday showed consumer prices rose by an annual 10.1%, the Office for National Statistics said, down from 10.4% in February but higher than the 9.8% forecast by economists polled by Reuters. However, the greenback has tamed the rally due to rising Treasury yields. The US Dollar index, which tracks the currency against a basket of its peers, was up 0.24% as markets turn more sceptical that the Federal Reserve will cut rates later this year. The yield on the two-year Treasury notes which are sensitive to Fed expectations has run to a high of 4.286%.
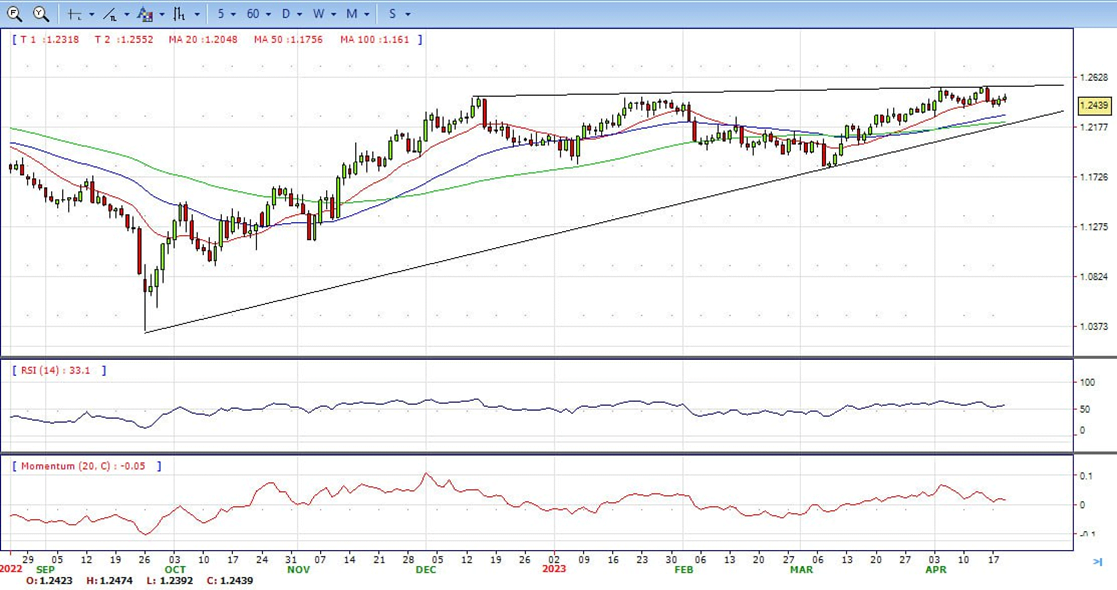
- The GBP/USD offers bullish stance in daily chart. Cable stabilizes above 20 and 50 SMA, indicating bullish strength in short term. Meanwhile, the 20 SMA continued accelerating north and developing far above longer ones, suggests bulls not exhausted yet. On upside, the immediate resistance is 1.2470 with a break above it exposing to 1.2550.
- Technical readings in the daily chart support the bullish stances. RSI indicator stabilizes around 57, while the Momentum indicator stabilizes above the midline, suggesting upward potentials. On downside, the immediate support is 1.2340, unable to defend this level will resume the decline to 1.2270.


- Gold price comes under intense selling pressure on Wednesday and tumbles to over a two-week low during the mid-European session. The XAU/USD is currently placed near the $1,970 area, down around 1.75% for the day, and seems poised to extend its recent pullback from over a one-year high touched last week.
- The US Dollar makes a solid comeback following the previous day’s modest decline and climbs back closer to the weekly high, which, in turn, is seen weighing heavily on Gold price. The messages from Fed officials have been very hawkish lately, supporting prospects for further policy tightening by the US central bank.
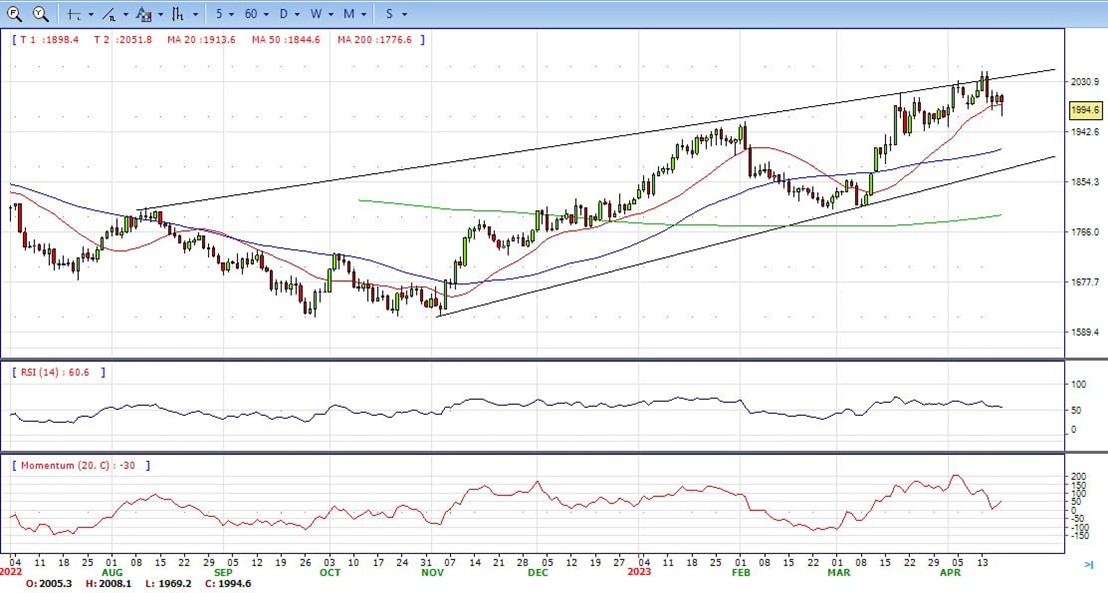
- Gold price stabilized around 1995, down for the day and bullish in the daily chart. The gold price still stabilizes above all main SMAs, suggesting bullish strength in short term. Meanwhile, the 20 continued accelerating north and developing far above 50 and 200 SMA, indicates bulls not exhausted yet. On upside, the immediate resistance is 2015, break above this level will open the gate for more advance to 2032 area.
- From a technical perspective, the RSI indicator holds above the mid-line and stabilizes around 57, on a bullish strength. The Momentum indicator hold in the positive territory, suggests upward potentials. On downside, the immediate support is 1969, below this area may resume the decline to 1950.


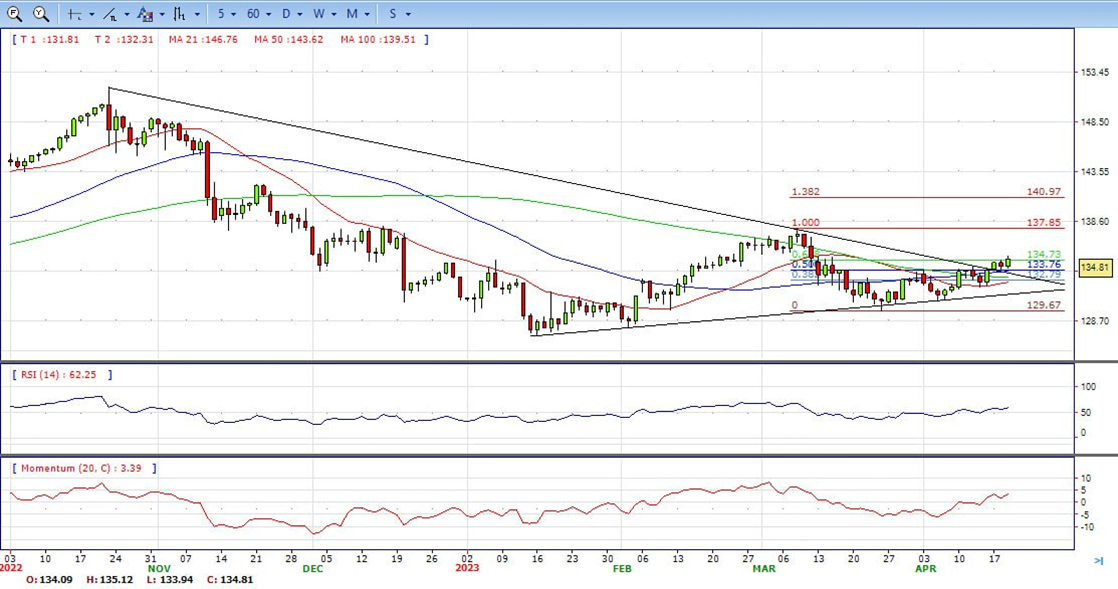
- USD/JPY rallied by 0.5% on the day and travelled between a low of 133.95 and a high of 135.13. The US Dollar strengthened on Wednesday, lifted by rising Treasury yields with the yield on two-year Treasury notes, which are sensitive to expectations for the US central bank’s monetary policy, added hit a one-month high of 4.286%.
- Earlier in the Asian trading hours, Industrial Production in Japan contracted at an annualized 0.5% in February, while the Reuters Tankan Index held steady at -3 in April. In the US, MBA Mortgage Applications shrank 8.8% in the week to April 14 ahead of the release of the Fed’s Beige Book later in the NA session. Indeed, the USD Index trades close to the 102.00 region, while yields extend the upside to levels last seen in mid-March. In Japan, the JGBP 10-year yields remain side-lined below the ley 0.50% region.
- The USD/JPY pair stabilized around 134.80, up for the day and bullish in the daily chart. The price stabilizes above 20 and 50 SMA, suggests bullish strength in short term. However, 20 SMA started turning flat but continued developing below longer ones, indicating bears not exhausted. On upside, overcome 135.15 may encourage bulls to challenge 137.00, break above that level will open the gate to 138.00.
- Technical indicators suggest the bullish strength. RSI stabilizes around 60, while the Momentum indicator stabilizes above the midline, suggests upward potentials. On downside, the immediate support is 133.70, break below this level will open the gate to 132.80 area.
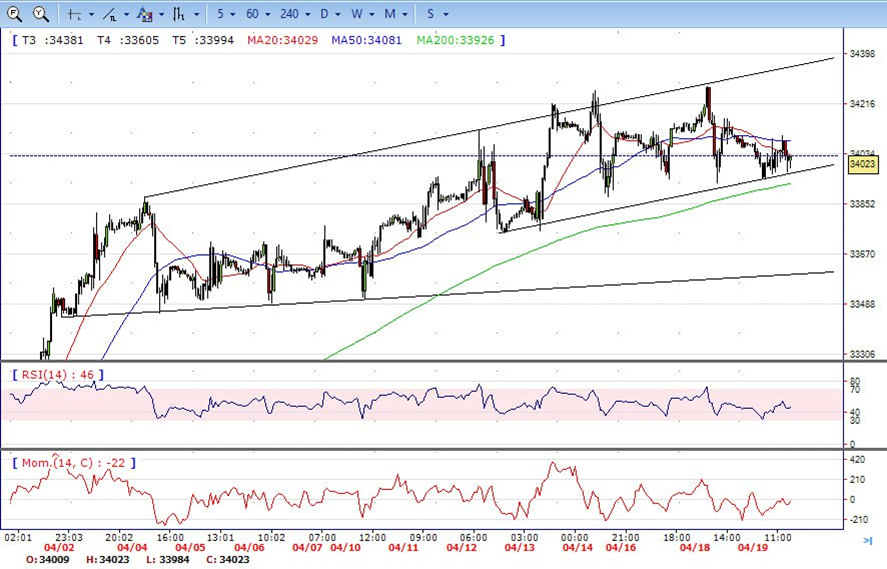
- DJI under the sell pressure on Wednesday. It tumbled to low 33940 area, then recovered modestly and ended the day around 34020, down for the day and indicates bearish sign in the hourly chart. Right now market is standing below 20 and 50 SMA, suggests bearish strength. Meanwhile, 20 SMA started turning south but continued developing far above 200 SMA, suggests bulls not exhausted yet. On upside, overcome 34260 may encourage bulls to challenge 34410, break above that level will open the gate to 34750.
- Technical indicators suggest the bearish movement. RSI stabilizes around 46, while the Momentum indicator stabilizes below the midline, suggests downward potentials. On downside, the immediately support is 33870, break below this level will open the gate for more decline to 33730 area.
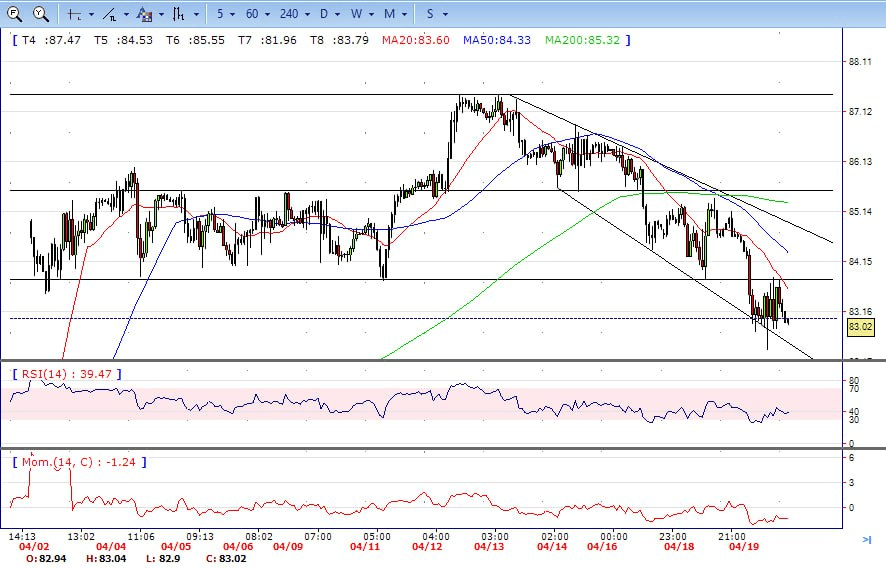
- Brent still under the sell pressure on Wednesday, tumbled to intraday low 82.40 and then recovered modestly and ended the day around 83.00, down for the day and indicates bearish sign in the hourly chart. Meanwhile, the 20 SMA continued accelerating south and developing far below longer ones, indicates bears not exhausted yet. On upside, overcome 83.90 may encourage bulls to challenge 85.50, break above that level will open the gate to 86.60.
- Technical indicators also suggest bearish movement, hovering below the midline. RSI stabilizes at 39, while the Momentum indicator stabilizes in negative territory, suggests downward potentials. On downside, the immediately support is 82.40, break below this level will open the gate for more decline to 80.00 area.