2/11/2022 Daily Reports
- EUR/USD abandons the area of daily highs around 0.9950 and makes an abrupt U-turn to revisit the sub-0.9900 zone in the wake of US data results on Tuesday.
- EUR/USD rapidly drops and revisits the area below 0.9900 on the back of an equally sudden rebound in the dollar, all in response to the better-than-expected prints from the US ISM Manufacturing for the month of October (50.2). Additional releases in the US calendar saw Construction Spending unexpectedly expand 0.2% MoM in September, the final S&P Global Manufacturing PMI at 50.4 (also surpassing estimates) and the JOLTs Job Openings increase to 10.717M also in September.
- In the meantime, price action around the European currency is expected to closely follow dollar dynamics, geopolitical concerns and the Fed-ECB divergence. The resurgence of speculation around a potential Fed’s pivot seems to have removed some strength from the latter, however.
- The EUR/USD pair is trading near the 0.9875, unchanged for the day with the neutral to bullish stance in daily chart. The pair struggled near 20 and 50 SMA, indicates neutral strength. Meanwhile, the 20 SMA started turning north and heading towards longer ones, suggests bulls not exhausted yet. On upside, the immediate resistance is 1.0000, break above this level will extend the advance to 1.0100.
- Technical readings in the daily chart support the neutral to bullish stances. The RSI indicators hovering near the midlines and stabilized around 50. The Momentum indicator stabilized near the midline, indicating directionless potentials. On downside, the immediate support is 0.9850 and below this level will open the gate to 0.9780.

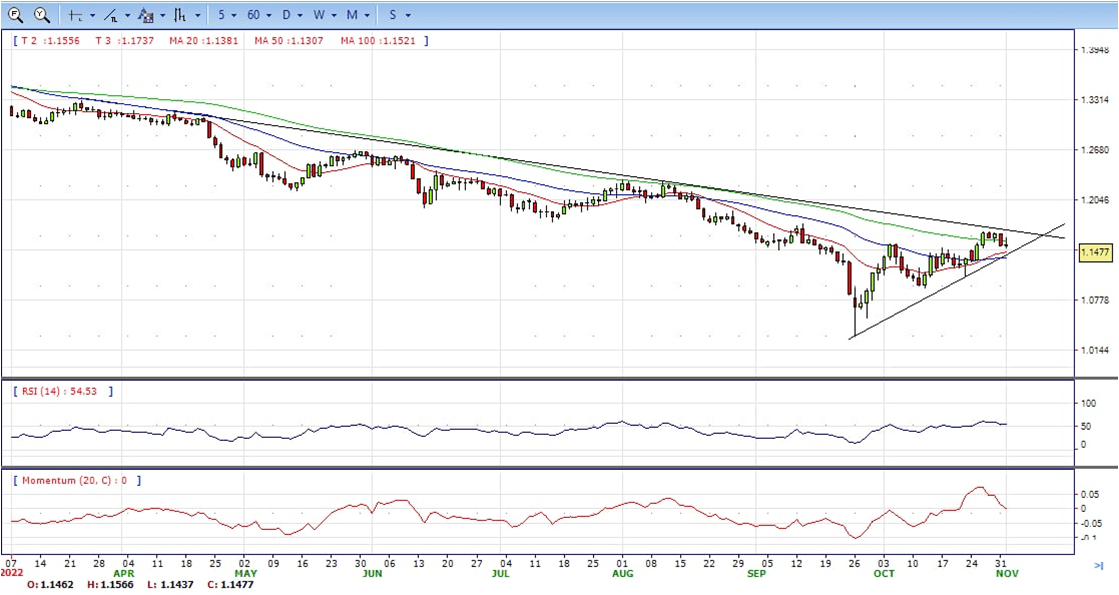
- Sterling’s reversal from session highs at 1.1565 witnessed on Tuesday’s morning US session has found buyers at 1.1450, allowing the pair to return to levels near 1.1480. Cable almost unchanged for the daily and bullish in the daily chart.
- The positive market sentiment witnessed during the Asian and European sessions, which pushed the GBP to the mid-1. 1500 range, vanished during the North American session. A series of upbeat US macroeconomic indicators challenged the theory of a softer Fed tightening in the months ahead and sent the US dollar surging.
- Manufacturing activity beat expectations in October, with the US S&P and the ISM PMI’s posting better than expected results, while the JOLTS job openings confirmed the tight US labor market conditions. These figures have eased concerns about the possibility of a softer economic scenario that would force the US central bank to adopt a more accommodative stance.
- The GBP/USD offers bullish stance in daily chart. Cable still stabilized above 20 and 50 SMAs, indicating bullish strength in short term. Meanwhile, the 20 SMA continued accelerating north and heading towards longer ones, suggests bulls not exhausted yet. On upside, The immediate resistance is 1.1650 with a break above it exposing to 1.1740.
- Technical readings in the daily chart support the neutral to bullish stances. RSI indicator stabilized around 55, while the Momentum indicator stabilized near the midline, suggesting directionless potentials. On downside, the immediate support is 1.1340, unable to defend this level will resume the decline to 1.1200.


- Gold price advances in the North American session due to a fall in US Treasury yields weakening the US Dollar, following the release of solid US data, namely factory activity. At the time of writing, XAU/USD is trading at $1647, up by 0.89%.
- In the United States, economic data revealed by the Institute for Supply Management (ISM), alongside S&P Global, showed the economy’s resilience. Firstly the ISM Manufacturing Index came better than estimated at 50.2 vs. 50 forecasts, while a subcomponent that measures prices fell to more than a two-year low. Timothy Fiore, Chairman of the ISM Manufacturing Business Survey Committee, commented that October’s report reflects companies are getting ready for an adjustment for lower demand.
- At the same time, the US Department of Labor reported that job openings in September surprisingly rose, as the JOLTS report showed an increase of close to 500K, to 10.717M from August’s 10.28M, and exceeding estimates of 10M.
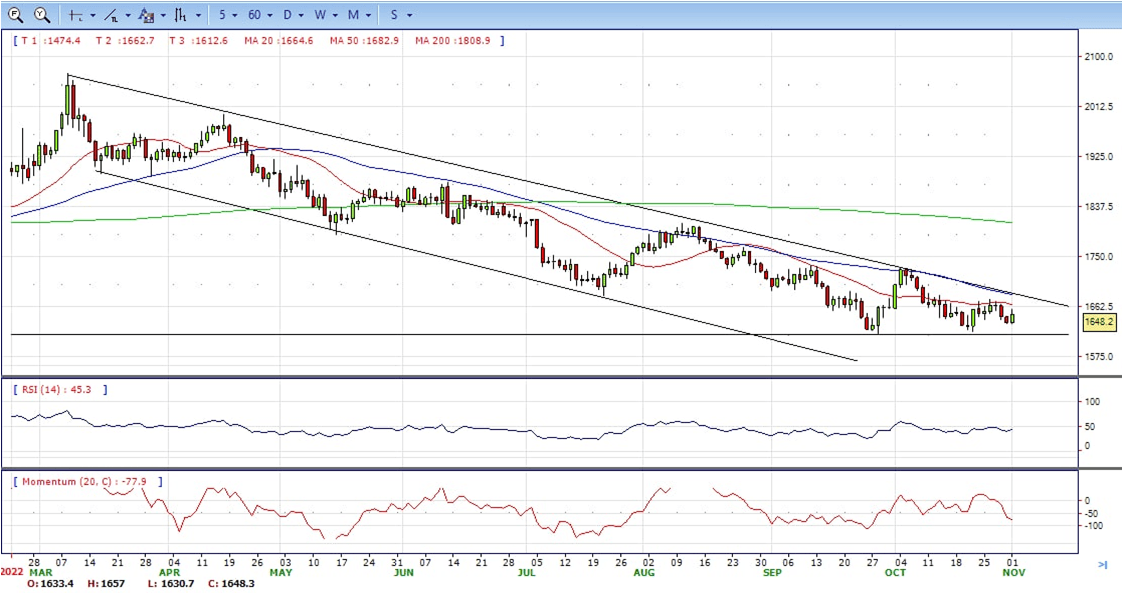
- Gold price stabilized around 1647, up for the day and bearish in the daily chart. The gold price stabilized below 20 and 50 SMA, suggesting bearish strength. Meanwhile, the 20 SMA continued developing below longer ones despite it started turning flat, indicating bears not exhausted yet. On upside, the immediate resistance is 1675, break above this level will open the gate to extend the advance to 1686 area.
- From a technical perspective, the RSI indicator hold below the midline and stabilized around 46, suggesting bearish strength. The Momentum indicator struggled below the midline, suggests downward potentials. On downside, the immediate support is 1614, below this area may resume the decline to 1600.


- The pair surged from session lows at 147.00 to pare losses from the Asian and European sessions and return to levels above 148.00. The release of a set of better-than-expected US macroeconomic indicators has boosted a hitherto weak US dollar.
- Macroeconomic figures from the US rattled FX markets on Tuesday, improving the sentiment about the US economic momentum and undermining the idea that the Federal Reserve might be forced to consider slowing down its monetary tightening path in December. This new scenario has sent the dollar and US treasury bond yields surging.
- The US Federal Reserve’s monetary policy meeting, due on Wednesday remains the main attraction this week. The Fed is widely expected to hike rates by 75 basis points, but the market was increasingly confident that the bank would signal a softer hike in December, a theory that has come into question after today’s releases.
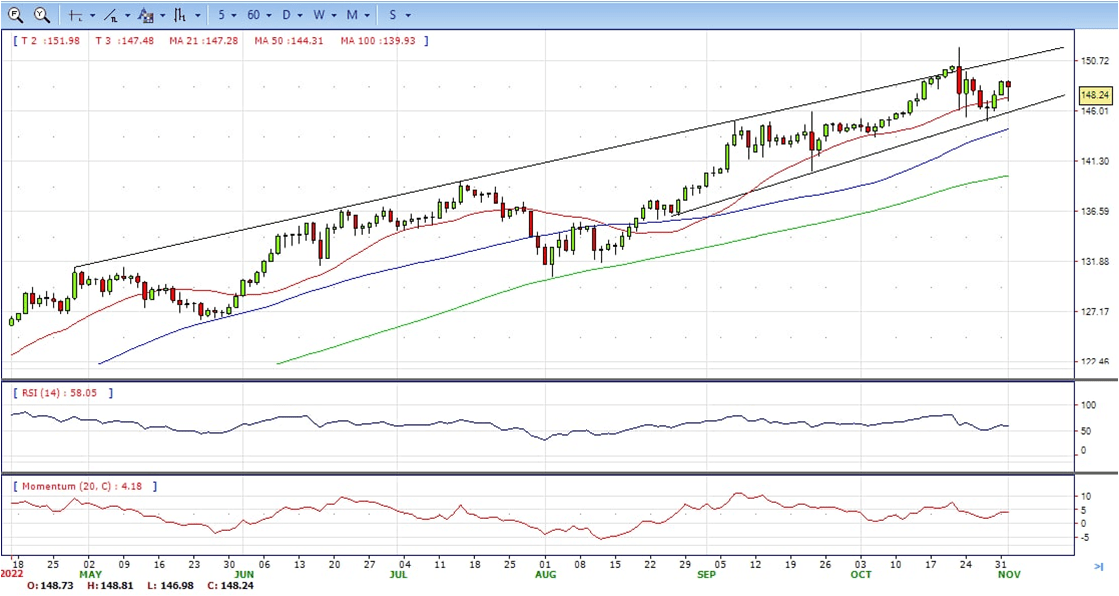
- The USD/JPY pair stabilized around 148.20, down for the day and bullish in the daily chart. The price still maintains the upward slope and stabilized above all main SMAs, suggests bullish strength in short term. Meanwhile, 20 SMA continued accelerating north and developing above longer ones, indicating bulls not exhausted. On upside, overcome 149.70 may encourage bulls to challenge 151.00, break above that level will open the gate to 152.00.
- Technical indicators suggest the bullish strength. RSI stabilized around 58, while the Momentum indicator continued developing above the midline, suggests upward potentials. On downside, the immediate support is 147.00, break below this level will open the gate to 145.00 area.
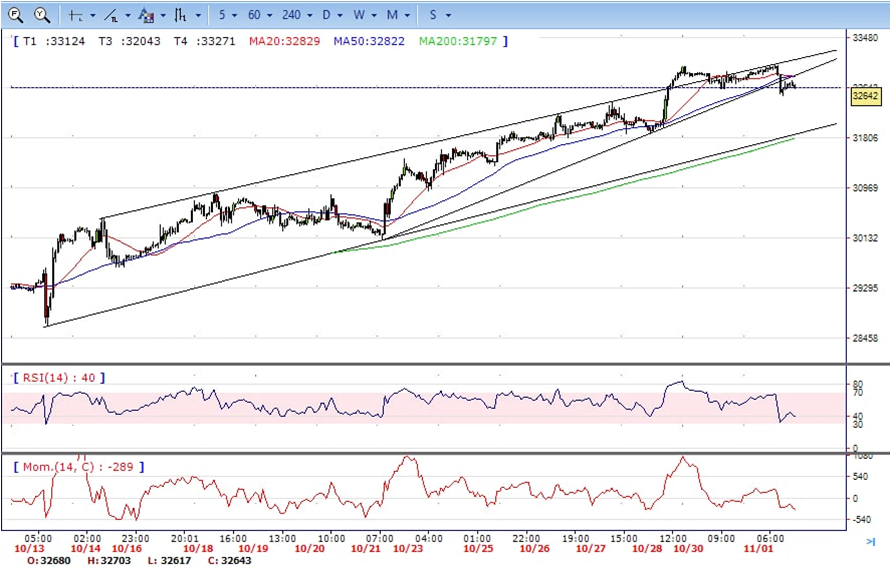
- DJI under the sell pressure, retreated from intraday high 33011 area to 32511 daily low. It recovered some losses and ended Tuesday at around 32640, down for the day and bearish in the hourly chart. The price stabilized below 20 SMA and 50 SMA, suggests bearish strength. Meanwhile, the pair broke below the bullish trend line and 20 SMA started turning south and heading towards longer ones, suggests bears not exhausted yet. On upside, overcome 33000 may encourage bulls to challenge 33300, break above this level will open the gate to 33530.
- Technical indicators suggest the bearish strength. RSI stabilized around 40, while the Momentum indicator stabilized below the midline, suggests downward potentials. On downside, the immediate support is 32500, break below this level will open the gate for more decline to 32200 area.
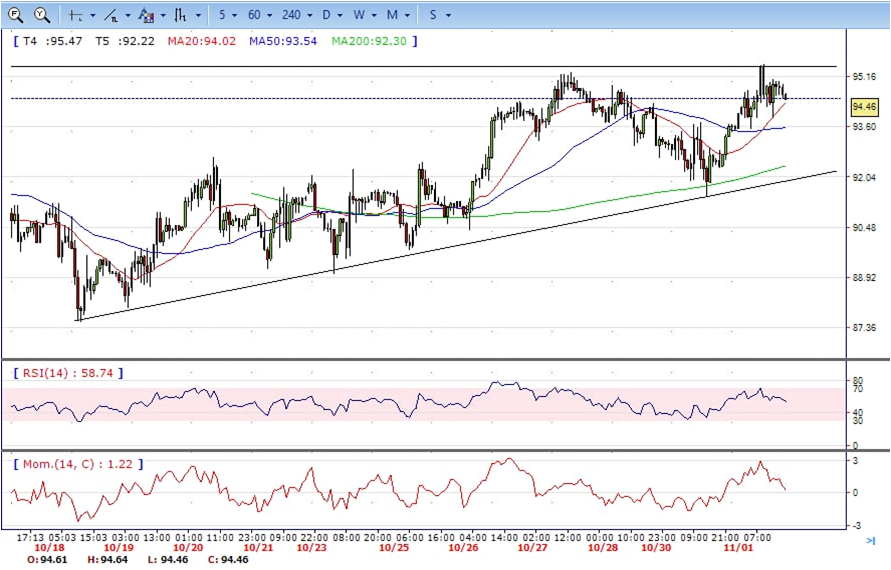
- Brent continued the advance , climbed from intraday low 92.30 to intraday high 95.54, it retreated modestly and ended Tuesday at around 94.60, up for the day and bullish in the hourly chart. The price stabilized above 20 and 50 SMA, suggests bullish strength in short term. Meanwhile, the 20 SMA continued accelerating north and developing above 50 SMA, indicating bulls not exhausted yet. On upside, overcome 95.60 may encourage bulls to challenge 97.00, break above this level will open the gate to 98.00.
- Technical indicators suggest the bullish movement, hovering above the midline. RSI stabilized at around 56, while the Momentum indicator stabilized in positive territory, suggests upward potentials. On downside, the immediate support is 93.00, break below this level will open the gate for more decline to 91.50 area.