EUR/USD
- The EUR/USD remains subdued on Friday, following monetary policy meetings by the Fed and the ECB, with both entities raising rates amidst a period of high and stickier inflation. The pair ended Friday at around 1.0590, still bullish in the daily chart.
- Investors’ sentiment remains sour after worldwide central banks continue to tighten monetary conditions. A light US economic docket featured the release of the S&P Global PMI for December missed the estimates, reigniting recessionary fears in the US economy. Manufacturing PMI dived to 46.2 vs. 47.8 expected, while the Services Index slid to 44.4 from 46.5 foreseen. Consequently, the S&P Global Composite Index dropped to 44.6 against the estimated 46.9.
- Meanwhile, the calendar was busy in the European session, with S&P Global PMIs released for the Euro area, France and Germany, with most of the figures being better than expected. Regarding the HICP, inflationary data for the Eurozone was 10.1% YoY, below the 10.6% of the previous month, though higher than the estimate of 10% reading. The core reading was unchanged at 5%.
- The EUR/USD pair is trading near the 1.0590, down for the day with bullish stance in daily chart. The pair stabilized above 20 and 50 SMA, indicates bullish strength. Meanwhile, the 20 SMA continued accelerating north and developing far above longer ones, suggests bulls not exhausted yet. On upside, the immediate resistance is 1.0670, break above this level will extend the advance to 1.0740.
- Technical readings in the daily chart support the bullish stances. The RSI indicators hovering above the midline and stabilized around 64. The Momentum indicator stabilized above the midline, indicating upward potentials. On downside, the immediate support is 1.0580 and below this level will open the gate to 1.0500.

Open A Demo
CDO has wide range of tools, professional and friendly support for clients to achieve their financial markets trading goals. Open a live account now to enjoy this experience with virtual deposit.
GBP/USD
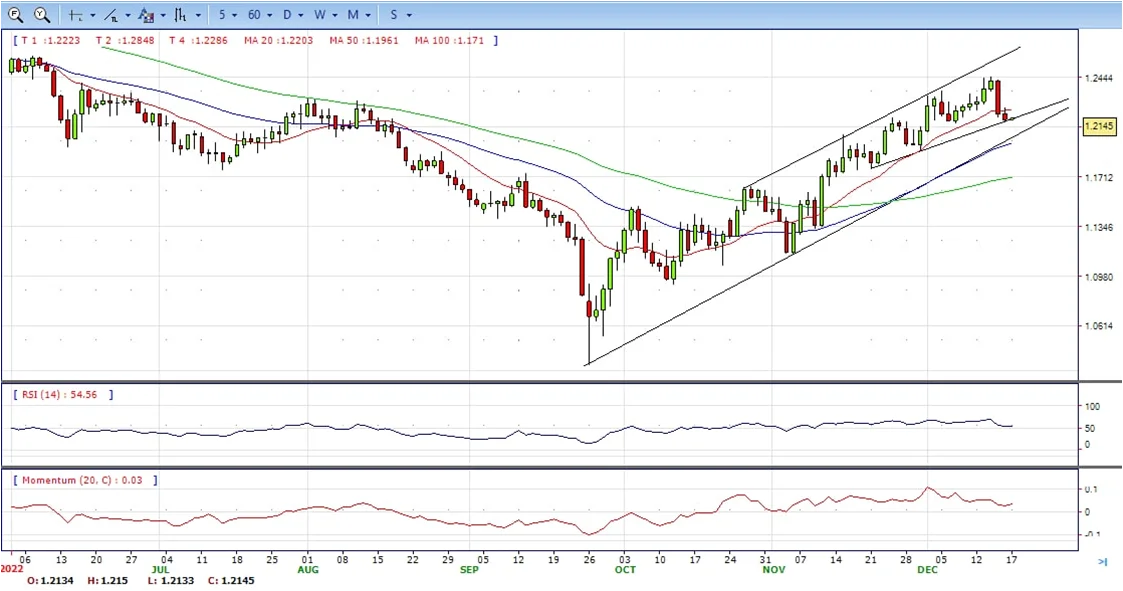
- The GBP/USD pair struggles to capitalize on its modest intraday bounce from the 1.2120 area, or over a one-week low and remains on the defensive through the early North American session. It ended the week at around 1.2150, still bullish in the daily chart.
- A combination of factors undermines the British Pound, which, along with some dip-buying around the US Dollar, acts as a headwind for the GBP/USD pair. A dovish outcome from the Bank of England meeting on Thursday, with two MPC members voting to keep interest rates unchanged, undermines the GBP, which is further pressured by the disappointing UK macro data.
- The UK Office for National Statistics reported that domestic Retail Sales fell 0.4% in November and were down 5.9% YoY. Furthermore, sales excluding volatile auto and fuel dropped by 0.3% during the reported month, missing consensus estimates. The data fuels concerns that the economy has entered a prolonged recession and favours the GBP/USD bears.
- The GBP/USD offers bullish stance in daily chart. Cable still stabilized above 50 SMA, indicating bullish strength in short term. Meanwhile, the 20 SMA continued developing above longer ones despite it started turning flat, suggests bulls not exhausted yet. On upside, The immediate resistance is 1.2250 with a break above it exposing to 1.2340.
- Technical readings in the daily chart support the bullish stances. RSI indicator stabilized around 54, while the Momentum indicator stabilized above the midline, suggesting upward potentials. On downside, the immediate support is 1.2100, unable to defend this level will resume the decline to 1.2000.

CDO TRADER
CDO TRADER, our cutting-edge trading platform, follows the technology from the forefront with new features added continuously. Moreover, CDO TRADER is now available for Android and iOS! So it allows you to trade on the go!
XAU/USD
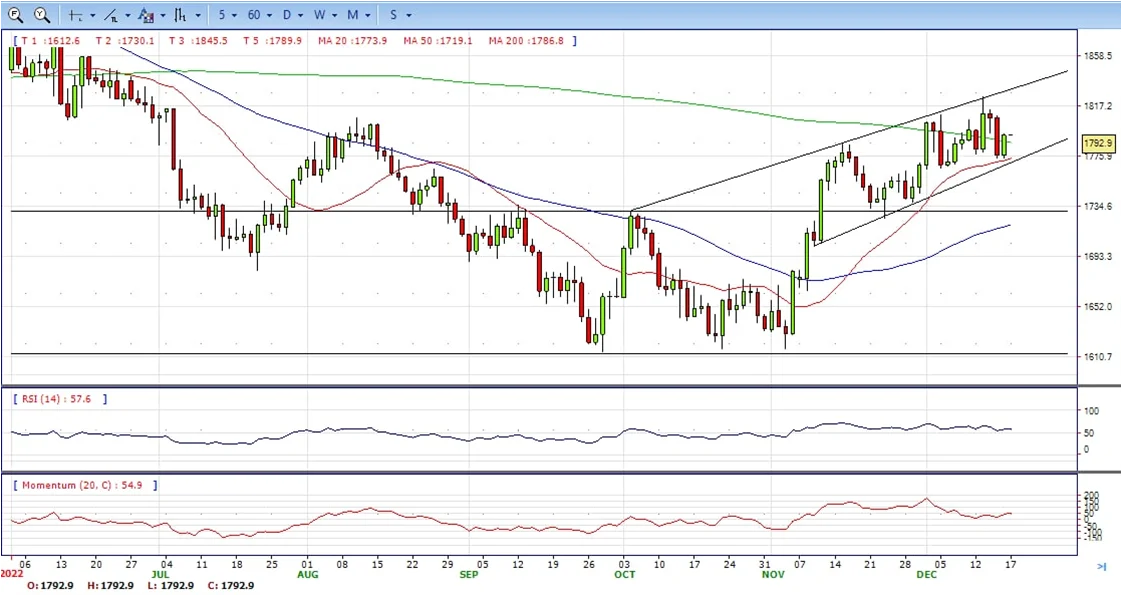
- Gold price rebounded further from weekly lows following the release of the US S&P Global PMI report, hitting a fresh daily high at $1,793. It is about to end the week at the same level it had seven days ago, still bullish in the daily chart.
- The price broke above $1,785 after the release of the US S&P Global PMI report that came in below expectations. According to the preliminary report, in December the S&P Global Manufacturing PMI fell from 47.7 to 46.2, against market consensus of 47.7. The S&P Global Services PMI fell unexpectedly from 46.2 in November to 44.4 in December.
- The US Dollar, on the other hand, draws support from a goodish pickup in the US Treasury bond yields, bolstered by a hawkish commentary by the Federal Reserve earlier this week. In fact, the US central bank signalled that it will continue to raise rates to crush inflation and projected at least an additional 75 bps increase in borrowing costs by the end of 2023.
- Gold price stabilized around 1793, dup for the day and bullish in the daily chart. The gold price still stabilized above 20 and 50 SMA, suggesting bullish strength in short term. Meanwhile, the 20 SMA continued accelerating north and developing above 50 SMA, indicating bulls not exhausted yet. On upside, the immediate resistance is 1796, break above this level will open the gate to extend the advance to 1814 area.
- From a technical perspective, the RSI indicator hold above the midline and stabilized around 58, suggesting bullish strength. The Momentum indicator stabilized above the midline, suggests upward potentials. On downside, the immediate support is 1775, below this area may resume the decline to 1744.
MetaTrader 4
MT4 has user friendly interface that is providing simplicity and efficiency. The traders can perform trading strategies for different products like Forex and CFD. MetaTrader 4 has over 50 built-in indicators, also it’s the tool that predicts trends and defines the appropriate entry and exit points.

USD/JPY
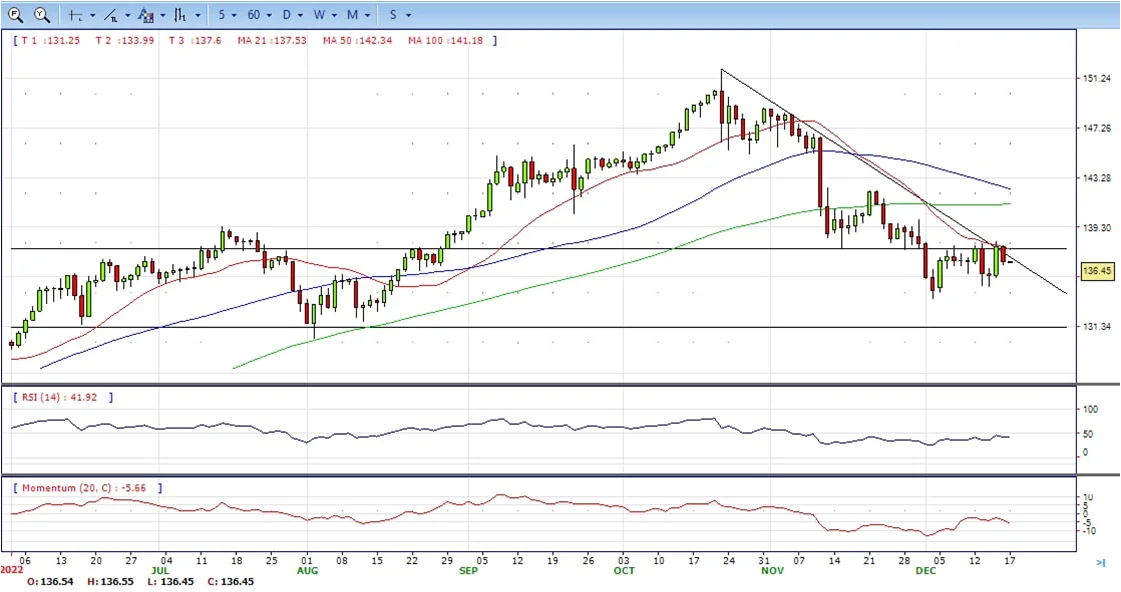
- The USD/JPY fell after testing the 137.88 area and dropped below the 137.00 mark in the North American session amid a risk-off impulse. It ended Friday at around 136.70, still bearish in the daily chart.
- The US Dollar struggles to capitalize on the overnight recovery move from a six-month low and comes under some renewed selling pressure on the last day of the week. This, in turn, is seen as a key factor acting as a headwind for the USD/JPY pair. That said, the Fed’s hawkish outlook should help revive the USD demand and lend some support to the major, at least for the time being.
- It is worth recalling that the US central bank struck a more hawkish tone on Wednesday and signalled that it will continue to raise rates to crush inflation. In the so-called dot plot, policymakers projected at least an additional 75 bps increases in borrowing costs by the end of 2023 and see the terminal rate rising to 5.1%, higher than the 4.6% level forecasted in September.
- The USD/JPY pair stabilized around 136.70, down for the day and neutral to bearish in the daily chart. The price still maintains the downward slope and develops below all main SMAs, suggests bearish strength in short term. Meanwhile, 20 SMA continued accelerating south and developing below longer ones, indicating bears not exhausted. On upside, overcome 137.40 may encourage bulls to challenge 138.20, break above that level will open the gate to 139.50.
- Technical indicators suggest the bearish strength. RSI stabilized around 43, while the Momentum indicator continued developing below the midline, suggests downward potentials. On downside, the immediate support is 136.00, break below this level will open the gate to 134.50 area.
DJI
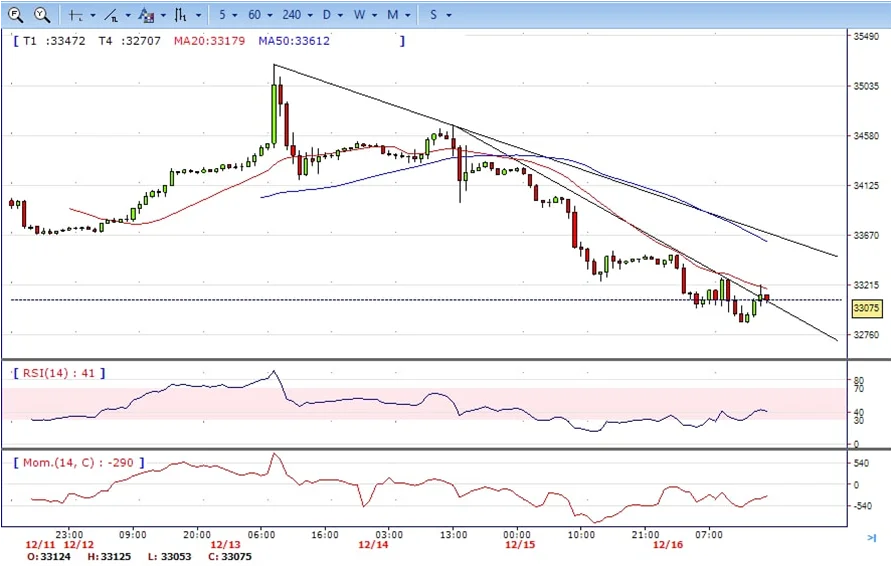
- DJI still under the strong sell pressure, tumbled from intraday high 34490 to intraday low 32870 level. It recovered modestly and ended Friday at 33075, down for the day and bearish in the daily chart. The price stabilized below 20 and 50 SMA, suggests bearish strength in short term. Meanwhile, 20 SMA started turning south and heading towards 50 SMA, suggests bears not exhausted yet. On upside, overcome 33300 may encourage bulls to challenge 33500, break above this level will open the gate to 33930.
- Technical indicators indicates the bearish strength. RSI stabilized around 40, while the Momentum indicator stabilized in negative territory, suggests downward potentials. On downside, the immediate support is 32870, break below this level will open the gate for more decline to 32600 area.
BRENT
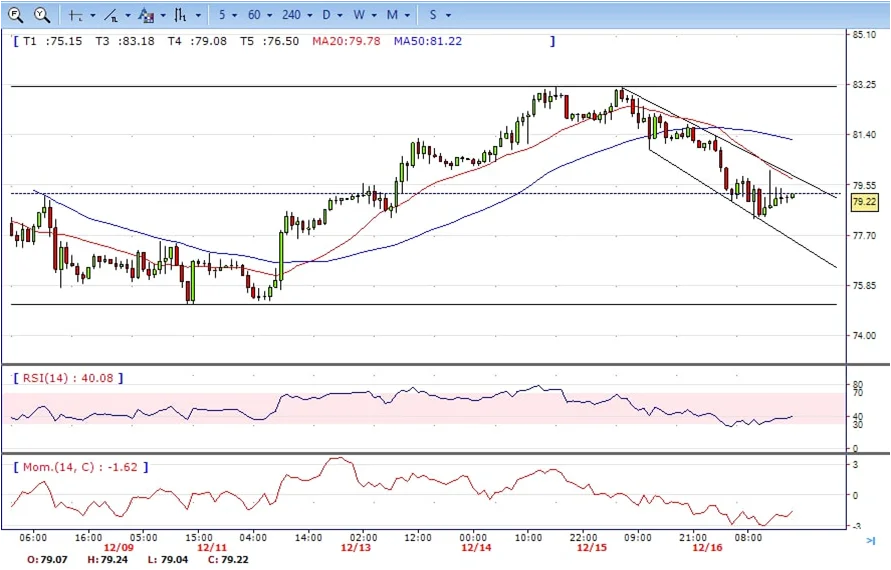
- Brent still under the sell pressure, failed to break above 81.80 area and turned its direction to downside. It tumbled to intraday low 78.30 and ended Friday at around 79.20, down for the day and bearish in the hourly chart. The price stabilized below 20 and 50 SMAs, suggests bearish strength in short term. Meanwhile, the 20 SMA continued accelerating south and developing below 50 SMA, indicating bearish bias. On upside, overcome 80.00 may encourage bulls to challenge 81.40, break above this level will open the gate to 83.20.
- Technical indicators suggest the bearish movement, hovering below the midline. RSI stabilized at around 40, while the Momentum indicator stabilized below the midline, suggests downward potentials. On downside, the immediate support is 78.30, break below this level will open the gate for more decline to 77.00 area.
Contact Us
Please, fill the form to get an assistance.


