18/01/2023 Daily Reports
- The euro is under pressure on Tuesday, under control by bears and falling from a high of 1.0869 to a fresh low of 1.0773. It ended the day around 1.0790 and still bullish in the daily chart.
- ECB policymakers are starting to consider a slower pace of interest-rate hikes after a likely 50 basis-point step in February, sources say as reported by Bloomberg.
- However, President Christine Lagarde indicated in December, a higher pace of tightening than indicated above, laying down the foundations for a 50 basis-point step in February. Nevertheless, the prospect of a smaller 25-point increase at the following meeting in March now has traction in the markets, despite officials saying today that no decisions have been taken, and that policymakers may still deliver the half-point move for the March meeting that Lagarde penciled in on Dec 15.
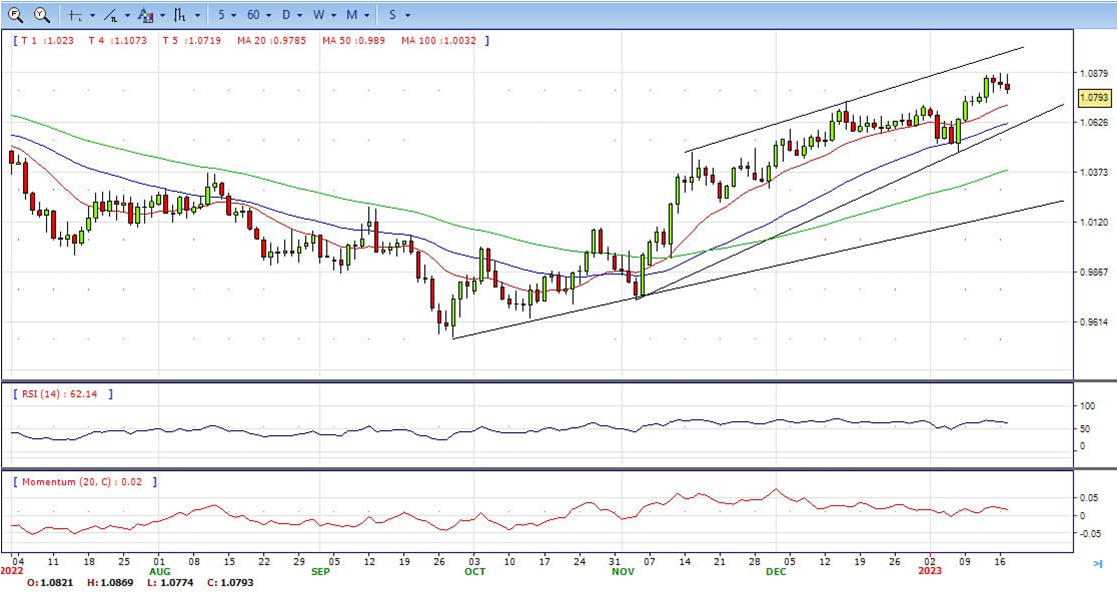
- The EUR/USD pair is trading near the 1.0790, down for the day with bullish stance in daily chart. The pair still stabilized above 20 and 50 SMA, indicates bullish strength. Meanwhile, the 20 SMA continued accelerating north and developing far above longer ones, suggests bulls not exhausted yet. On upside, the immediate resistance is 1.0870, break above this level will extend the advance to 1.0950.
- Technical readings in the daily chart support the bullish stance. The RSI indicator is above 50. The Momentum indicator stabilizes in positive territory, indicating bullish potentials. On downside, the immediate support is 1.0770 and below this level will open the gate to 1.0710.
- GBP/USD is higher by 0.6%, moved from a low of 1.2168 to a high of 1.2300 on Tuesday after Britain’s Unemployment Rate data showed a tight labour market and accelerating pay growth. The Bank of England, BoE, is in focus in this regard as it battles with inflation at multi-decade highs.
- Britain’s Unemployment Rate held at 3.7%, close to its lowest level in almost 50 years. This was in line with the consensus and signalled a continued tight labour market. Pay excluding bonuses increased by an annual 6.4% in the September-to-November period, this was the largest increase since records began in 2001.
- The ONS’s inflation data on Wednesday is expected to be the next major trigger for the pound ahead of the BoE’s meeting next month. The consumer price index is expected to have eased to 10.5% on an annual basis last month from 10.7% in November.
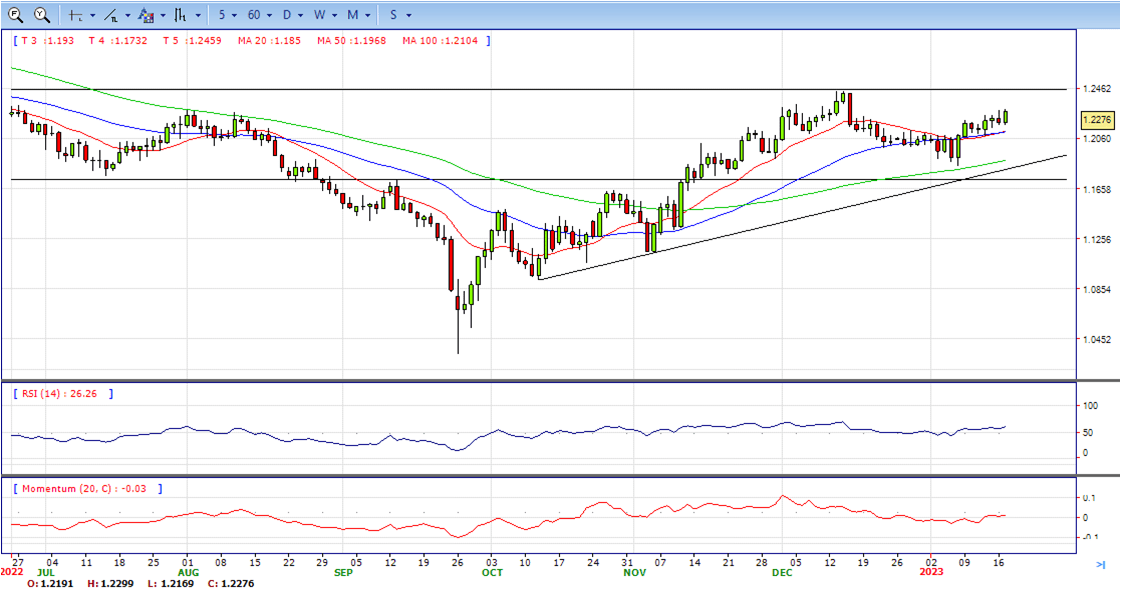
- The GBP/USD offers bullish stance in daily chart. Cable stabilizes above 20 and 50 SMA, indicating bullish strength in short term. Meanwhile, the 20 and 50 SMA continues accelerating north and developing above 200 SMA, suggests bulls not exhausted yet. On upside, The immediate resistance is 1.2300 with a break above it exposing to 1.2450.
- Technical readings in the daily chart support the bullish stances. RSI indicator stabilizes around 60, while the Momentum indicator stabilizes above the midline, suggesting upward potentials. On downside, the immediate support is 1.2150, unable to defend this level will resume the decline to 1.2080.


- Gold price retreats from daily highs nearby $1,920 and drops beneath the $1,910 mark, aiming toward $1,900 amidst a risk-off impulse. Even though the US Dollar continues to trade with losses, and US Treasury bond yields are bear flattening, the non-yielding metal losses traction. At the time of writing, the XAU/USD is trading at $1,908.
- Risk aversion is the name of the game, as US equities dropped. Corporate earnings in the US are one of the reasons for a dampened mood. US economic data revealed by the New York Fed showed that manufacturing activity and business conditions worsened. Speculations that the Fed might pivot improved, with traders expecting a 25 bps rate hike in the February 1 decision.
- US data released that Manufacturing activity in New York plunged to its lowest in January, with business activity contracting sharply, with the index falling 22 points to -32.9. The report showed that new orders and shipments declined substantially, while delivery times were unchanged and inventories edged higher.
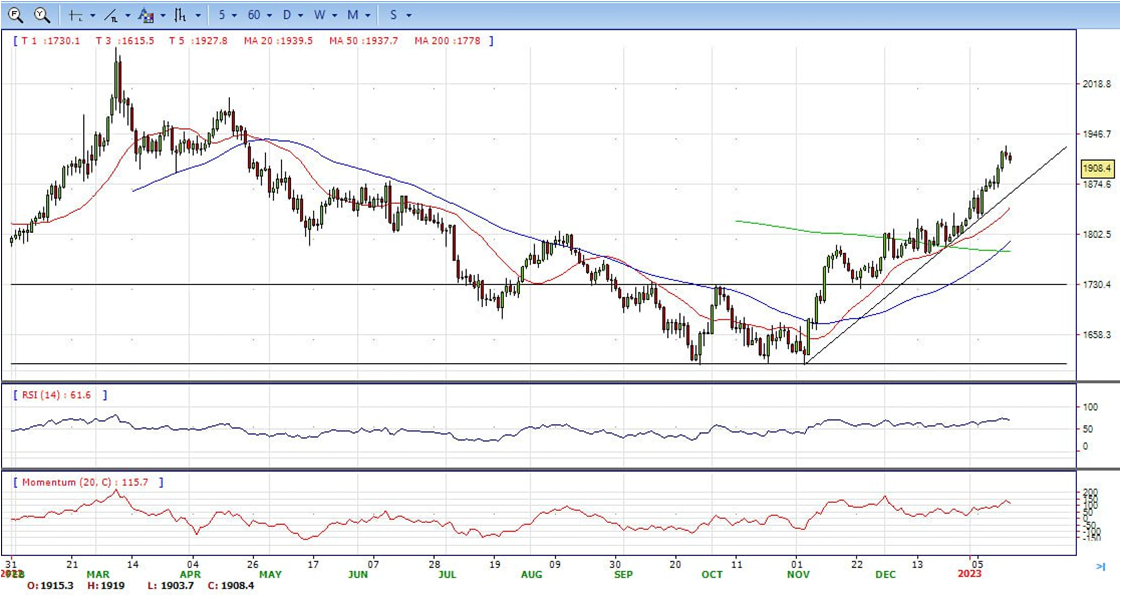
- Gold price stabilized around 1908, slightly down for the day and bullish in the daily chart. The gold price still stabilized above 20 and 50 SMA, suggesting bullish strength in short term. Meanwhile, the 20 SMA continued accelerating north and developing above 50 SMA, indicating bulls not exhausted yet. On upside, the immediate resistance is 1930, break above this level will open the gate for more advance to 1950 area.
- From a technical perspective, the RSI indicator holds above the mid-line and stabilizes around 70, still on a bullish strength. The Momentum indicator continues developing in positive territory, suggests more upside potentials. On downside, the immediate support is 1900, below this area may resume the decline to 1880.


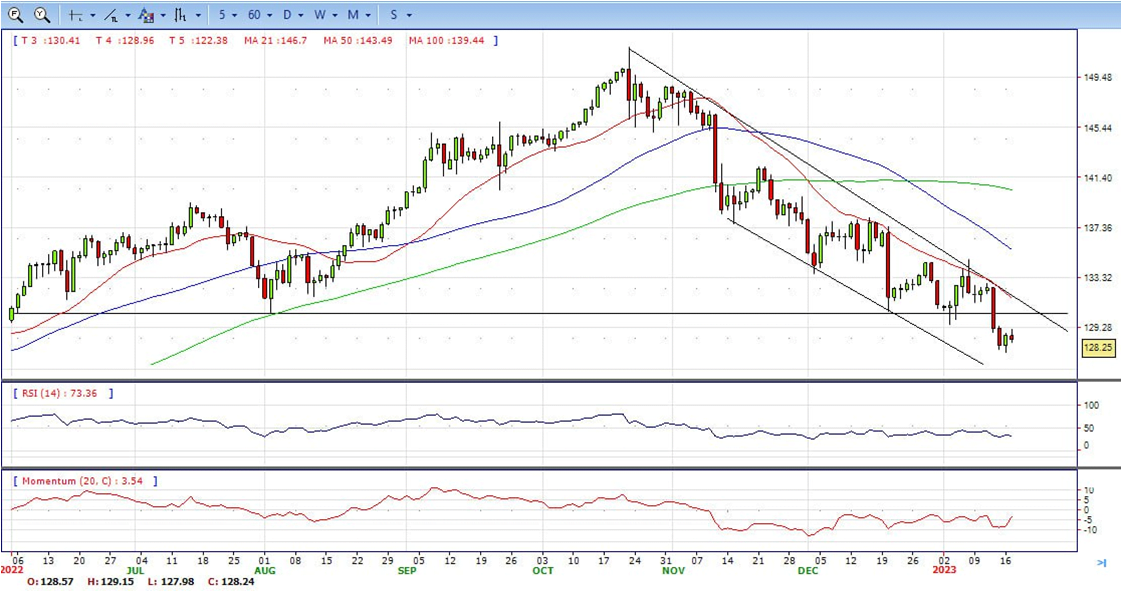
- USD/JPY clings to its earlier gains as the North American session begins, though it’s retracing after hitting daily highs of 129.15 before the Wall Street open. The US Dollar is giving back earlier gains while sentiment continues to deteriorate. At the time of writing, the USD/JPY is trading at 128.23, down for the day and bearish in the daily chart.
- Wall Street is set to open lower as US stock futures remain in negative territory. The greenback is fallen off the cliff, as shown by the US Dollar Index, down 0.57% at 101.984. The US 10-year Treasury bond yield, which usually correlates closely with the USD/JPY pair, trims its gains and sits at 3.535%, unchanged.
- The USD/JPY reaction to it was muted as traders braced for the two-day monetary policy decision of the Bank of Japan. Expectations for a rate hike are very slim, though the March meeting jumped by 45%. Market analysts think that the BoJ could abandon itsYCC to prepare the markets for its first rate hike at March or April’s meeting.
- The USD/JPY pair stabilized around 128.23, down for the day and bearish in the daily chart. The price maintains the downward slope and develops below all main SMAs, suggests bearish strength in short term. Meanwhile, 20 SMA continued accelerating south and developing below longer ones, indicating bears not exhausted. On upside, overcome 129.60 may encourage bulls to challenge 131.30, break above that level will open the gate to 132.80.
- Technical indicators still suggest the bearish strength. RSI fell below 50, while the Momentum indicator stabilize in negative territory, suggests downward potentials. On downside, the immediately support is 127.20, break below this level will open the gate to 126.00 area.
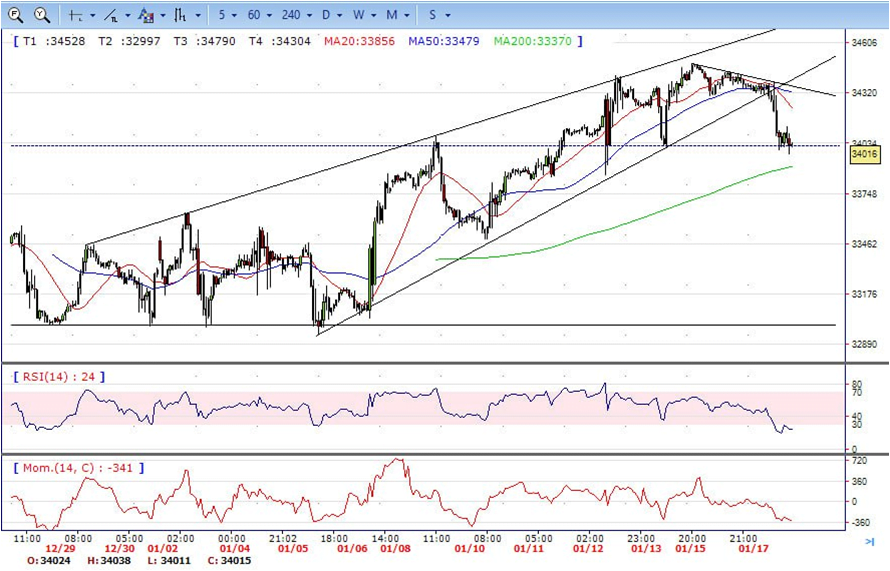
- DJI lost the bullish strength on Monday, retreated from intraday high of 34380 to 33970. It bounced modestly from there and ended the day at around 34010, indicates bearish sign in the hourly chart. Right now market is standing below 50 and 200 MAs, suggests a bearish strength. Meanwhile, 20 and 50 SMA continues accelerating south and heading towards 200 SMA, suggests bears not exhausted yet. On upside, overcome 34250 may encourage bulls to challenge 34490, break above that level will open the gate to 34700.
- Technical indicators also suggest the bearish movement, developing below the mid-line. RSI stabilized around 24, while the Momentum indicator hovering well below the mid-line, suggests downside potentials. On downside, the immediately support is 33970, break below this level will open the gate for more decline to 33800 area.
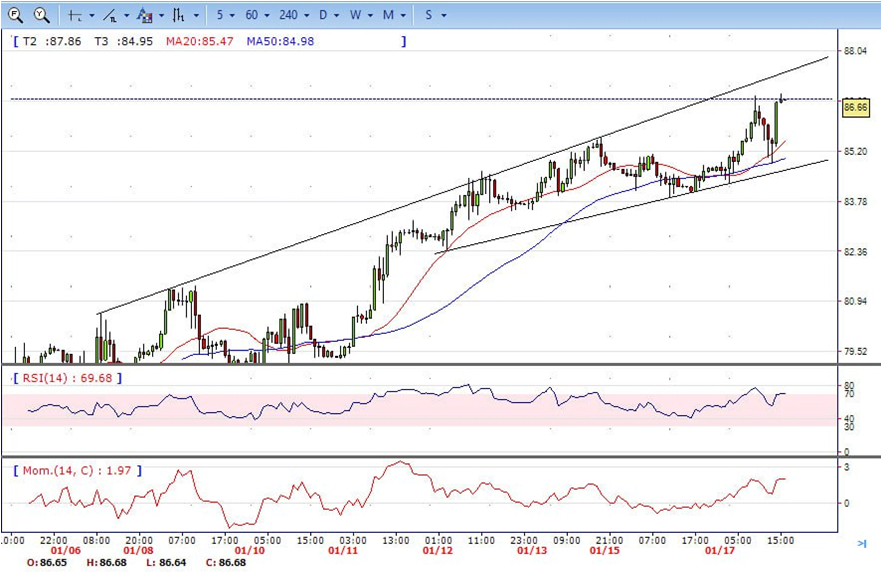
- The Brent jumped to high 86.82 at the last hour of the day and hold nearby to ended Tuesday, bullish in the hourly chart. The price stabilizes above 20 and 50 SMA, suggests bullish strength in short term. Meanwhile, the 20 SMA continued accelerating north and developing above 50 SMA, indicates bulls not exhausted yet. On upside, overcome 87.00 may encourage bulls to challenge 89.20, break above that level will open the gate to 90.50.
- Technical indicators also suggest bullish movement, hovering above the mid-line. RSI climbs to 69, while the Momentum index is well above the mid-line, suggests upward potentials. On downside, the immediately support is 84.80, break below this level will open the gate for more decline to 83.20 area.