EUR/USD
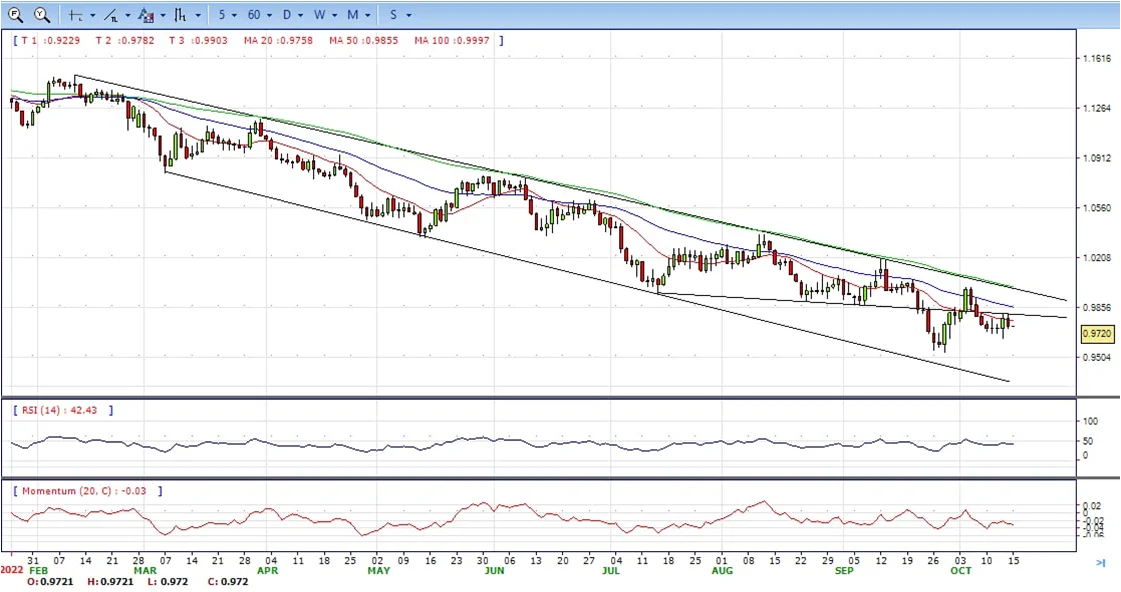
- The EUR/USD losses its grip around and edges lower as the North American session progresses, amidst a firm US dollar, following the release of a US hot inflation report on Thursday, while mixed US economic data, and hawkish Fed commentary, bolstered the buck. The pair ended Monday at around 0.9725, still bearish in the daily chart.
- The US Commerce Department reported that Retail Sales stagnated in September, with figures coming at 0% MoM, below estimates of 0.2%, while on an annual based, decelerated even further, from 9,15% to 8.41%, reflecting the shock of Fed’s monetary policy.
- Aside from this, the International Monetary Fund (IMF) predicted recessions in Italy and Germany in 2023. Therefore, if it looked gloomier, the Eurozone scenario now looks even worse. Eurozone data revealed in the European session saw Spain’s inflation heightening less than estimates, while France’s data followed suit.
- The EUR/USD pair is trading near the 0.9725, down for the day with the bearish stance in daily chart. The pair still stabilized below 20 and 50 SMA, indicates bearish strength. Meanwhile, the 20 SMA continued developing far below longer ones despite it started turning flat, suggests bears not exhausted yet. On upside, the immediate resistance is 0.9820, break above this level will extend the advance to 1.0000.
- Technical readings in the daily chart support the bearish stances. The RSI indicators hovering below the midlines and stabilized around 42. The Momentum indicator stabilized in the negative territory, indicating downward potentials. On downside, the immediate support is 0.9630 and below this level will open the gate to 0.9530.
Open A Demo
CDO has wide range of tools, professional and friendly support for clients to achieve their financial markets trading goals. Open a live account now to enjoy this experience with virtual deposit.
GBP/USD
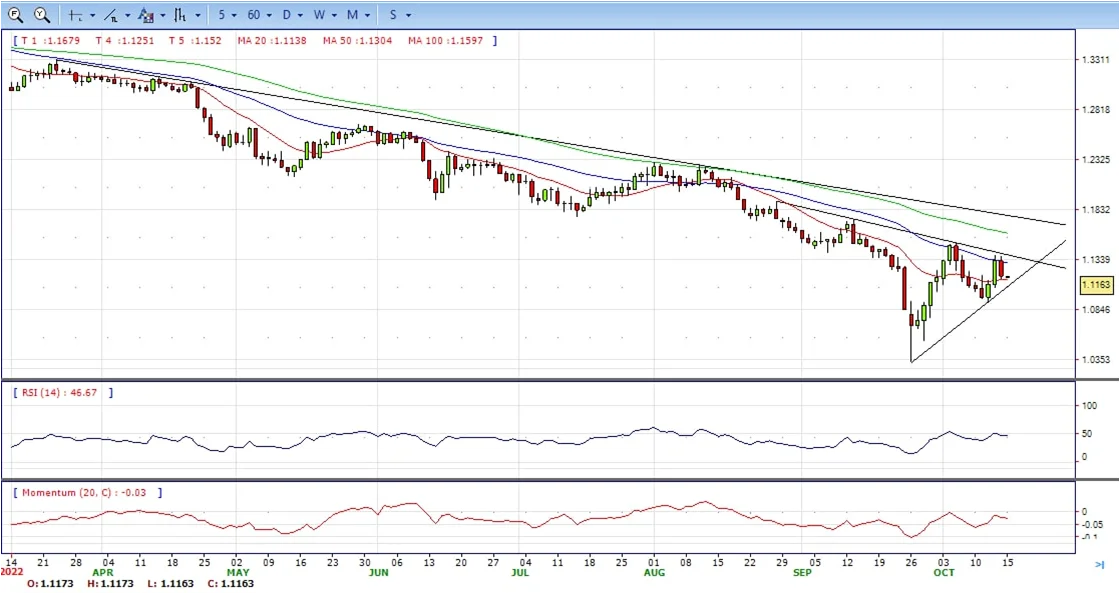
- The British pound extends its loss amidst two weeks of turmoils, courtesy of UK’s PM Liz Truss’s mini-budget, which ended with the Chancellor of Exchequer, Kwasi Kwarten, replaced by James Hunt, as the PM Truss tries to calm the markets. The pair ended the week around 1.1180, neutral to bearish in the daily chart.
- US equities are tumbling sharply, a U-turn from Thursday’s reaction to US CPI. Fed officials reiterated that inflation is high, the labor market tight and that further rate hikes are coming. San Francisco’s Fed Mary Daly said that the Federal funds rate (FFR) could peak at around 4.5-5.0% as the US central bank does its best to tame inflation.
- On the UK’s side, Prime Minister Liz Truss replaced the former Chancellor Kwarteng with James Hunt while increasing the corporate tax from 18% to 25%, which will raise GBP 18 billion a year. At the same time, the Bank of England finished its bond-buying program, aimed to stabilize the markets, though Gilts, namely the 30-year, is up 26 bps, yielding 4.80%,
- The GBP/USD offers neutral stance in daily chart and maintains the downward slope after hit 1.1380 high. Cable now is stabilizing between 20 and 50 SMA, indicating neutral strength in short term. Meanwhile, the 20 SMA continued developing below longer ones despite it started turning flat, suggesting bears not exhausted yet. On upside, The immediate resistance is 1.1380 with a break above it exposing to 1.1500.
- Technical readings in the daily chart support neutral to bearish stances. RSI indicator stabilized around 48, while the Momentum indicator stabilized below the midline, suggesting downward potentials. On downside, the immediate support is 1.1150, unable to defend this level will resume the decline to 1.1060.
XAU/USD
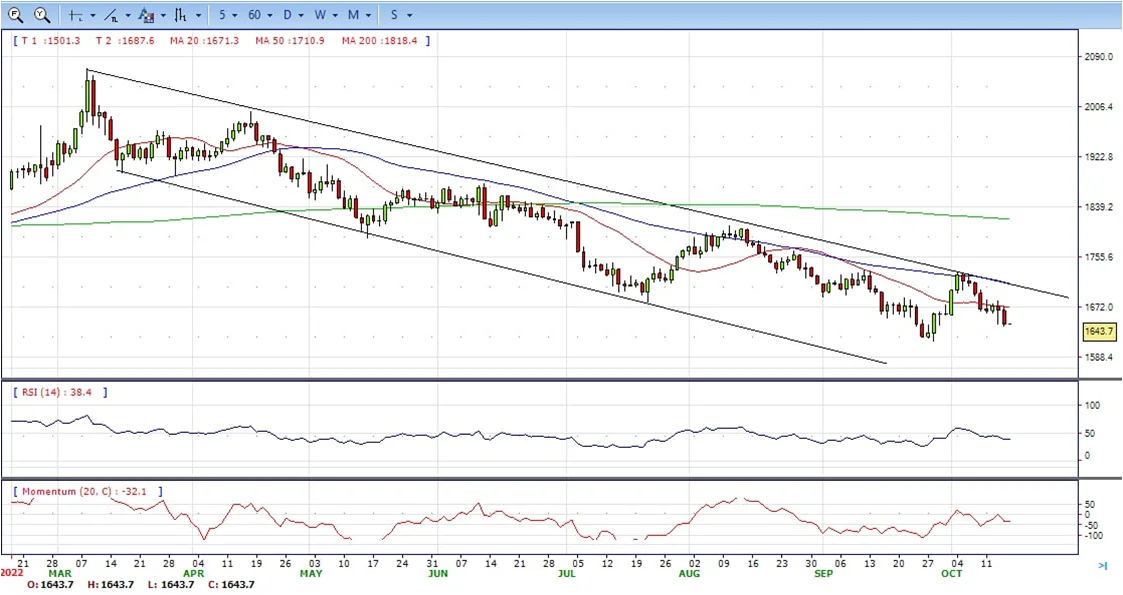
- Gold price extends its losses, while the greenback recovered some ground following Thursday’s US inflation report, which will keep the Fed’s pedal to the metal as traders brace for big rate hikes in November and December FOMC’s meetings. The XAU/USD ended the week at $1644 a troy ounce after hitting a daily high of $1671, still bearish in the daily chart.
- US equity indices opened in the red, portraying a negative sentiment. US Retail Sales showed consumers are beginning to feel the shock of higher interest rates, with September’s sales decelerating from 0.3% to 0% MoM, below expectations, and slowed by 8.41% annually. Of late, the University of Michigan Consumer Sentiment edged higher to 59.8, exceeding estimates but inflation expectations for one year rose to 5.1%, above forecasts of 4.7%.
- US equity indices opened in the red, portraying a negative sentiment. US Retail Sales showed consumers are beginning to feel the shock of higher interest rates, with September’s sales decelerating from 0.3% to 0% MoM, below expectations, and slowed by 8.41% annually. Of late, the University of Michigan Consumer Sentiment edged higher to 59.8, exceeding estimates but inflation expectations for one year rose to 5.1%, above forecasts of 4.7%.
- Gold price stabilized around 1644, down for the day and bearish in the daily chart. The gold price stabilized below 20 and 50 SMA, suggesting bearish strength. Meanwhile, the 20 SMA continued developing far below longer ones despite it started turning flat, indicating bears not exhausted yet. On upside, the immediate resistance is 1684, break above this level will open the gate to extend the advance to 1700 area.
- From a technical perspective, the RSI indicator hold below the midline and stabilized around 39, suggesting bearish strength. The Momentum indicator struggled below the midline, suggests downward potentials. On downside, the immediate support is 1640, below this area may resume the decline to 1615.

CDO TRADER
CDO TRADER, our cutting-edge trading platform, follows the technology from the forefront with new features added continuously. Moreover, CDO TRADER is now available for Android and iOS! So it allows you to trade on the go!
USD/JPY
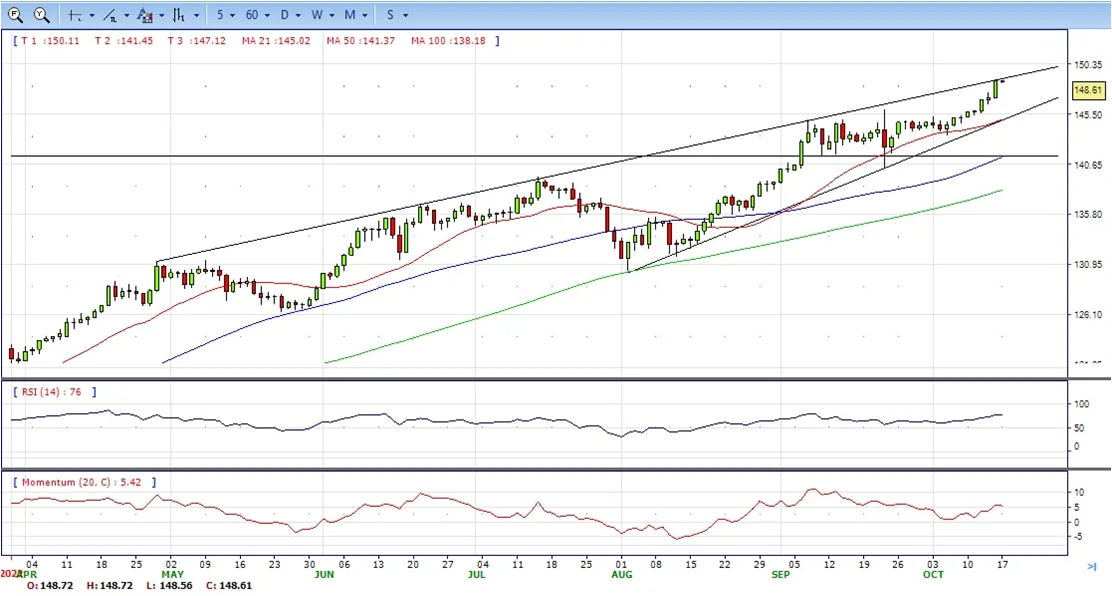
- The dollar accelerated its rally against the Japanese yen on Friday to hit session highs at 148.85. The pair has surged beyond 3% in an eight-day rally, reaching its highest levels since 1990.
- The Japanese yen is dropping like a stone weighed by the monetary policy divergence between the Bank of Japan and the Federal Reserve, and also the rest of the world’s major central banks. While the Fed is expected to hike interest rates by 0.75% for the fourth consecutive time in November, the Bank of Japan remains committed to its ultra-expansive policy, which makes the yen less attractive for investors.
- At this point, the pair has appreciated well above the level that triggered intervention by the Bank of Japan last month. So far the bank has remained inactive, however, the Japanese finance minister Suzuki reiterated on Thursday the government’s commitment to take action against excessive currency volatility.
- The USD/JPY pair stabilized around 148.60, up for the day and bullish in the daily chart. The price still maintains the upward slope and stabilized above all main SMAs, suggests bullish strength. Meanwhile, 20 SMA continued accelerating north and developing above longer ones, indicating bulls not exhausted in the long term. On upside, overcome 149.00 may encourage bulls to challenge 150.00, break above that level will open the gate to 151.00.
- Technical indicators suggest the bullish strength. RSI stabilized around 77, while the Momentum indicator continued developing above the midline, suggests upward potentials. On downside, the immediate support is 146.00, break below this level will open the gate to 144.80 area.
MetaTrader 4
MT4 has user friendly interface that is providing simplicity and efficiency. The traders can perform trading strategies for different products like Forex and CFD. MetaTrader 4 has over 50 built-in indicators, also it’s the tool that predicts trends and defines the appropriate entry and exit points.

DJI
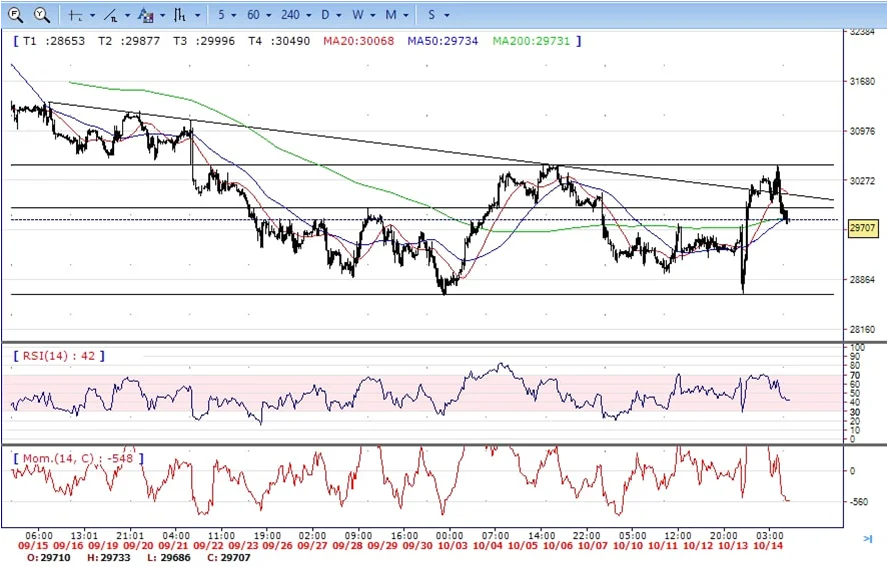
- DJI under the strong sell pressure on Friday, tumbled from the intraday high 30480 area to intraday low 29650 region. It ended the day at around 29700, down for the day and bearish in the hourly chart. It stabilized below all main SMAs, suggests bearish strength. Meanwhile, 20 SMA started turning south and heading towards longer one, suggesting bears not exhausted yet. On upside, overcome 30000 may encourage bulls to challenge 30500, break above this level will open the gate to 31000.
- Technical indicators suggest the bearish strength. RSI stabilized around 42, while the Momentum indicator stabilized below the midline, suggests downward potentials. On downside, the immediate support is 29500, break below this level will open the gate for more decline to 29100 area.
BRENT
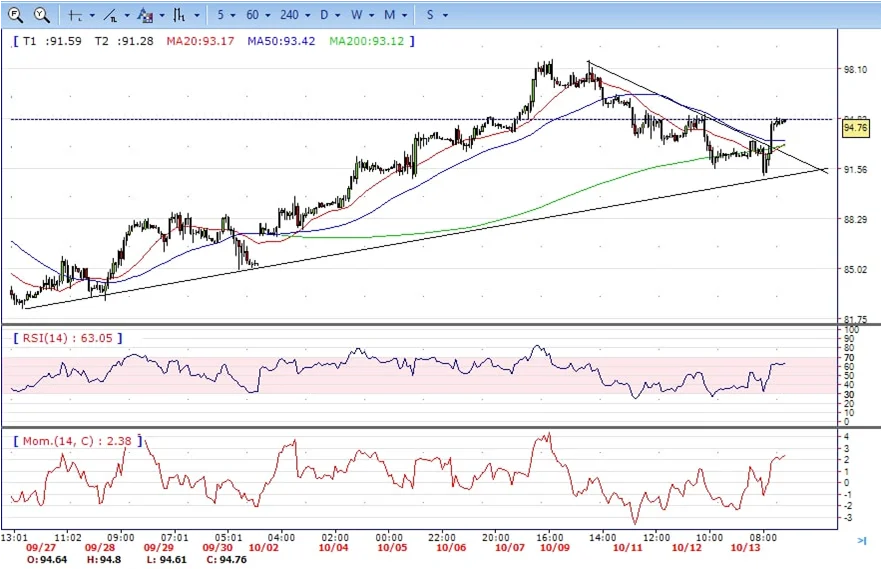
- Brent under the sell pressure, tumbled from strong resistance area 95.20 to intraday low 91.28. It settled near the bottom and ended Friday at around 91.70, bearish in the hourly chart. The price stabilized below all main SMAs, suggests bearish strength in short term. Meanwhile, the 20 SMA started turning south and heading towards longer ones, indicating bears not exhausted yet. On upside, overcome 95.20 may encourage bulls to challenge 96.50, break above this level will open the gate to 97.60.
- Technical indicators suggest the bearish movement, hovering below the midline. RSI stabilized around 31, while the Momentum indicator stabilized in negative territory, suggests downward potentials. On downside, the immediate support is 91.00, break below this level will open the gate for more decline to 89.00 area.
Contact Us
Please, fill the form to get an assistance.


