17/04/2023 Daily Reports
- The EUR/USD is losing ground on Friday as the US Dollar recovers a part of recent losses. The pair reached a fresh daily low at 1.0972 moving away from the one-year highs it hit on European hours at 1.1075.
- The US Dollar Index is up by 0.50% on Friday, hovering around 101.50 following mixed US economic data. Comments from Federal Reserve officials and higher US yields helped the Dollar. Economic data came in mixed, with lower-than-expected numbers from Retail Sales, but Industrial Production and University of Michigan’s Consumer Sentiment rose more than expected.
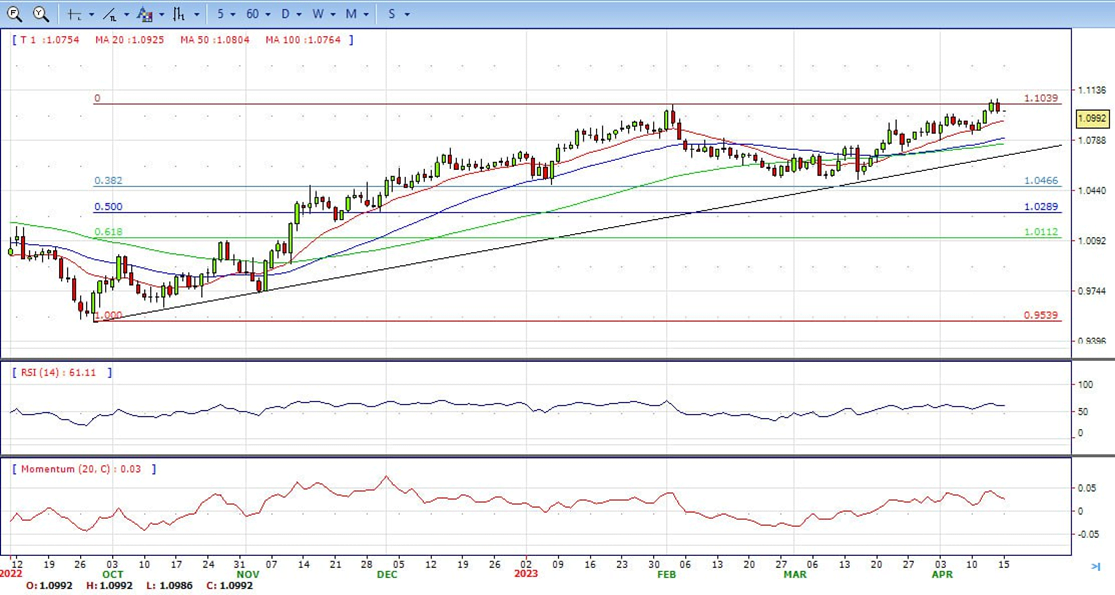
- The EUR/USD pair is trading near the 1.0990, down for the day with bullish stance in daily chart. The pair stabilized above 20 and 50 SMA, indicates bullish strength. Meanwhile, the 20 SMA continued accelerating north and heading towards 50 and 200 SMA, suggests bulls not exhausted yet. On upside, the immediate resistance is 1.1070, break above this level will extend the advance to 1.1180.
- Technical readings in the daily chart support the bullish stance. The RSI indicator stabilizes around 61. The Momentum indicator holds above the midline, indicating bullish potentials. On downside, the immediate support is 1.0970 and below this level will open the gate to 1.0880.
- The US dollar is rising sharply on Friday, trimming weekly losses after the release of US economic data. GBP/USD is falling more than a hundred pips on the day, trading at 1.2410.
- The US Dollar is up across the board, ending a three-day negative streak and recovering from the lowest levels in months. Higher US yields are supporting the Greenback on Friday. The US 10-year yield reached 3.50% and the 2-year is at 4.09%, up by 2.90% for the day. Data from the US came in mixed. Retail Sales dropped by 1% in March, more than the 0.4% expected. Industrial Production expanded 0.4%, more than the 0.2% forecast. University of Michigan’s Consumer Sentiment Index improved in April to 63.5 from 62.
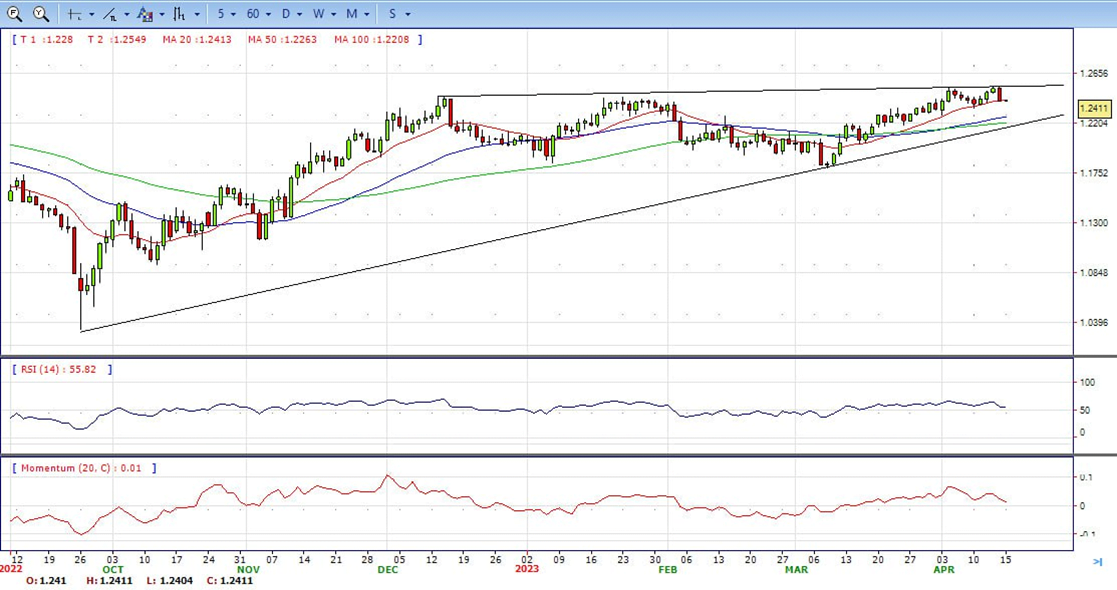
- The GBP/USD offers bullish stance in daily chart. Cable stabilizes above 20 and 50 SMA, indicating bullish strength in short term. Meanwhile, the 20 SMA continued accelerating north and developing far above longer ones, suggests bulls not exhausted yet. On upside, the immediate resistance is 1.2540 with a break above it exposing to 1.2660.
- Technical readings in the daily chart support the bullish stances. RSI indicator stabilizes around 55, while the Momentum indicator stabilizes above the midline, suggesting upward potentials. On downside, the immediate support is 1.2400, unable to defend this level will resume the decline to 1.2340.


- Following new 2023 highs near the $2050 mark per ounce troy as well as a 3-day positive streak, the precious metal embarked on a corrective decline which has so far met initial contention near $2003 on Friday.
- The so far daily retracement in the yellow metal came in response to the rebound in the greenback after the USD Index sank to new 2023 lows in the 100.80/75 band earlier in the European session. Also weighing on bullion appears the moderated bounce in US yields across the curve, at the time when investors continue to price in a 25 bps rate hike by the Fed at the May 3 gathering. According to CME Group’s FedWatch Tool, the probability of the above-mentioned scenario hovers around the 80%, from around 40% a month ago.
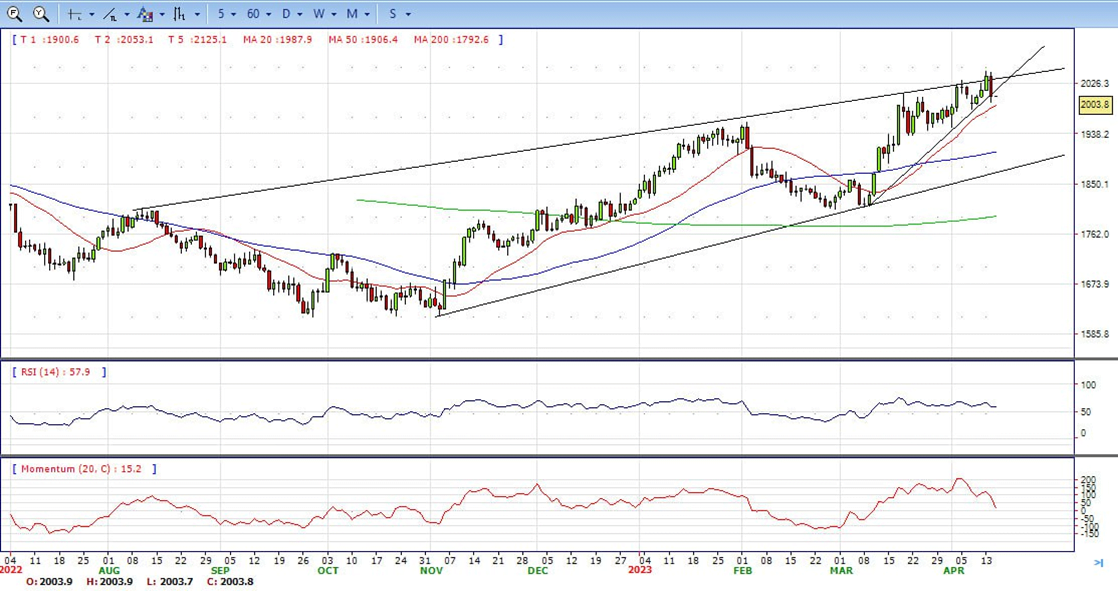
- Gold price stabilized around 2003, down for the day and bullish in the daily chart. The gold price still stabilizes above all main SMAs, suggesting bullish strength in short term. Meanwhile, the 20 continued accelerating north and continued developing far above 50 and 200 SMA, indicates bulls not exhausted yet. On upside, the immediate resistance is 2032, break above this level will open the gate for more advance to 2049 area.
- From a technical perspective, the RSI indicator holds above the mid-line and stabilizes around 59, on a bullish strength. The Momentum indicator hold in the positive territory, suggests upward potentials. On downside, the immediate support is 1992, below this area may resume the decline to 1981.


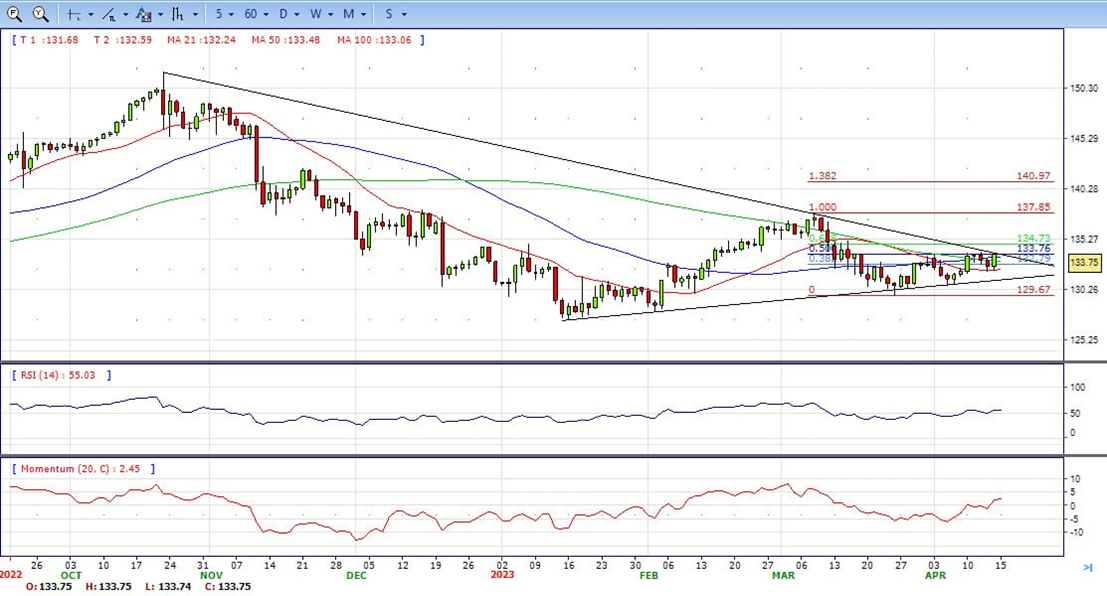
- The USD/JPY advanced sharply after the release of US economic data and climbed to 133.75, hitting a fresh daily high. The Greenback appreciated across the board despite a larger-than-expected slide in March Retail Sales.
- Retail Sales dropped 1% in March, against the consensus of a 0.4% slide; following a 0.2% decline (revised from -0.4%) in February. Sales excluding autos fell by 0.8% in March, more than the decline expected of 0.3%. The Import Price Index fell at an annualized rate of 4.6%, more than the 3.7% of market consensus, and the Export Price Index fell by 4.8%, more than the 4.2% slide expected.
- The USD/JPY pair stabilized around 133.75, up for the day and bullish in the daily chart. The price stabilizes above 20 and 50 SMA, suggests bullish strength in short term. However, 20 SMA started turning flat but continued developing below longer ones, indicating bears not exhausted. On upside, overcome 134.00 may encourage bulls to challenge 135.10, break above that level will open the gate to 137.00.
- Technical indicators suggest the bullish strength. RSI stabilizes around 55, while the Momentum indicator stabilizes above the midline, suggests upward potentials. On downside, the immediate support is 132.00, break below this level will open the gate to 130.60 area.
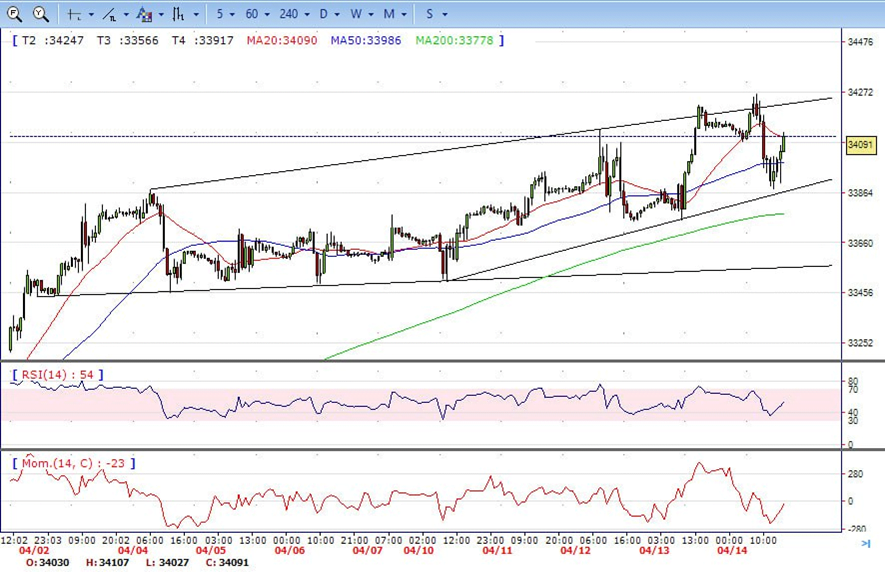
- DJI tumble to intraday low 33870 area from the high 34263. It trimmed some gains and ended the day around 34090, down for the day and indicates neutral to bullish sign in the hourly chart. Right now market is standing between 20 and 50 SMA, suggests neutral strength. Meanwhile, 20 SMA started turning south and heading towards 50 SMA, suggests bears not exhausted yet. On upside, overcome 34260 may encourage bulls to challenge 34410, break above that level will open the gate to 34750.
- Technical indicators suggest the directionless movement. RSI stabilizes around 53, while the Momentum indicator stabilizes below the midline, suggests downward potentials. On downside, the immediately support is 33870, break below this level will open the gate for more decline to 33730 area.
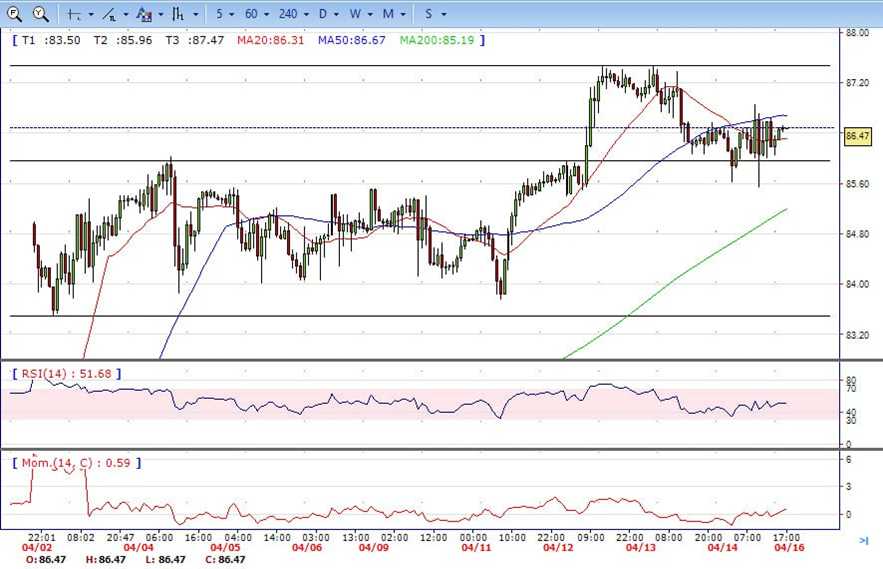
- Brent fluctuated in the familiar range, traded between low 85.55 to high 86.90. It ended Friday around 86.50, unchanged for the day and indicates neutral sign in the hourly chart. Meanwhile, the 20 SMA started turning flat and heading towards 50 SMA, indicates bulls not exhausted yet. On upside, overcome 87.50 may encourage bulls to challenge 89.00, break above that level will open the gate to 90.60.
- Technical indicators also suggest bullish movement, hovering above the midline. RSI stabilizes at 51, while the Momentum indicator stabilizes above the midline, suggests upward potentials. On downside, the immediately support is 85.50, break below this level will open the gate for more decline to 83.50 area.