

16/12/2022 Daily Reports
- The EUR/USD jumped to 1.0735, a fresh six-month high, during ECB Lagarde’s presser. It erases gains after Lagarde’s comments and turned its direction to downside and ended Thursday at around 1.0635, still bulish in the daily chart.
- The European Central Bank raises key interest rates by 50 basis points to the highest levels since 2009. In the statement, the ECB said it expects to keep rising rates as inflation “remains far too high”. During the press conference, ECB President Christine Lagarde signaled that the next rate hikes will continue to be of 50 basis points.
- In the US economic data came in mixed. On the positive side, Initial Jobless Claims dropped more than expected to 211K, the lowest level in weeks. Retail Sales in November fell by 0.6%, more than the 0.1% decline of market consensus. The Philly Fed recovered from -19.4 to -13.8. The Empire Index tumbled to -11.2 from 4.5. Industrial Production contracted 0.2% in November against expectations of a 0.1% expansion.
- The EUR/USD pair is trading near the 1.0635, down for the day with bullish stance in daily chart. The pair stabilized above 20 and 50 SMA, indicates bullish strength. Meanwhile, the 20 SMA continued accelerating north and developing far above longer ones, suggests bulls not exhausted yet. On upside, the immediate resistance is 1.0670, break above this level will extend the advance to 1.0740.
- Technical readings in the daily chart support the bullish stances. The RSI indicators hovering above the midline and stabilized around 65. The Momentum indicator stabilized above the midline, indicating upward potentials. On downside, the immediate support is 1.0590 and below this level will open the gate to 1.0500.

- The Pound Sterling failed to gain traction amidst a Bank of England 50 bps rate hike, though risk aversion maintains the US Dollar bid, after hitting six-month lows around 103.448, per the US Dollar Index. At the time of writing, the GBP/USD is trading at 1.2190, down around 2% and still bullishi in the daily chart.
- Data-wise, the US economy experienced a setback in November as Retail Sales unexpectedly contracted, down 0.6% MoM compared to the anticipated -0.1%. Meanwhile, Initial Jobless Claims rose by 211K despite estimates of 230K, revealing the strength and robustness of today’s labor market acknowledged by Fed Chair Powell during his Wednesday press conference.
- In a move widely expected by analysts, the Bank of England hiked interest rates to 3.50%, an increase of 50 basis points and the highest rate since the financial crisis. However, the decision was not unanimous; two members opted for no change, while Catherine Mann voted for an even higher increase of 75bps. The BoE said that further rate increases might be required to achieve the bank’s 2% goal.
- The GBP/USD offers bullish stance in daily chart. Cable still stabilized above all main SMAs, indicating bullish strength in short term. Meanwhile, the 20 SMA continued accelerating north and developing above longer ones, suggests bulls not exhausted yet. On upside, The immediate resistance is 1.2340 with a break above it exposing to 1.2450.
- Technical readings in the daily chart support the bullish stances. RSI indicator stabilized around 56, while the Momentum indicator stabilized above the midline, suggesting upward potentials. On downside, the immediate support is 1.2150, unable to defend this level will resume the decline to 1.2100.


- Gold price extended its losses following a more “hawkish” than expected Fed decision on Wednesday. Even though the 50 bps rate hike by the Federal Reserve, the subsequent language used by its Chairman Jerome Powell further cemented the case for a higher “terminal” rate. At the time of writing, the XAU/USD is trading at $1,777 a troy ounce. still bullish in the daily chart.
- The US Dollar Index, a gauge of the buck’s value against a basket of peers, remains positive but trading off the day’s highs of 104.406, weighed by the ECB press conference of its President Christine Lagarde. At the time of typing, the DXY is trading at 103.870, gaining 0.26%. Hence, as the US Dollar remained bid, Gold dropped from its multi-month highs of $1,824.47, plunging 1.22% on Thursday.
- Elsewhere, the economic docket in the US featured November Retail Sales, which missed expectations, plummeting 0.6% MoM vs. estimates of 0.1% contraction. Meanwhile, Initial Jobless Claims rose by 211K, less than estimates of 230K, displaying the tightness of the labor market, which was acknowledged by Fed Chair Powell during its Q&A press conference Wednesday.
- Gold price stabilized around 1777, down for the day and bullish in the daily chart. The gold price still stabilized above 20 and 50 SMA, suggesting bullish strength in short term. Meanwhile, the 20 SMA continued accelerating north and developing above 50 SMA, indicating bulls not exhausted yet. On upside, the immediate resistance is 1796, break above this level will open the gate to extend the advance to 1814 area.
- From a technical perspective, the RSI indicator hold above the midline and stabilized around 54, suggesting bullish strength. The Momentum indicator stabilized above the midline, suggests upward potentials. On downside, the immediate support is 1765, below this area may resume the decline to 1744.


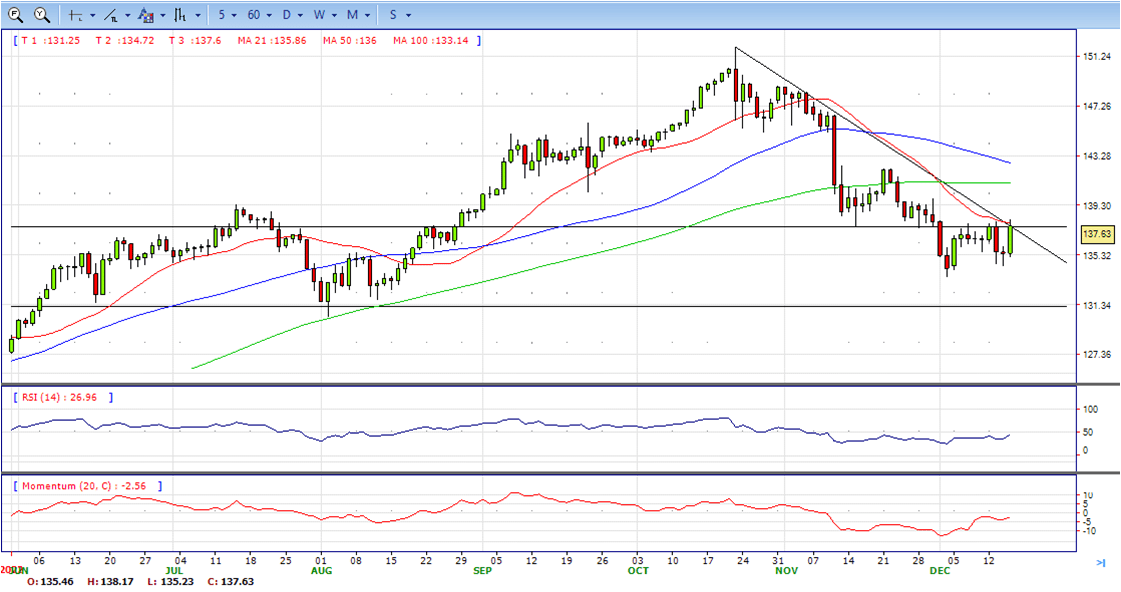
- The US Dollar strengthened across the board during the American session, the day after the FOMC meeting and following weaker-than-expected US economic data. The USD/JPP jumped above 138.00, toward the weekly high, despite amid risk aversion. It ended Thursday at around 137.70, neutral to bearish in the daily chart.
- Risk aversion is not helping the Yen so far on Thursday as central bank around the world continue to hike interest rates; the exception is the Bank of Japan. The Japanese yen is among the weakest currencies of the America session as yields rise sharply in Europe and as Treasuries remain steady. In Wall Street, the Dow Jones is falling by 1.95% and the Nasdaq drops more than 2%.
- In the US, economic data released on Thursday came in mixed, offering some divergence. Retail Sales fell more than expected and so did Industrial Production in November, while Initial Jobless Claims fell to 211K, the lowest level in eleven weeks.
- The USD/JPY pair stabilized around 137.70, up for the day and neutral to bearish in the daily chart. The price still maintains the downward slope and develops below all main SMAs, suggests bearish strength in short term. Meanwhile, 20 SMA continued accelerating south and developing below longer ones, indicating bears not exhausted. On upside, overcome 138.20 may encourage bulls to challenge 139.50, break above that level will open the gate to 141.00.
- Technical indicators suggest the bearish strength. RSI stabilized around 44, while the Momentum indicator continued developing below the midline, suggests downward potentials. On downside, the immediate support is 136.00, break below this level will open the gate to 134.50 area.
- DJI still under the strong sell pressure, tumbled from intraday high 34330 to intraday low 33240. It recovered modestly and ended Thursday at 33430, down for the day and bearish in the daily chart. The price stabilized below 20 and 50 SMA, suggests bearish strength in short term. Meanwhile, 20 SMA started turning south and heading towards 50 SMA, suggests bears not exhausted yet. On upside, overcome 33600 may encourage bulls to challenge 33930, break above this level will open the gate to 34200.
- Technical indicators indicates the bearish strength. RSI stabilized around 25, while the Momentum indicator stabilized in negative territory, suggests downward potentials. On downside, the immediate support is 33240, break below this level will open the gate for more decline to 33000 area.

- Brent under the sell pressure, failed to break above 83.15 area and turned its direction to downside. It tumbled to intraday low 80.84 and and ended Thursday at around 81.40, down for the day and bearish in the hourly chart. The price stabilized below 20 and 50 SMAs, suggests bearish strength in short term. Meanwhile, the 20 SMA continued accelerating south and heading towards 50 SMA, indicating bearish bias. On upside, overcome 83.20 may encourage bulls to challenge 85.00, break above this level will open the gate to 86.50.
- Technical indicators suggest the bearish movement, hovering below the midline. RSI stabilized at around 43, while the Momentum indicator stabilized below the midline, suggests downward potentials. On downside, the immediate support is 80.80, break below this level will open the gate for more decline to 79.00 area.


