16/05/2023 Daily Reports
- The single currency regains some balance and motivates EUR/USD to rebound from recent multi-week lows near 1.0850, but still unable to recover 1.0900 level and ended the day around 1.0880.
- In the docket, the European Commission released its updated forecasts and now sees the unemployment steady at 6.8% this year and retreating to 6.7% in 2024. The EC also revised up its projections for inflation and economic growth and expects consumer prices to rise 5.8% in 2023 and 2.8% during the next year and the economy to expand 1.1% in 2023 and 1.6% in 2024. The movement of the euro’s value is expected to closely mirror the behaviour of the US Dollar and will likely be impacted by any differences in approach between the Fed and the ECB with regards to their plans for adjusting interest rates.
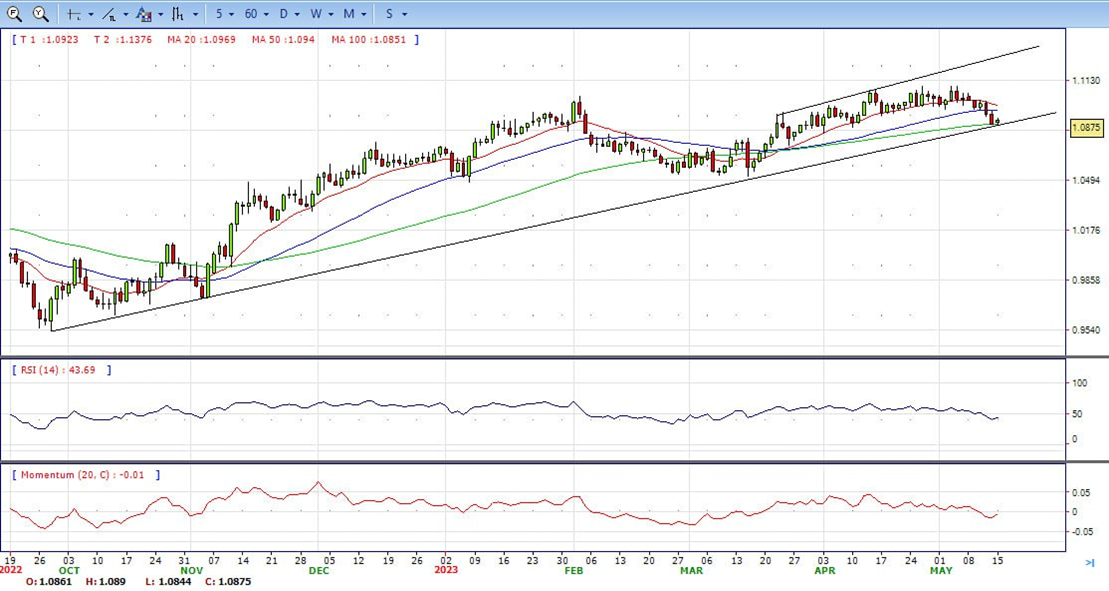
- The EUR/USD pair is trading near the 1.0880, up for the day with bearish stance in daily chart. The pair stabilized below 20 and 50 SMA, indicates bearish strength. Meanwhile, the 20 SMA started turning south and heading towards 50 and 200 SMA, suggests bears not exhausted yet. On upside, the immediate resistance is 1.0950, break above this level will extend the advance to 1.1005.
- Technical readings in the daily chart support the bearish stance. The RSI indicator stabilizes around 44. The Momentum indicator holds below the midline, indicating bearish potentials. On downside, the immediate support is 1.0830 and below this level will open the gate to 1.0710.
- GBP/USD bounces off last week’s low of 1.2443 and rises above the 1.2500 figure as a bullish-engulfing technical pattern emerges. Factors like a soft US Dollar and appetite for riskier assets seem to be behind GBP/USD’s recovery. At the time of writing, the GBP/USD is trading at 1.2525.
- The US economic agenda reported the New York Empire State Manufacturing Index, which disappointed investors, plunged -31.3 vs. the -3.9 estimated. The report revealed that nearly 50% of respondents to the survey said business conditions worsened. The data revealed the orders index slid, while a gauge of prices showed an increase, and the employment component shrank.
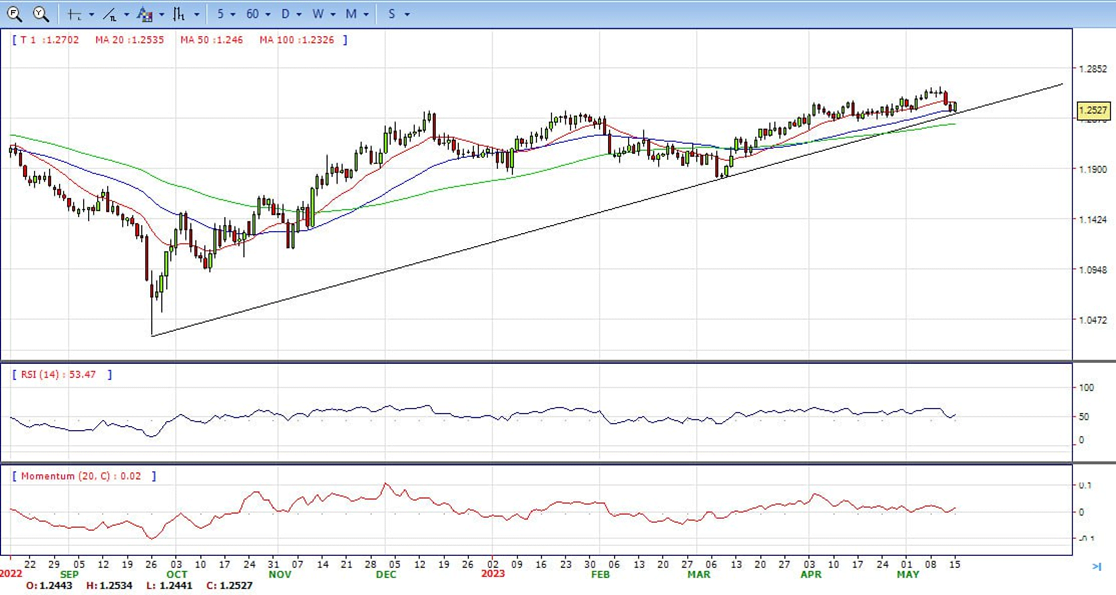
- The GBP/USD offers neutral to bearish stance in daily chart. Cable stabilizes below 20 and 50 SMA, indicating bearish strength in short term. Meanwhile, the 20 SMA started turning flat but continued developing above longer ones, suggests bulls not exhausted yet. On upside, the immediate resistance is 1.2540 with a break above it exposing to 1.2600.
- Technical readings in the daily chart support the bullish to neutral to bearish stances. RSI indicator stabilizes around 53, while the Momentum indicator stabilizes above the midline, suggesting upward potentials. On downside, the immediate support is 1.2430, unable to defend this level will resume the decline to 1.2340.


- Gold price regains some positive traction on the first day of a new week and sticks to its modest intraday gains through the early North American session. The XAU/USD currently trades around the $2,015 region, up nearly 0.22% for the day, and for now, seem to have snapped a three-day losing streak.
- The US Dollar pulls back from a five-week high touched this Monday as investors remained wary of the US debt ceiling standoff. This, in turn, is seen as a key factor lending support to the US Dollar-denominated Gold price. It is worth mentioning that US President Joe Biden said he expects to meet with congressional leaders on Tuesday for talks on a plan to raise the debt limit and avoid a catastrophic default. This, in turn, prompts the USD bulls to take some profits off the table following the strong move-up witnessed over the past two trading days.
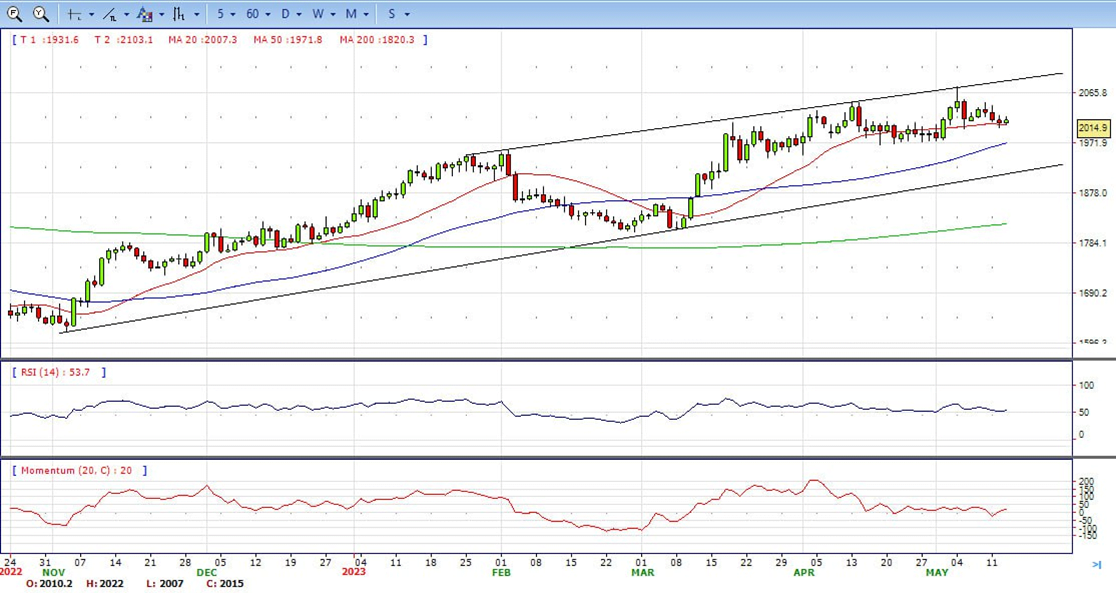
- Gold price stabilized around 2015, up for the day and neutral to bullish in the daily chart. The gold price stabilizes above 20 SMA, suggesting bullish strength in short term. Meanwhile, the 20 SMA started turning flat but continued developing far above 50 and 200 SMA, indicates bulls not exhausted yet. On upside, the immediate resistance is 2048, break above this level will open the gate for more advance to 2080 area.
- From a technical perspective, the RSI indicator holds above the mid-line and stabilizes around 54, on a bullish strength. The Momentum indicator hold in positive territory, suggests upward potentials. On downside, the immediate support is 2000, below this area may resume the decline to 1970.


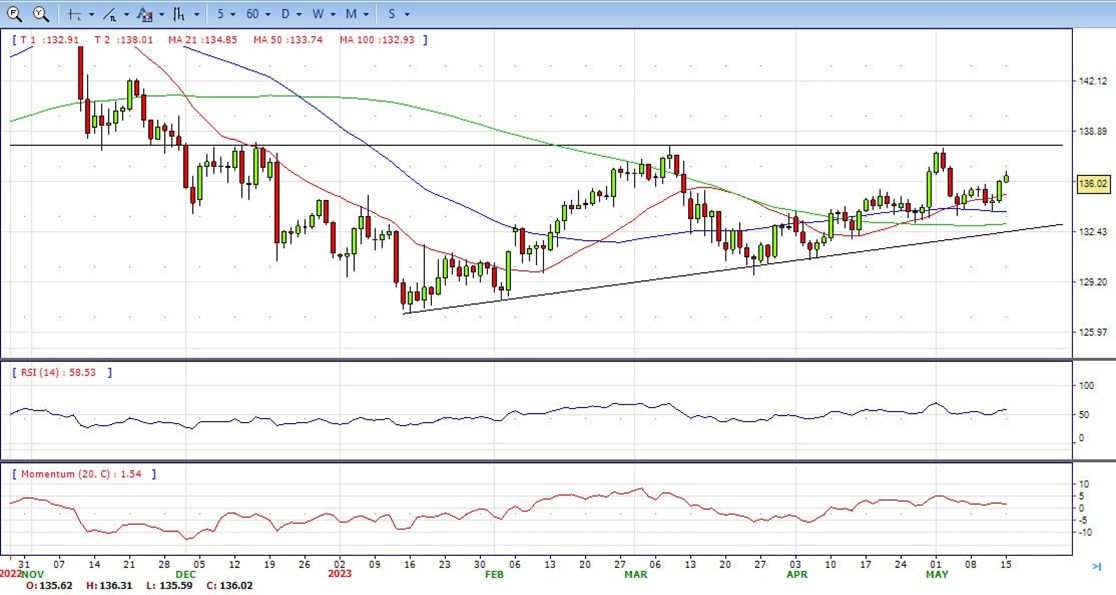
- Despite being broadly softer at the start of the week across a basket of currencies, the US Dollar was up 0.24% against the Yen in midday trade on Wall Street. USDJPY is currently trading at 136.00 and has moved between a low of 135.62 and a high of 136.32.
- The US Dollar index, DXY, fell to a low of 102.382 on the day and was down from 102.752, a five-week high, pressured by a weak manufacturing index in New York State and amid fears about the debt ceiling and the US economy.
- The USD/JPY pair stabilized around 136.00, up for the day and neutral to bullish in the daily chart. The price stabilizes above 20 and 50 SMA, suggests bullish strength in short term. Meanwhile, 20 SMA continued accelerating north and developing above longer ones, indicating bulls not exhausted. On upside, overcome 136.35 may encourage bulls to challenge 137.90, break above that level will open the gate to 139.90.
- Technical indicators suggest the bullish strength. RSI stabilizes around 58, while the Momentum indicator stabilizes above the midline, suggests upward potentials. On downside, the immediate support is 135.30, break below this level will open the gate to 133.50 area.
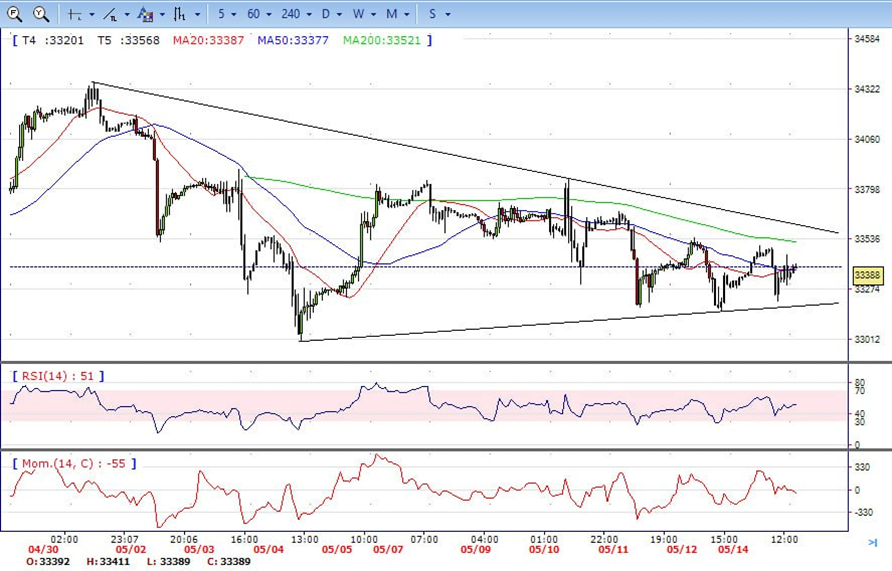
- DJI fluctuated in the familiar range, trade between high 33500 to low33200 and ended the day around 33390. Right now market is standing near 20 and 50 SMA, suggests neutral strength. Meanwhile, 20 and 50 SMA started turning flat and continued developing below 200 SMA, suggests bears not exhausted yet. On upside, overcome 33550 may encourage bulls to challenge 33680, break above that level will open the gate to 33900.
- Technical indicators suggest the bearish movement. RSI stabilizes around 51, while the Momentum indicator stabilizes below the midline, suggests downward potentials. On downside, the immediately support is 33160, break below this level will open the gate for more decline to 33000 area.
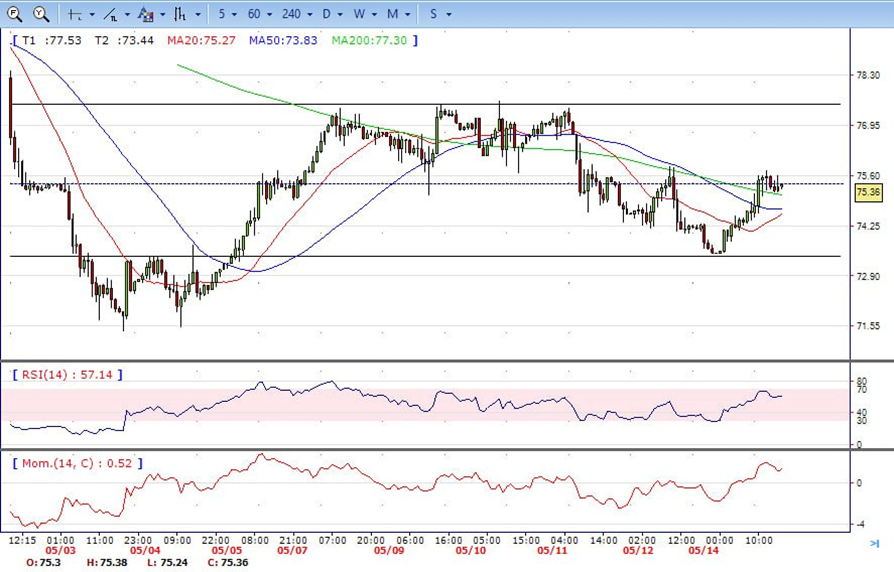
- Brent under the renewal sell pressure on the first half of the day, dropped to intraday low 73.50 area. It trimmed all the losses in the US session and ended the day around 75.50, up for the day and indicates bullish sign in the hourly chart. Meanwhile, the 20 SMA started turning north and heading towards longer ones, indicates bulls not exhausted yet. On upside, overcome 76.00 may encourage bulls to challenge 77.60, break above that level will open the gate to 79.20.
- Technical indicators also suggest bullish movement, hovering above the midline. RSI stabilizes at 63, while the Momentum indicator stabilizes in positive territory, suggests upward potentials. On downside, the immediately support is 73.50, break below this level will open the gate for more decline to 71.40 area.