EUR/USD
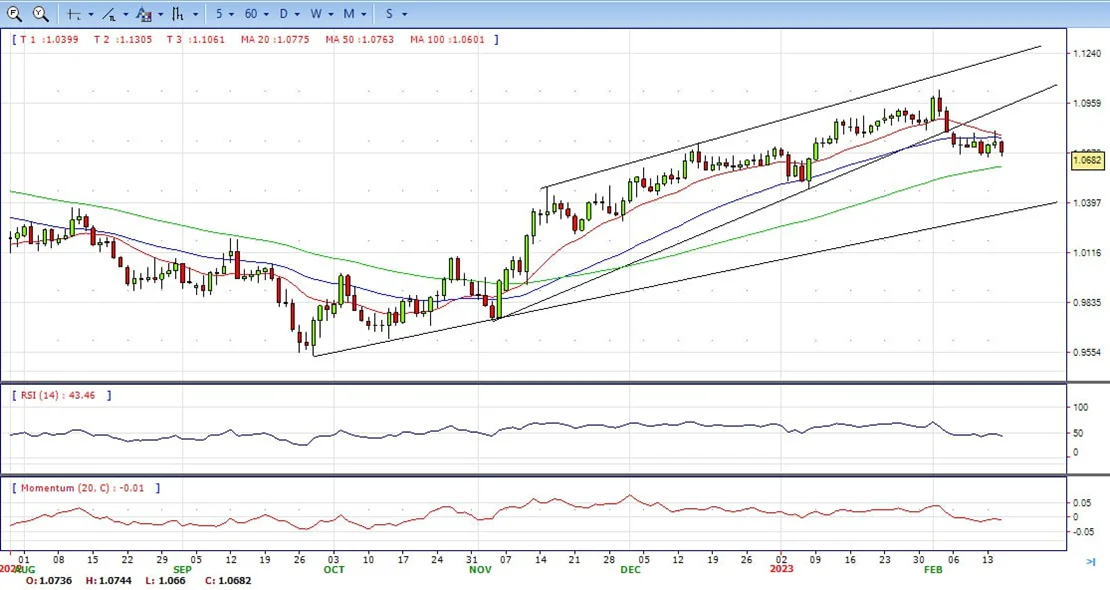
- The now strong rebound in the greenback puts the risk universe under further pressure and forces EUR/USD to drops to 2-day lows near 1.0660 on Wednesday and shouting distance from the monthly lows on Wednesday.
- Indeed, the selling pressure keeps the pair’s price action depressed and near the February low around 1.0650, particularly following solid prints from US Retail Sales for the month of January, while further upside in US yields across the curve also prop up the dollar.
- Additional releases in the US calendar saw the NY Empire State Manufacturing Index improve to -5.8 for the month of February, while Industrial Production expanded 0.8% in the year to January and came in flat vs. the previous month.
- The EUR/USD pair is trading near the 1.0685, down for the day with bearish stance in daily chart. The pair still stabilized below 20 and 50 SMA, indicates bearish strength. Meanwhile, the 20 SMA started turning south and heading towards longer ones, suggests bears not exhausted yet. On upside, the immediate resistance is 1.0800, break above this level will extend the advance to 1.0930.
- Technical readings in the daily chart support the bearish stance. The RSI indicator stabilizes around 43. The Momentum indicator holds below the midline, indicating downward potentials. On downside, the immediate support is 1.0650 and below this level will open the gate to 1.0580.
Open A Demo
CDO has wide range of tools, professional and friendly support for clients to achieve their financial markets trading goals. Open a live account now to enjoy this experience with virtual deposit.
GBP/USD
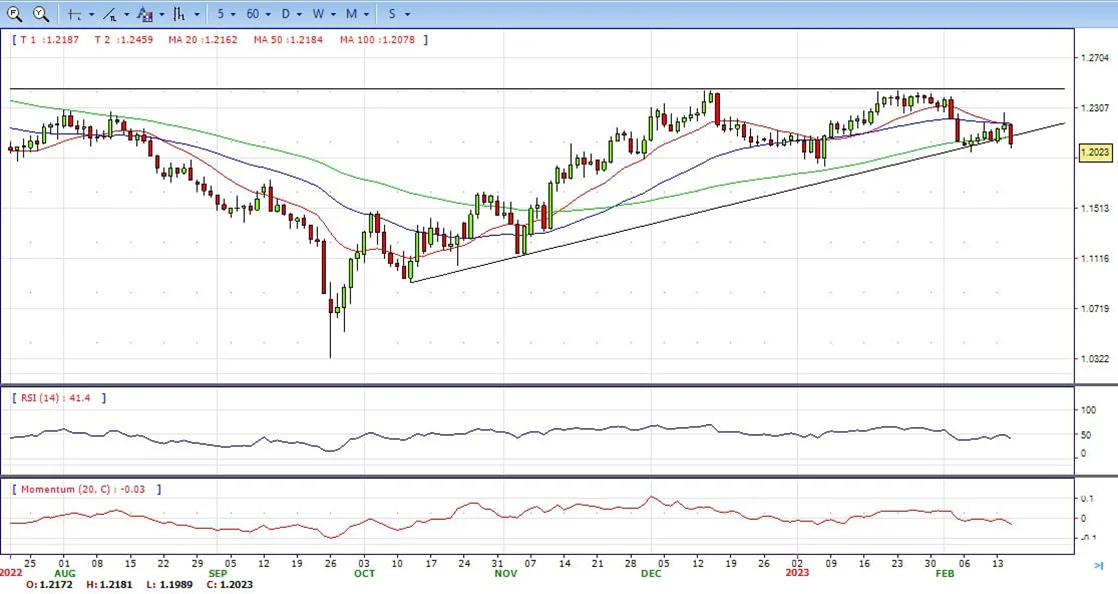
GBP/USD is back under pressure in midday US trade after a series of data has kept a lid on attempts to correct the major sell-off that ensued following a round of negative data for cable. At the time of writing, GBP/USD is trading at 1.2005 and down 1.35%, pressured within the day’s range of between 1.1989 and 1.2181.
The pair has moved lower after a bigger-than-expected drop in UK inflation in January has led investors to believe that the Bank of England might curtail its interest rate hiking cycle. Inflation decelerated to an annual rate of 10.1% in January from 10.5% in December, compared to expectations of 10.3%.
Then to rub salt in the bull’s wounds, the US Dollar climbed to a six-week high against a currency basket on Wednesday after hotter-than-expected US Retail Sales data last month that followed high Consumer Price Index data the prior day. Year-on-year, Retail Sales prices rose 6.4%. That was down from 6.5% in December but above economists’ expectations of 6.2%Retail Sales rose 3% in January, easily topping the 1.8% estimate, the Commerce Department reported Wednesday.
The GBP/USD offers bearish stance in daily chart. Cable stabilizes below 20 and 50 SMA, indicating bearish strength in short term. Meanwhile, the 20 SMA continued accelerating south and heading towards longer ones, suggests bears not exhausted yet. On upside, The immediate resistance is 1.2190 with a break above it exposing to 1.2270.
Technical readings in the daily chart support the neutral to bearish stances. RSI indicator stabilizes around 41, while the Momentum indicator stabilizes below the midline, suggesting downward potentials. On downside, the immediate support is 1.1960, unable to defend this level will resume the decline to 1.1840.

CDO TRADER
CDO TRADER, our cutting-edge trading platform, follows the technology from the forefront with new features added continuously. Moreover, CDO TRADER is now available for Android and iOS! So it allows you to trade on the go!
XAU/USD
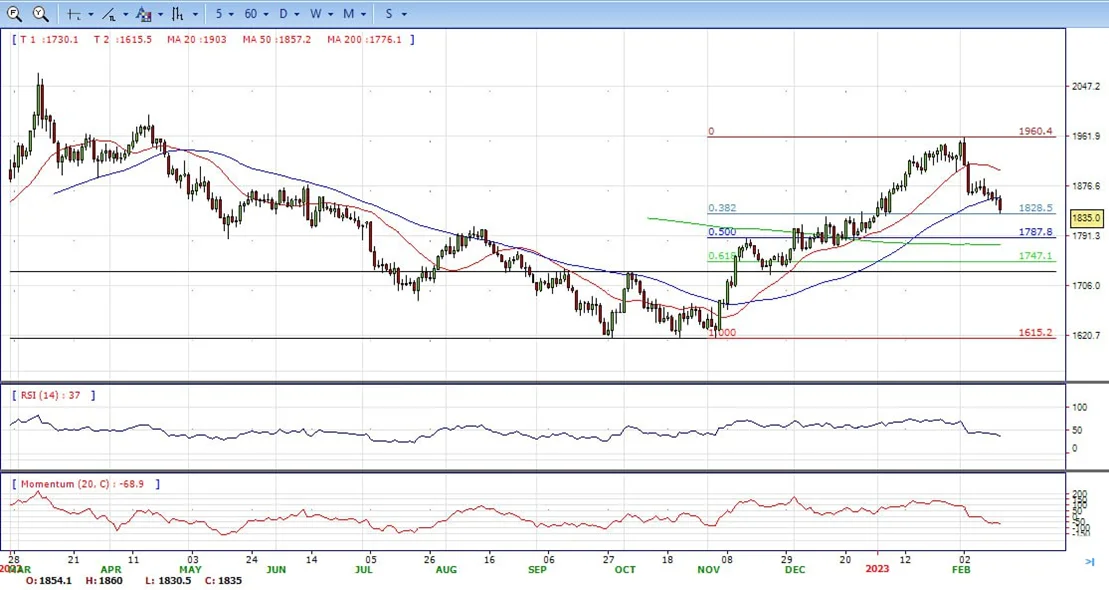
- Gold price is trading at its lowest level since early January below $1,840. Recent repricing of market expectations around the Fed tightening could create a short-term headwind for the yellow metal. The price extended its February slide to $1,830.50 a troy ounce, now hovering around $1,835.
- The US Dollar remained strong on Wednesday, with demand for the Greenback easing ahead of Wall Street’s close as stocks bounced from their intraday lows.
- The Greenback benefited from renewed concerns about the continued US Federal Reserve’s monetary tightening spurring risk aversion. As American inflation eased just modestly in January, hopes for a Fed’s pivot faded. The United States published Retail Sales on Wednesday, which surged by 3% MoM in January, much better than anticipated. The figure provided fresh impetus to the USD and kept stock markets on the back foot.
- Gold price stabilized around 1835, down for the day and bearish in the daily chart. The gold price stabilized below 20 and 50 SMA, suggesting bearish strength in short term. Meanwhile, the 20 SMA started turning south and heading towards longer ones, indicating bears not exhausted yet. On upside, the immediate resistance is 1872, break above this level will open the gate for more advance to 1891 area.
- From a technical perspective, the RSI indicator holds below the mid-line and stabilizes around 37, on a bearish strength. The Momentum indicator hold below the midline, suggests downward potentials. On downside, the immediate support is 1830, below this area may resume the decline to 1800.
MetaTrader 4
MT4 has user friendly interface that is providing simplicity and efficiency. The traders can perform trading strategies for different products like Forex and CFD. MetaTrader 4 has over 50 built-in indicators, also it’s the tool that predicts trends and defines the appropriate entry and exit points.

USD/JPY
- The USD/JPY rallies more than 100 pips and clears the 134.00 mark, breaking north and shifted bullish during the session, though a daily close above 134.00 would keep bulls hopeful for further upside. At the time of writing, the USD/JPY exchanges hand at 134.15.
- The US Dollar stands tall near a multi-week high and remains well supported by expectations for further policy tightening by the Fed, which, in turn, is seen acting as a tailwind for the USD/JPY pair. The markets now seem convinced that interest rates are going to remain higher for longer in the wake of stubbornly high inflation. The bets were lifted by the US CPI report released on Tuesday and hawkish comments by several FOMC members.
- Apart from this, the appointment of Kazuo Ueda to be the new Governor of the BoJ fuels speculations about an eventual policy tightening sooner rather than later. In fact, Japan’s former Finance Minister Eisuke Sakakibara said that Ueda is likely to initially keep monetary policy steady and might raise rates in the fourth quarter.
- The USD/JPY pair stabilized around 134.15, up for the day and bullish in the daily chart. The stabilizes above 20 and 50 SMA, suggests bullish strength in short term. Meanwhile, 20 SMA continued accelerating north and heading towards longer ones, indicating bulls not exhausted. On upside, overcome 134.70 may encourage bulls to challenge 136.70, break above that level will open the gate to 138.20.
- Technical indicators suggest the bullish strength. RSI stabilizes around 64, while the Momentum indicator stabilizes in the positive territory, suggests upward potentials. On downside, the immediate support is 132.50, break below this level will open the gate to 131.50 area.

DJI
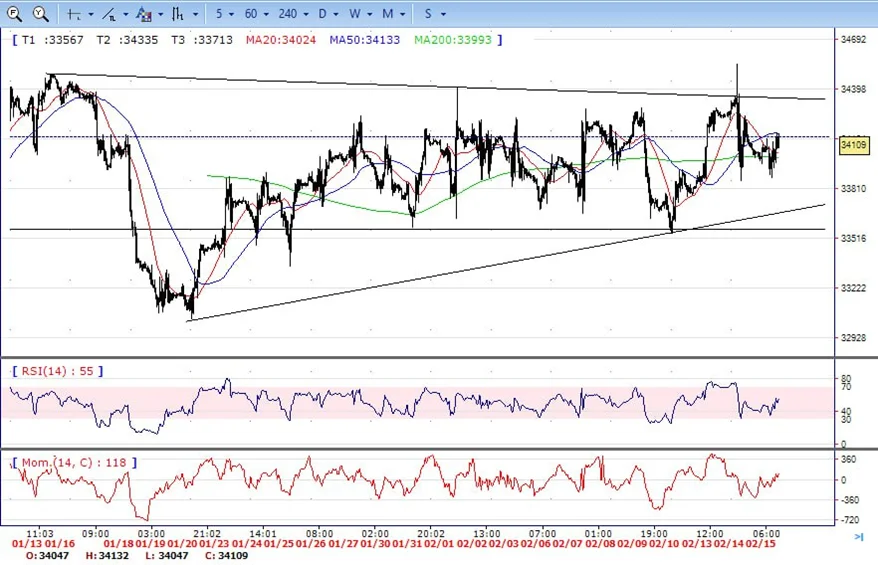
- DJI continued trading in the familiar range, declined to low 33870 area then recovered most of the losses and back to above 34100 to ended Wednesday, slightly down for the day and indicates neutral to bullish sign in the hourly chart. Right now market is standing between 20 and 50 SMA, suggests neutral strength. Meanwhile, 20 SMA started turning north and continued developing above 200 SMA, suggests bulls not exhausted yet. On upside, overcome 34370 may encourage bulls to challenge 34550, break above that level will open the gate to 34680.
- Technical indicators suggest the bullish movement, developing above the mid-line. RSI stabilizes around 56, while the Momentum indicator stabilizes in the positive territory, suggests upward potentials. On downside, the immediately support is 33850, break below this level will open the gate for more decline to 33550 area.
BRENT
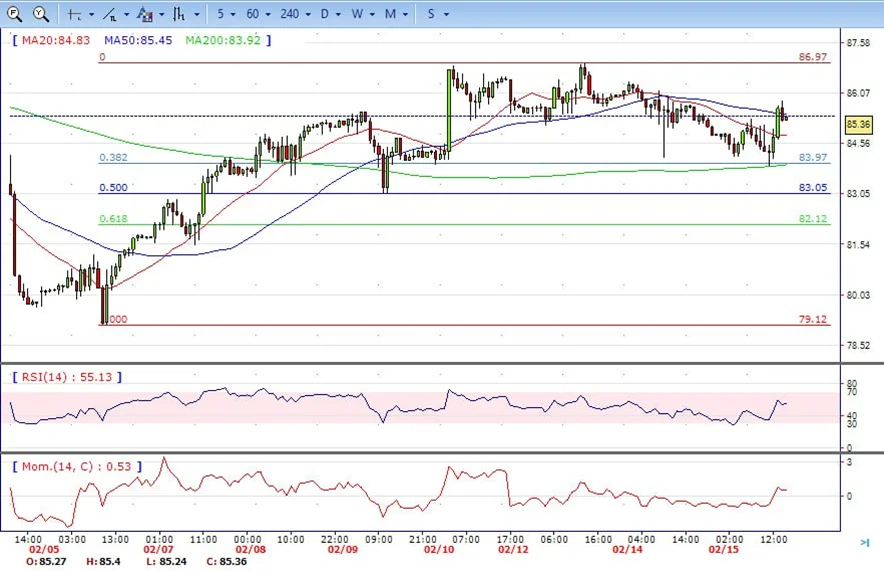
- The Brent under the sell pressure on the first half of the day, tumbled to intraday low 83.90. It trimmed all the losses and ended the day around 85.35. The price currently stabilizes between 20 and 50 SMA, suggests neutral strength in the hourly chart. Meanwhile, the 20 SMA and 50 SMA started turning flat but continued developing far above 200 SMA, indicates bulls not exhausted yet. On upside, overcome 87.00 may encourage bulls to challenge 89.00, break above that level will open the gate to 90.00.
- Technical indicators also suggest bullish movement, hovering above the midline. RSI climbs to 52, while the Momentum indicator stabilizes in positive territory, suggests upward potentials. On downside, the immediately support is 84.00, break below this level will open the gate for more decline to 83.00 area.
Contact Us
Please, fill the form to get an assistance.


