

15/12/2022 Daily Reports
- The EUR/USD dropped toward 1.0620s after the Fed raised rates by 50 bps. However, it recovered all the losses after Fed Chair Powell’s speech and ended Wednesday at around 1.0680, still bullish in the daily chart.
- The FOMC decided to hike the Federal Funds rate as expected toward the 4.25-4.50% range, acknowledging that the labor market remains tight and that inflation remains elevated, “reflecting supply and demand imbalances related to the pandemic, higher food and energy prices, and broader price pressures.”
- Chairman Jerome Powell came out with hawkish comments. Among other things, Powell noted that the ultimate level of rates is more important than how fast they go, adding that the FOMC needs to hold rates at their peak until policymakers are “really confident” inflation comes down in a sustained way.
- The EUR/USD pair is trading near the 1.0680, up for the day with bullish stance in daily chart. The pair stabilized above 20 and 50 SMA, indicates bullish strength. Meanwhile, the 20 SMA continued accelerating north and developing far above longer ones, suggests bulls not exhausted yet. On upside, the immediate resistance is 1.0700, break above this level will extend the advance to 1.0780.
- Technical readings in the daily chart support the bullish stances. The RSI indicators hovering above the midline and stabilized around 71. The Momentum indicator stabilized above the midline, indicating upward potentials. On downside, the immediate support is 1.0600 and below this level will open the gate to 1.0540.

- GBP/USD remains firmer around the six-month high, making rounds to 1.2420-30 after refreshing the multi-day top, still bullish in the daily chart.
- The British Pound recently cheered broadly softer US Dollar as the Federal Reserve (Fed) failed to impress the greenback buyers. However, the fears of a recession in the United Kingdom (UK), highlighted by the recently softer British data, seem to challenge the Cable bulls of late.
- UK’s CPI eased from the 41-year high of 11.1% to 10.7% YoY in November, compared to the 10.9% YoY market forecast. Further, the British Unemployment Rate matched 3.7% market forecast during the three months to October while Claimant Count Change marked a positive surprise of 30.5K in November versus -13.3K expected and -6.4K prior. Alternatively, Average Earnings and monthly GDP for October could be cited as the positive catalysts for the pair.
- The GBP/USD offers bullish stance in daily chart. Cable still stabilized above all main SMAs, indicating bullish strength in short term. Meanwhile, the 20 SMA continued accelerating north and developing above longer ones, suggests bulls not exhausted yet. On upside, The immediate resistance is 1.2445 with a break above it exposing to 1.2550.
- Technical readings in the daily chart support the bullish stances. RSI indicator stabilized around 69, while the Momentum indicator stabilized above the midline, suggesting upward potentials. On downside, the immediate support is 1.2340, unable to defend this level will resume the decline to 1.2200.


- Gold futures are edging lower in a limited trade late in the session on Wednesday as the US. Federal Reserve signaled that interest rates would stay elevated going into the new year and said it was too soon to consider rate hikes. The pair ended Wednesday at around 1807, still bullish in the daily chart.
- Prices fell initially after the Fed continued its battle against inflation by raising its benchmark interest rate to the highest level in 15 years. The FOMC voted to boost the overnight borrowing rate half a percentage point, taking it to a targeted range between 4.25% and 4.5%.
- Gains were capped by hawkish comments from Fed Chair Jerome Powell. He said the focus right now is really on moving our stance to one that is restrictive enough to ensure a return of inflation to our 2% goals over time, it’s not on rate cuts.
- Gold price stabilized around 1807, down for the day and bullish in the daily chart. The gold price still stabilized above 20 and 50 SMA, suggesting bullish strength in short term. Meanwhile, the 20 SMA continued accelerating north and developing above 50 SMA, indicating bulls not exhausted yet. On upside, the immediate resistance is 1824, break above this level will open the gate to extend the advance to 1834 area.
- From a technical perspective, the RSI indicator hold above the midline and stabilized around 64, suggesting bullish strength. The Momentum indicator stabilized above the midline, suggests upward potentials. On downside, the immediate support is 1795, below this area may resume the decline to 1777.


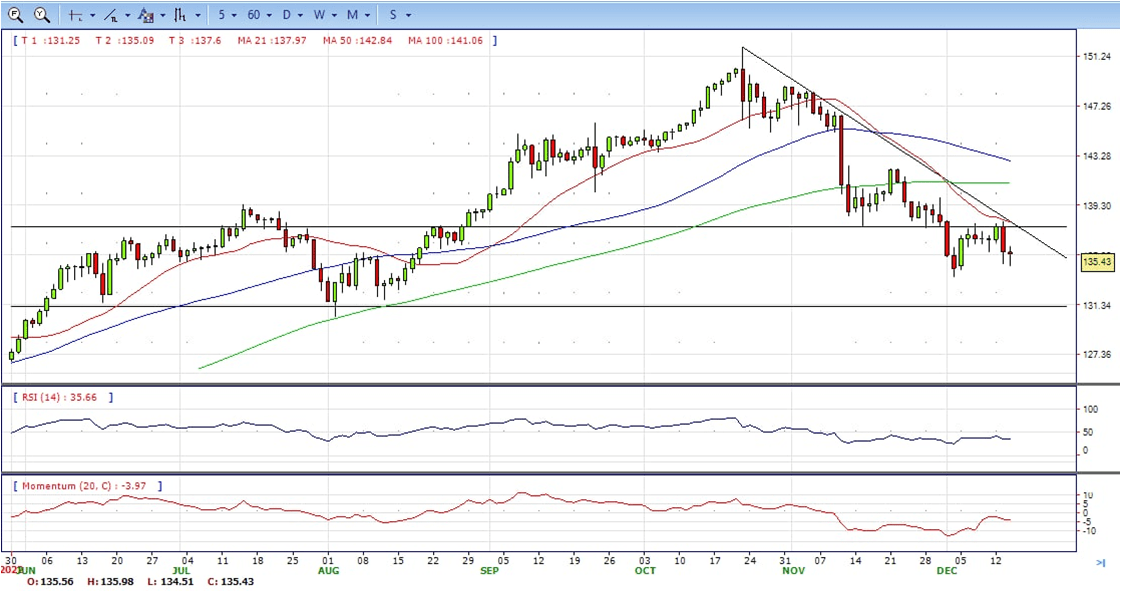
- USD/JPY surged to near 136.00 area post Fed rate decision. It failed to hold all the gains and back to 135.40 area to ended Wednesday, still bearish in the daily chart.
- The US Dollar Index is displaying sideways moves around a fresh six-month low at 103.49. The USD Index is expected to remain on tenterhooks as the Federal Reserve (Fed) has confirmed a smaller and slower interest rate hike approach after softening inflation data consecutively for two months.
- Fed chair Jerome Powell has hiked its terminal rate projection from 4.6% to 5.1%, which is to be achieved by the conclusion of CY2023. The Fed is subjected to keep policy restrictive till the achievement of price stability. While Fed chair Jerome Powell has not given any verdict on the recession whether it will arise or not. The next trigger that could create troubles for the Fed is the escalating Average Hourly Earnings, which could keep retail demand solid ahead.
- The USD/JPY pair stabilized around 135.40, down for the day and bearish in the daily chart. The price still maintains the downward slope and develops below all main SMAs, suggests bearish strength in short term. Meanwhile, 20 SMA continued accelerating south and developing below longer ones, indicating bears not exhausted. On upside, overcome 136.00 may encourage bulls to challenge 137.00, break above that level will open the gate to 138.00.
- Technical indicators suggest the bearish strength. RSI stabilized around 36, while the Momentum indicator continued developing below the midline, suggests downward potentials. On downside, the immediate support is 134.50, break below this level will open the gate to 133.60 area.
- DJI dipped to low 33960 post Fed lifted the rate by 50bps as expected. However, it trimmed half of its losses and ended Wednesday at 34300, unchanged for the day and bearish in the daily chart. The price stabilized below 20 and 50 SMA, suggests bearish strength in short term. Meanwhile, 20 SMA started turning south and heading towards 50 SMA, suggests bears not exhausted yet. On upside, overcome 34480 may encourage bulls to challenge 34670, break above this level will open the gate to 34900.
- Technical indicators indicates the bearish strength. RSI stabilized around 43, while the Momentum indicator stabilized in negative territory, suggests downward potentials. On downside, the immediate support is 33950, break below this level will open the gate for more decline to 33670 area.

- Brent continued the rally, advanced from intraday low 80.10 area to intraday high 83.15 level. It hold near the top and ended Wednesday at around 82.90, up for the day and bullish in the hourly chart. The price stabilized above 20 and 50 SMAs, suggests bullish strength in short term. Meanwhile, the 20 SMA continued accelerating north and developing above 50 SMA, indicating bullish bias. On upside, overcome 83.70 may encourage bulls to challenge 85.20, break above this level will open the gate to 86.50.
- Technical indicators suggest the bullish movement, hovering above the midline. RSI stabilized at around 71, while the Momentum indicator stabilized above the midline, suggests upward potentials. On downside, the immediate support is 81.00, break below this level will open the gate for more decline to 77.50 area.


