15/05/2023 Daily Reports
- The EUR/USD is falling on Friday, the fourth time in the last five days, extending its weekly losses. The pair is hovering near 1.0850, at the lowest level in a month, consolidating a weekly loss of more than 150 pips.
- The key driver is a stronger US Dollar across the board. The combination of a cautious tone in equity markets and higher US yields is boosting the Greenback. The US Dollar Index is up by 0.60% on Friday, trading above 102.50, at the highest level in a month. The Dow Jones is down by 0.31% and the Nasdaq is dropping by 0.53%. The US 10-year stands at 3.44% and the 2-year is approaching 4%.
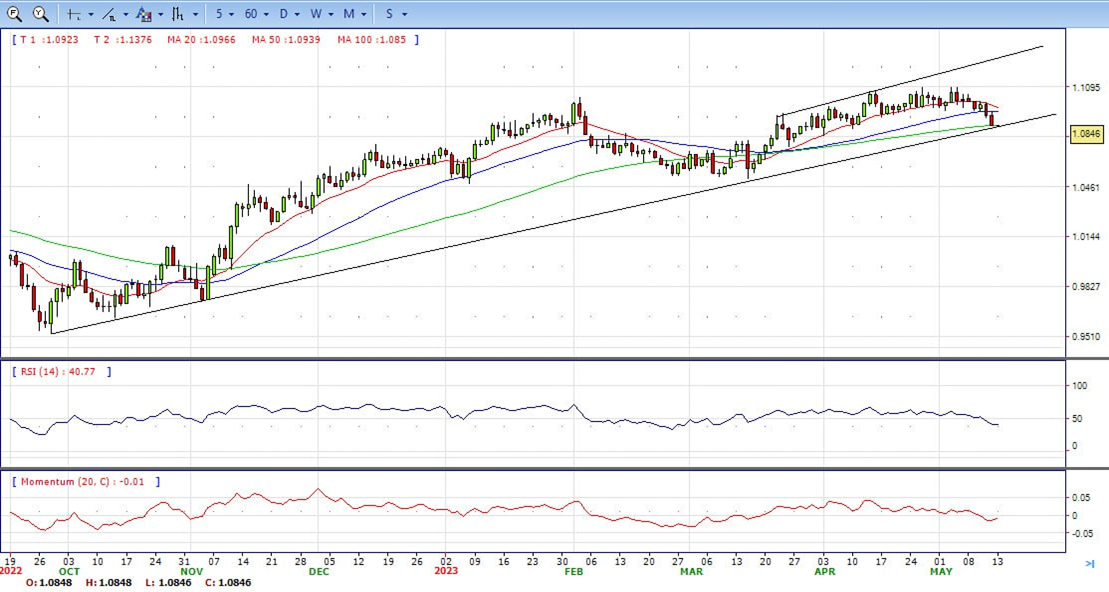
- The EUR/USD pair is trading near the 1.0850, down for the day with bearish stance in daily chart. The pair stabilized below 20 and 50 SMA, indicates bearish strength. Meanwhile, the 20 SMA started turning south and heading towards 50 and 200 SMA, suggests bears not exhausted yet. On upside, the immediate resistance is 1.0950, break above this level will extend the advance to 1.1005.
- Technical readings in the daily chart support the bearish stance. The RSI indicator stabilizes around 40. The Momentum indicator holds below the midline, indicating bearish potentials. On downside, the immediate support is 1.0830 and below this level will open the gate to 1.0710.
- The GBP/USD pair attracts fresh sellers following an early uptick to the 1.2540 region on Friday and drops to a one-and-half-week low during the early North American session. Spot prices slip below the 1.2500 psychological mark, with bears now awaiting a break below through the lower end of an ascending trend channel extending from the April swing low before placing fresh bet
- The British Pound continues to be undermined by the Bank of England Governor Andrew Bailey’s less hawkish comments on Thursday, indicating the possibility of a sharp fall in UK inflation. This, to a larger extent, overshadows mostly in-line UK GDP print for the first quarter of 2023 and the better-than-expected UK Manufacturing/Industrial Production figures for March. Apart from this, some follow-through US Dollar buying for the second straight day prompts some intraday selling around the GBP/USD pair.
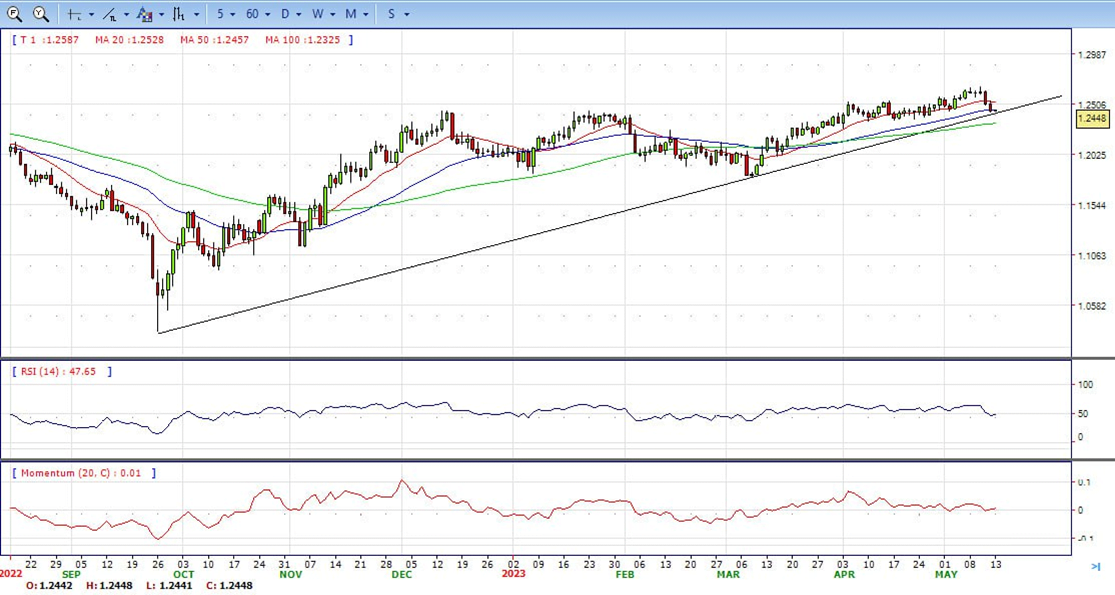
- The GBP/USD offers neutral to bearish stance in daily chart. Cable stabilizes below 20 and 50 SMA, indicating bearish strength in short term. Meanwhile, the 20 SMA started turning flat but continued developing above longer ones, suggests bulls not exhausted yet. On upside, the immediate resistance is 1.2540 with a break above it exposing to 1.2600.
- Technical readings in the daily chart support the neutral to bearish stances. RSI indicator stabilizes around 48, while the Momentum indicator stabilizes near the midline, suggesting directionless potentials. On downside, the immediate support is 1.2430, unable to defend this level will resume the decline to 1.2340.


- Gold price takes offers to refresh intraday low near $2,010, marking the consecutive third daily loss amid the market’s fears emanating from the US debt ceiling negotiations and banking woes. Also exerting downside pressure on the Gold price could be the softer yields and a cautious mood ahead of more clues of the US inflation.
- While portraying the mood, S&P 500 Futures print mild gains to differ from Wall Street’s mixed closing. However, the US 10-year and two-year Treasury bond yields remain pressured around 3.37% and 3.88% by the press time. The recently escalating market fears surrounding the US debt ceiling expiry and banking fallouts, seem to allow the US Dollar to brace for the first weekly gain in three while pushing down the US Treasury bond yields for the third consecutive week.
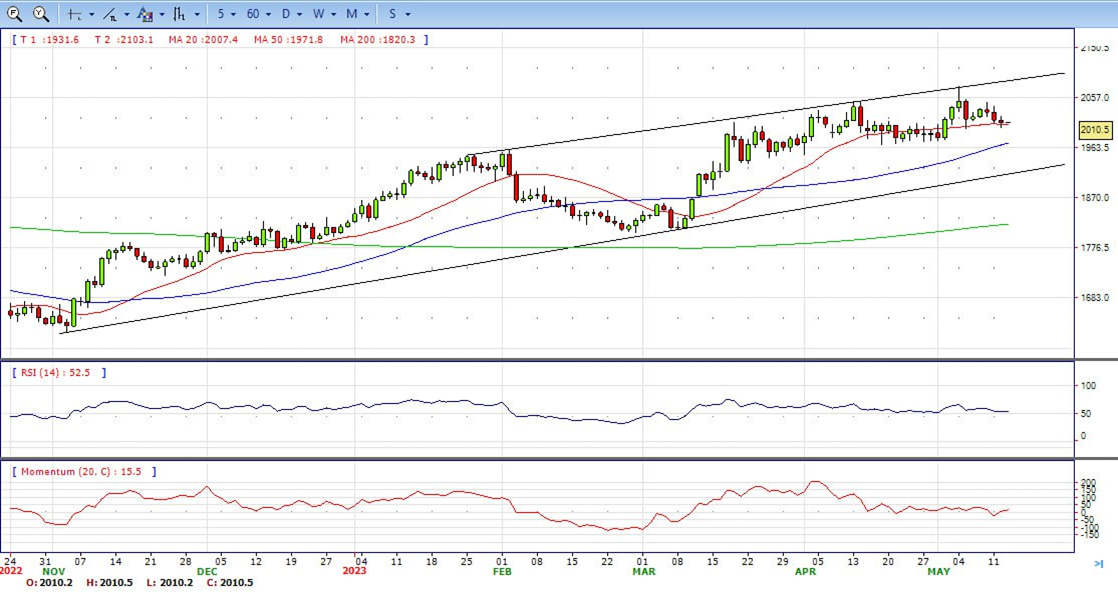
- Gold price stabilized around 2010, down for the day and neutral to bullish in the daily chart. The gold price stabilizes above 20 SMA, suggesting bullish strength in short term. Meanwhile, the 20 SMA started turning flat but continued developing far above 50 and 200 SMA, indicates bulls not exhausted yet. On upside, the immediate resistance is 2048, break above this level will open the gate for more advance to 2080 area.
- From a technical perspective, the RSI indicator holds above the mid-line and stabilizes around 53, on a bullish strength. The Momentum indicator hold in negative territory, suggests downward potentials. On downside, the immediate support is 2000, below this area may resume the decline to 1970.


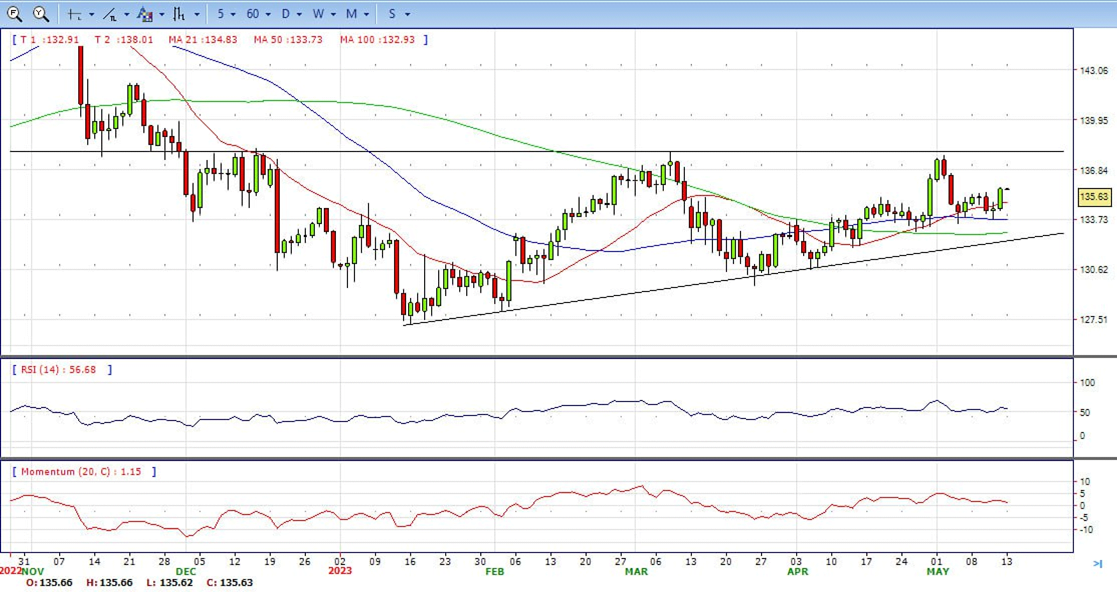
- The USD/JPY pair builds on the overnight goodish rebound from the 133.75 region, or a one-week low, and gains some follow-through traction for the second successive day on Friday. The pair maintains its bid tone through the early part of the European session and is currently placed around the 134.70 region, up over 0.20% for the day.
- A generally positive tone around the equity markets, along with the Bank of Japan’s dovish outlook, undermines the safe-haven JPY and turns out to be a key factor acting as a tailwind for the USD/JPY pair. It is worth recalling that the BoJ Governor Kazuo Ueda, speaking in parliament earlier this week, said it was too early to discuss specific plans for an exit from the massive stimulus programme.
- The USD/JPY pair stabilized around 135.60, up for the day and neutral to bullish in the daily chart. The price stabilizes between 20 and 50 SMA, suggests neutral strength in short term. Meanwhile, 20 SMA started turning flat but continued developing above longer ones, indicating bulls not exhausted. On upside, overcome 135.80 may encourage bulls to challenge 136.70, break above that level will open the gate to 137.90.
- Technical indicators suggest the neutral to bullish strength. RSI stabilizes around 55, while the Momentum indicator stabilizes just above the midline, suggests upward potentials. On downside, the immediate support is 134.60, break below this level will open the gate to 133.50 area.
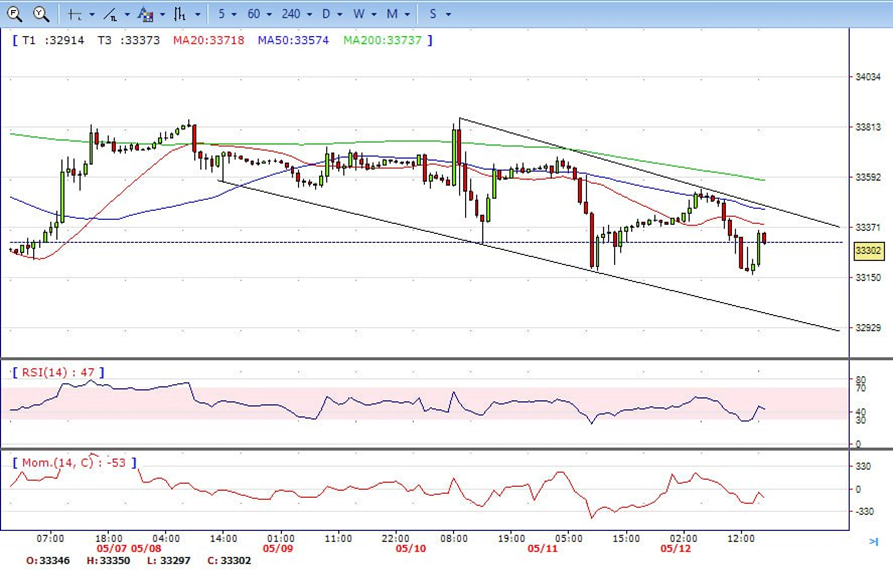
- DJI climbed to high 33542 on the first half of the day, but failed to hold that gains and ended the day around 33300. Right now market is standing below 20 and 50 SMA, suggests bearish strength. Meanwhile, 20 and 50 SMA started turning south and continued developing below 200 SMA, suggests bears not exhausted yet. On upside, overcome 33550 may encourage bulls to challenge 33680, break above that level will open the gate to 33900.
- Technical indicators suggest the bearish movement. RSI stabilizes around 43, while the Momentum indicator stabilizes below the midline, suggests downward potentials. On downside, the immediately support is 33160, break below this level will open the gate for more decline to 33000 area.
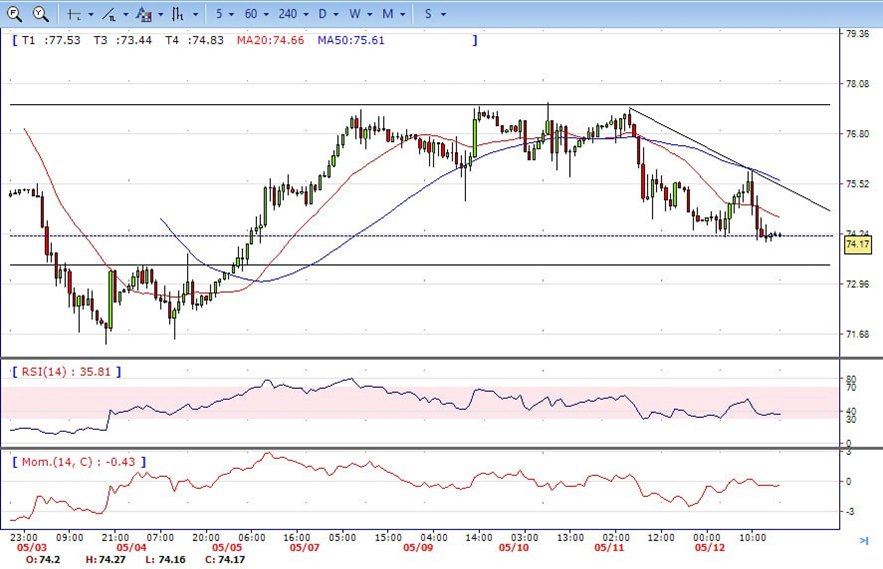
- Brent under the renewal sell pressure on Friday, traded from intraday high 75.840 area to low 74.04 level. It holds near the bottom and ended the day around 74.15, down for the day and indicates bearish sign in the hourly chart. Meanwhile, the 20 SMA continued accelerating south and developing far below longer ones, indicates bears not exhausted yet. On upside, overcome 77.60 may encourage bulls to challenge 79.20, break above that level will open the gate to 80.60.
- Technical indicators also suggest bearish movement, hovering below the midline. RSI stabilizes at 36, while the Momentum indicator stabilizes in negative territory, suggests downward potentials. On downside, the immediately support is 74.00, break below this level will open the gate for more decline to 73.40 area.