12/05/2023 Daily Reports
- EUR/USD faces renewed downside pressure in response to the resurgence of the risk aversion and the consequent investors’ move towards the greenback. The selling pressure gathers impulse and flirts with the area of 4-week lows near 1.0900 on Thursday.
- EUR/USD debilitates further and revisits levels last seen in mid-April in the proximity of the 1.0900 neighbourhood, always on the back of the intense recovery in the US Dollar and the persevering risk-off environment. In the US calendar, Producer Prices rose less than expected in April: 0.2% MoM and 2.3% YoY. In addition, Initial Jobless Claims increased by 264K in the week to May 6, also more than anticipated.
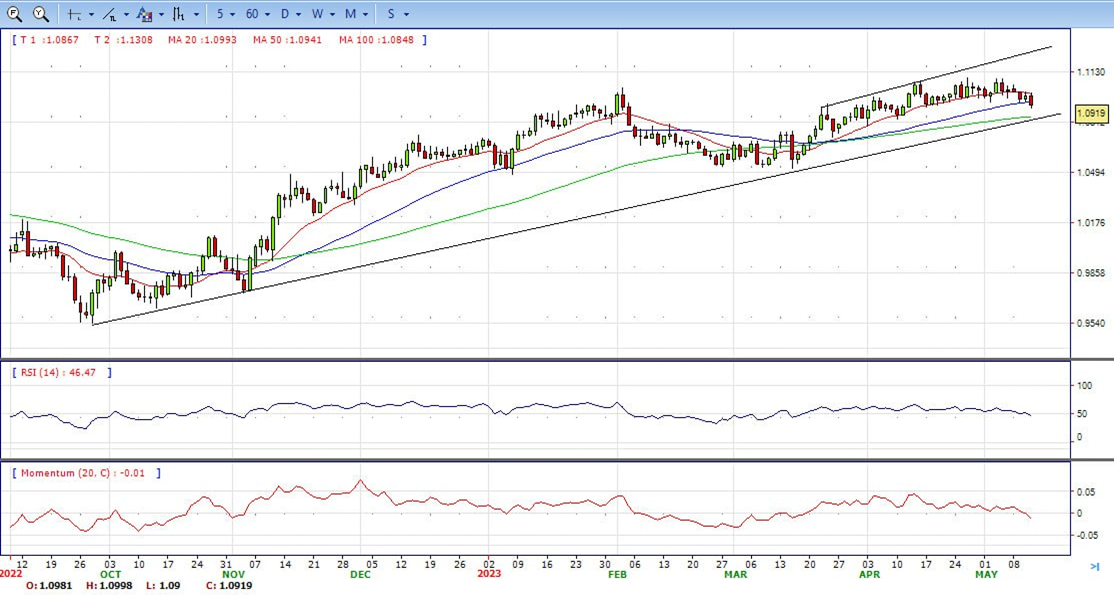
- The EUR/USD pair is trading near the 1.0920, down for the day with bearish stance in daily chart. The pair stabilized below 20 and 50 SMA, indicates bearish strength. Meanwhile, the 20 SMA started turning south and heading towards 50 and 200 SMA, suggests bears not exhausted yet. On upside, the immediate resistance is 1.0950, break above this level will extend the advance to 1.1005.
- Technical readings in the daily chart support the bearish stance. The RSI indicator stabilizes around 46. The Momentum indicator holds below the midline, indicating bearish potentials. On downside, the immediate support is 1.0900 and below this level will open the gate to 1.0830.
- The Pound Sterling experiences heightened volatility against the US Dollar following the BoE monetary policy meeting on Thursday. It is trading in the lower 1.25s at the time of writing, showing a bearish short-term bias as investors digest the BoE event.
- GBP/USD initially fell following the BoE’s announcement of its decision by a vote of 7-2 to raise interest rates by 0.25% bringing the Bank Rate to 4.50%. Dovish opening remarks from the BoE’s Chairman Andrew Bailey further weighed on the pair, after he said the committee had good reason to believe headline inflation would fall considerably from April onwards. The Pound Sterling recovered later during Bailey’s press conference, however, when he emphasized secondary effects and how “risks to inflation continue to be skewed to the upside as secondary effects persist”.
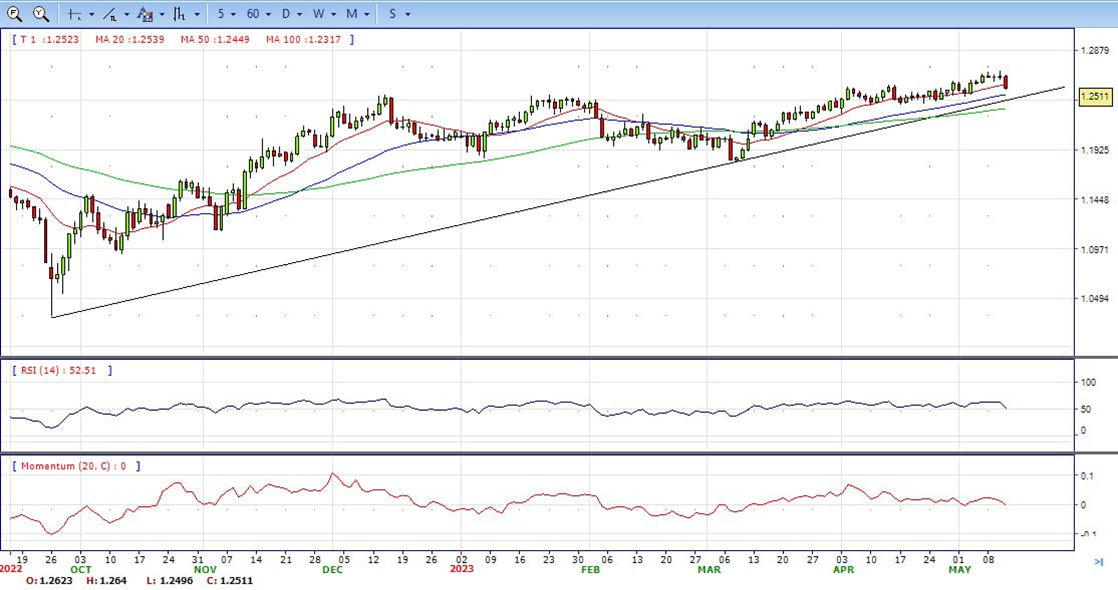
- The GBP/USD offers neutral to bearish stance in daily chart. Cable stabilizes between 20 and 50 SMA, indicating neutral strength in short term. Meanwhile, the 20 SMA started turning flat but continued developing above longer ones, suggests bulls not exhausted yet. On upside, the immediate resistance is 1.2600 with a break above it exposing to 1.2680.
- Technical readings in the daily chart support the neutral stances. RSI indicator stabilizes around 50, while the Momentum indicator stabilizes near the midline, suggesting directionless potentials. On downside, the immediate support is 1.2430, unable to defend this level will resume the decline to 1.2340.


- Gold price struggles to crack resistance around $2040, slumps after a round of US economic data showed that inflation in the US is somewhat decelerating while the labor market cools down, as unemployment claims exceeded estimates. That said, data proved to be USD positive, as shown by the Gold price, printing back-to-back days of losses. The XAU/USD is trading at $2014, down 0.82%.
- The economy in the US is deteriorating further amidst the ongoing tightening cycle by the US Fed. The US Department of Labor was busy during the day, revealing crucial data that could share clues regarding the Fed’s decision for the upcoming meeting in June. The so-called wholesale prices of the PPI, rose 2.3% YoY below estimates of 2.4%, while the core PPI, which excludes volatile items, remained higher than the headline numbers. Figures came at 3.2% below the 3.3% foreseen by analysts.
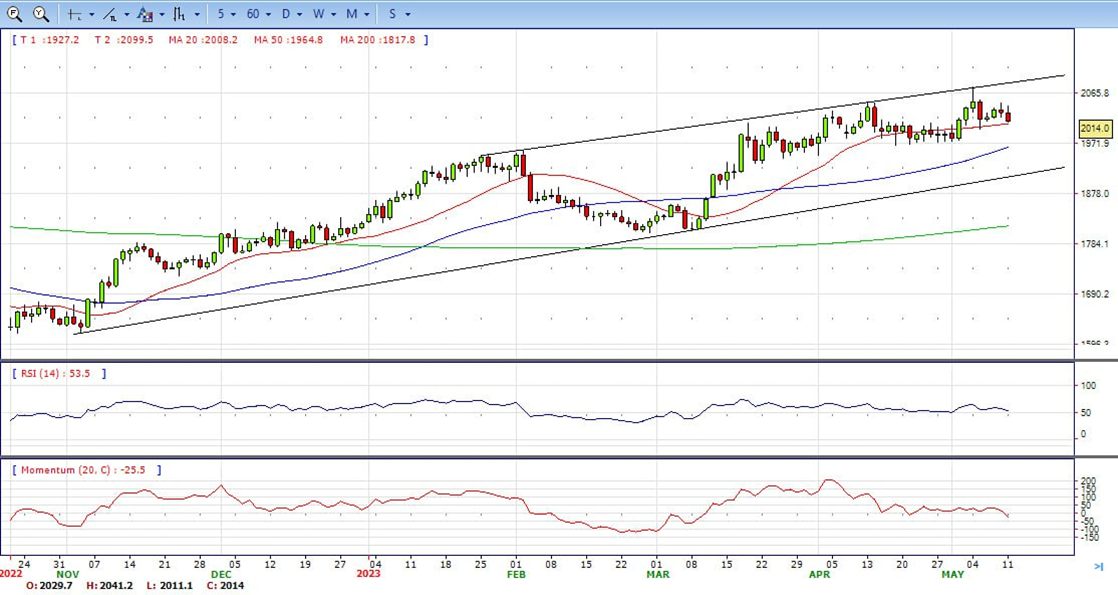
- Gold price stabilized around 2014, down for the day and neutral to bullish in the daily chart. The gold price stabilizes above 20 SMA, suggesting bullish strength in short term. Meanwhile, the 20 SMA started turning flat but continued developing far above 50 and 200 SMA, indicates bulls not exhausted yet. On upside, the immediate resistance is 2048, break above this level will open the gate for more advance to 2080 area.
- From a technical perspective, the RSI indicator holds above the mid-line and stabilizes around 54, on a bullish strength. The Momentum indicator hold in negative territory, suggests downward potentials. On downside, the immediate support is 2000, below this area may resume the decline to 1970.


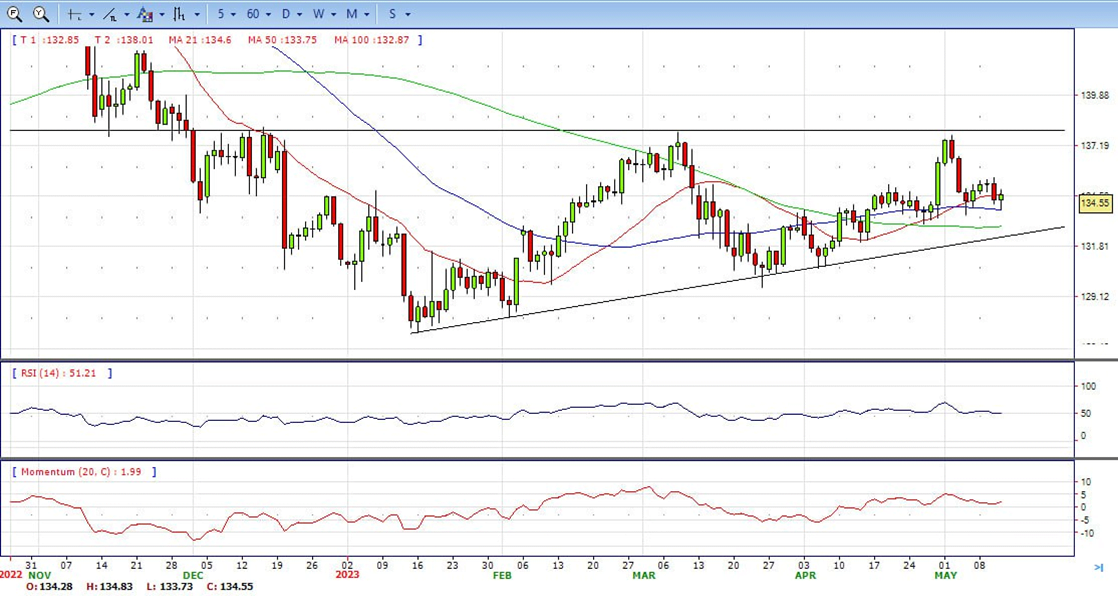
- The USD/JPY pair attracts fresh selling following an intraday uptick to the 134.85 region and turns back lower for the second straight day on Thursday. Spot prices gained some positive ground through the latter of North American session and ended the day with gains, around the 134.50 area in the last hour.
- Against the backdrop of concerns over the US debt ceiling, mixed Chinese inflation figures released on Thursday fuel worries about the economic outlook for the second quarter and tempers investors’ appetite for riskier assets. This is evident from a fresh leg down in the equity markets, which boosts demand for the safe-haven Japanese Yen and exerts downward pressure on the USD/JPY pair.
- The USD/JPY pair stabilized around 134.50, up for the day and neutral to bullish in the daily chart. The price stabilizes between 20 and 50 SMA, suggests neutral strength in short term. Meanwhile, 20 SMA started turning flat but continued developing above longer ones, indicating bulls not exhausted. On upside, overcome 135.70 may encourage bulls to challenge 136.70, break above that level will open the gate to 137.90.
- Technical indicators suggest the neutral to bullish strength. RSI stabilizes around 50, while the Momentum indicator stabilizes just above the midline, suggests upward potentials. On downside, the immediate support is 133.50, break below this level will open the gate to 132.00 area.
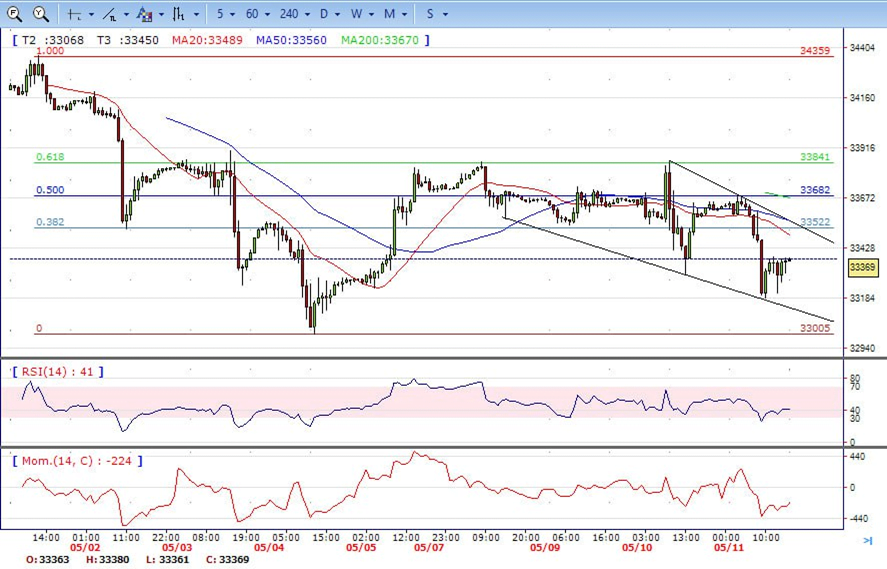
- DJI under the fresh sell pressure on Thursday, tumbled from intraday high 33680 area to low 33180. It bounced from here, recovered half of daily losses and ended the day around 33370. Right now market is standing below 20 and 50 SMA, suggests bearish strength. Meanwhile, 20 and 50 SMA started turning south and continued developing below 200 SMA, suggests bears not exhausted yet. On upside, overcome 33550 may encourage bulls to challenge 33680, break above that level will open the gate to 33900.
- Technical indicators suggest the bearish movement. RSI stabilizes around 41, while the Momentum indicator stabilizes below the midline, suggests downward potentials. On downside, the immediately support is 33180, break below this level will open the gate for more decline to 33000 area.
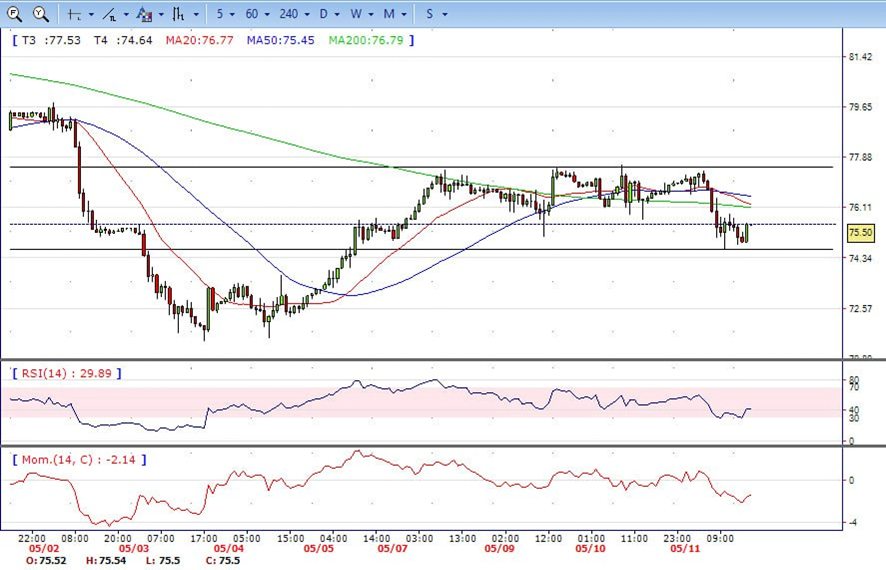
- Brent under the renewal sell pressure on Thursday, traded from intraday high 77.40 area to low 74.60 level. It bounced modestly and ended the day around 75.50, down for the day and indicates bearish sign in the hourly chart. Meanwhile, the 20 SMA started turning south and heading towards longer ones, indicates bears not exhausted yet. On upside, overcome 77.60 may encourage bulls to challenge 79.20, break above that level will open the gate to 80.60.
- Technical indicators also suggest bearish movement, hovering below the midline. RSI stabilizes at 42, while the Momentum indicator stabilizes in negative territory, suggests downward potentials. On downside, the immediately support is 74.60, break below this level will open the gate for more decline to 73.40 area.