EUR/USD
- The Euro finished the week on a higher note, following the release of a soft inflation report in the United States, as informed by the Department of Labor October’s CPI report. Therefore, the Euro continued its advance, as the EURUSD gained 1.42%, exchanging hands at 1.0352.
- Wall Street finished the week with solid gains. The US inflation report on Thursday showed that core CPI, closely followed by the Federal Reserve, eased from 6.6% YoY in September to 6.3%, well below estimates. Meanwhile, the University of Michigan (UoM) Consumer Sentiment for November tumbled to a four-month low from 59.5 to 54.7, as reported on Friday. Delving the UoM poll, inflation expectations for the one-year horizon increased to 5.1%, while the five to 10-year horizon jumped from 2.9% to 3%.
- Aside from this, a tranche of European Central Bank (ECB) policymakers crossed newswires and kept its hawkish stance, bolstering the Euro. ECB member Robert Holtzman said he would vote for a 50 or 75 bps hike at the December meeting, while the ECB Vice-President Luis De Guindos said that a technical recession in the Eurozone is likely, and added that markets overreacted to US CPI.
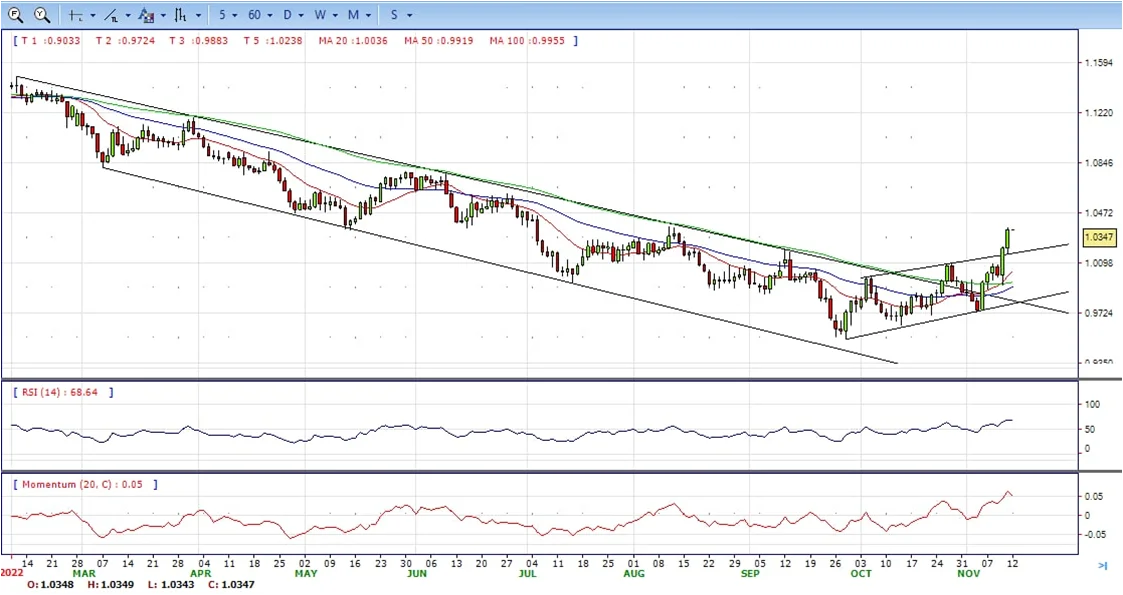
- The EUR/USD pair is trading near the 1.0352, up for the day with bullish stance in daily chart. The pair stabilized above 20 and 50 SMA, indicates bullish strength. Meanwhile, the 20 SMA continued accelerating north and developing above longer ones, suggests bulls not exhausted yet. On upside, the immediate resistance is 1.0370, break above this level will extend the advance to 1.0500.
- Technical readings in the daily chart support the bullish stances. The RSI indicators hovering above the midlines and stabilized around 68. The Momentum indicator stabilized above the midline, indicating upward potentials. On downside, the immediate support is 1.0200 and below this level will open the gate to 1.0100.
Open A Demo
CDO has wide range of tools, professional and friendly support for clients to achieve their financial markets trading goals. Open a live account now to enjoy this experience with virtual deposit.
GBP/USD
- The pound has rallied for the second consecutive day against a battered US Dollar, to hit fresh two-week highs at 1.1840 so far. On the weekly chart, the pair is on track to a 4.8% rally in its best weekly performance in more than two years.
- Preliminary UK Gross Domestic Product has shown a 0.2% contraction in the third quarter, significantly above the -0.5% market consensus following a 0.2% advance in the previous quarter. Year on year, the UK economy slowed down to 2.4% from 4.4%, still better than the 2.1% reading anticipated by market analysts.
- On the other end, the US Dollar has extended its sell-off, triggered by the softer US inflation figures seen on Thursday, which has acted as a tailwind for the pair. US CPI slowed down to a 7.7% yearly rate in October, according to data from the US Bureau for Labor Statistics, well below market expectations of 8% and down from the 8.2% reading seen in September.
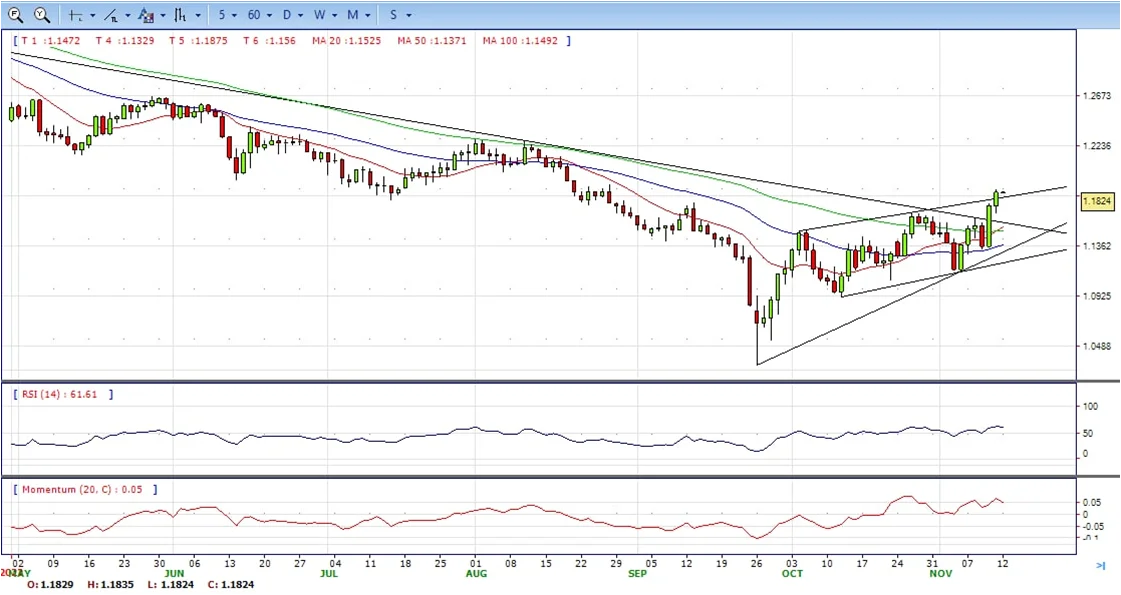
- The GBP/USD offers bullish stance in daily chart. Cable stabilized above all main SMAs, indicating bullish strength in short term. Meanwhile, the 20 SMA continued accelerating north and developing above longer ones, suggests bulls not exhausted yet. On upside, The immediate resistance is 1.1740 with a break above it exposing to 1.1900.
- Technical readings in the daily chart support the bullish stances. RSI indicator stabilized around 58, while the Momentum indicator stabilized above the midline, suggesting upward potentials. On downside, the immediate support is 1.1640, unable to defend this level will resume the decline to 1.1500.

CDO TRADER
CDO TRADER, our cutting-edge trading platform, follows the technology from the forefront with new features added continuously. Moreover, CDO TRADER is now available for Android and iOS! So it allows you to trade on the go!
XAU/USD
- Gold price advances steadily in the North American session, clinging to its Thursday gains. Factors like a softer US CPI report, and China’s relaxing some Covid-19 restrictions, were cheered by investors, as shown by US equity futures trading in the green. At the time of writing, the XAUUSD is trading at $1761, above its opening price, after hitting a daily low of $1747.
- US equities are set for a higher open, as shown by the futures market. The crypto turmoil keeps the Nasdaq pressured, as FTX began the chapter 11 process, but an optimistic US inflation report augmented speculations for a less aggressive Federal Reserve (Fed). The October US inflation report showed that headline and core CPI’s, albeit above the Fed’s target, eased compared with the last month’s figures. US CPI rose by 7.7% YoY, below estimates of 7.9% and core CPI, which excludes volatile items and was bucking the CPI downtrend, fell to 6.3% YoY, below the 6.5% expected.
- Gold’s reacted positively to the report and finished Thursday’s session at $1757, for a 2.86% gain. Contrarily, US Treasury bond yields plunged, with the US 10-year Treasury yield dropping 28 bps, closing at 3.829%. Of note, the US bond market will be closed on Friday in observance of the Veteran’s Day Holiday.
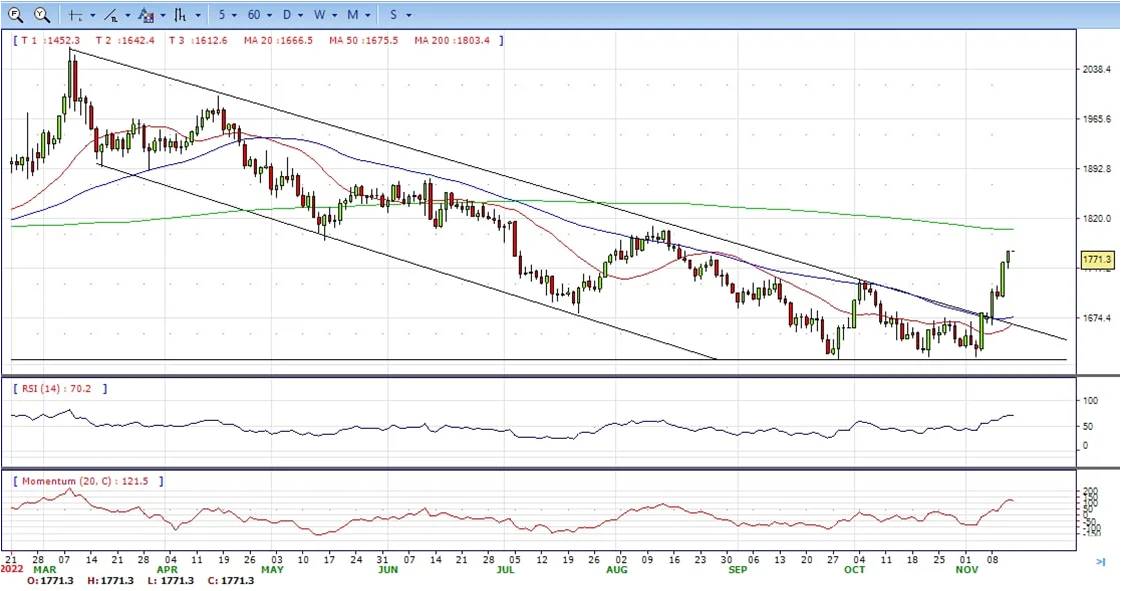
- Gold price stabilized around 1771, up for the day and bullish in the daily chart. The gold price stabilized above 20 and 50 SMA, suggesting bullish strength. Meanwhile, the 20 SMA started turning north and heading towards longer ones, indicating bulls not exhausted yet. On upside, the immediate resistance is 1785, break above this level will open the gate to extend the advance to 1800 area.
- From a technical perspective, the RSI indicator hold above the midline and stabilized around 71, suggesting bullish strength. The Momentum indicator stabilized above the midline, suggests upward potentials. On downside, the immediate support is 1732, below this area may resume the decline to 1700.
MetaTrader 4
MT4 has user friendly interface that is providing simplicity and efficiency. The traders can perform trading strategies for different products like Forex and CFD. MetaTrader 4 has over 50 built-in indicators, also it’s the tool that predicts trends and defines the appropriate entry and exit points.

USD/JPY
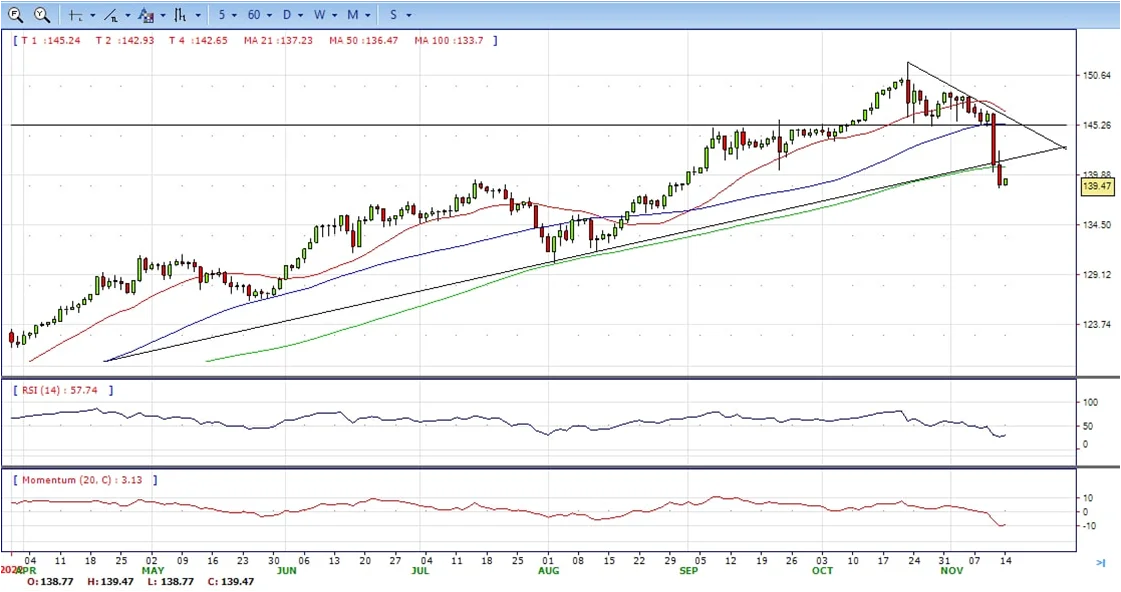
- The USDJPY extended its free fall and plummeted another 200 plus pips on Friday, below140.00. Speculations that the Federal Reserve might slow the pace of rate hikes and US Treasury yields falling are the two main factors weighing on the US Dollar. Therefore, the USDJPY is trading at 138.54, below its opening price by 1.73%.
- The collapse of the Dollar and lower US yields sent the USDJPY down during the week from 147.15 to levels under 139.00, falling almost 6% on the worst week in years. The pair is back at August levels and clearly below the 20-week Simple Moving Average for the first time since January 2021.
- Next week, attention will continue to be on the USD’s trend. Economic data in the US includes the Producer Price Index on Tuesday and Retail Sales on Wednesday. In Japan, the National CPI will be released Friday with an increase expected from 3.0% to 3.7%. “In a sign that inflation is becoming more broad-based, core ex-energy is expected at 2.4% y/y vs. 1.8% in September. Yet the BOJ shows no signs of pivoting under Governor Kuroda.
- The USD/JPY pair stabilized around 138.80, down for the day and bearish in the daily chart. The price still maintains the downward slope but got some support from 200 SMA, suggests bearish strength in short term. Meanwhile, 20 SMA started turning south and heading towards longer ones, indicating bears not exhausted. On upside, overcome 140.30 may encourage bulls to challenge 142.50, break above that level will open the gate to 145.30.
- Technical indicators suggest the bearish strength. RSI stabilized around 31, while the Momentum indicator continued developing below the midline, suggests downward potentials. On downside, the immediate support is 138.00, break below this level will open the gate to 136.00 area.
DJI
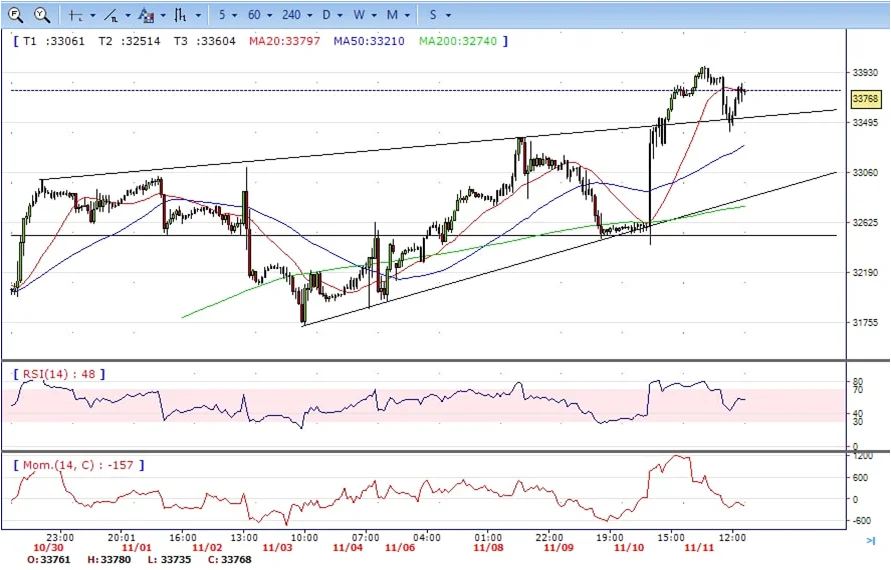
- DJI continued the advance, jumped to 33980 intraday high. It trimmed some gains and ended Friday at around 33770, unchanged for the day and bullish in the hourly chart. The price stabilized above all main SMAs, suggests bullish strength. Meanwhile, 20 SMA continued developing above longer ones despite it started turning flat, suggests bulls not exhausted yet. On upside, overcome 34000 may encourage bulls to challenge 34000, break above this level will open the gate to 34300.
- Technical indicators suggest the bullish strength. RSI stabilized around 58, while the Momentum indicator stabilized near the midline, suggests directionless potentials. On downside, the immediate support is 33400, break below this level will open the gate for more decline to 33200 area.
BRENT
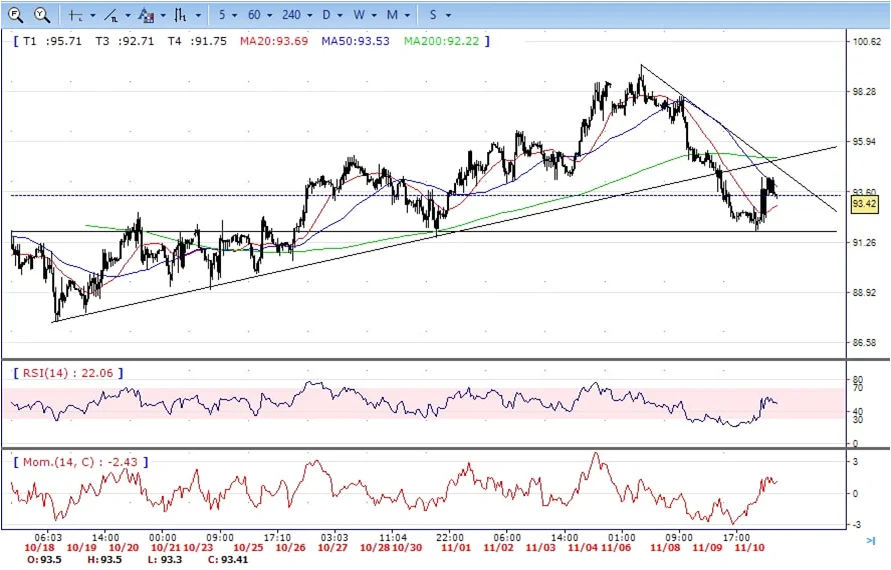
- Brent continued the advance, climbed from intraday low 93.30 area to intraday high 96.90, it retreated modestly and ended Friday at around 95.90, up for the day and bullish in the hourly chart. The price stabilized above 20 and 50 SMAs, suggests bullish strength in short term. Meanwhile, the 20 SMA continued accelerating north and heading towards longer ones, indicating bulls not exhausted yet. On upside, overcome 97.00 may encourage bulls to challenge 98.00, break above this level will open the gate to 99.60.
- Technical indicators suggest the neutral to bullish movement, hovering above the midline. RSI stabilized at around 58, while the Momentum indicator stabilized near the midline, suggests directionless potentials. On downside, the immediate support is 95.00, break below this level will open the gate for more decline to 93.30 area.
Contact Us
Please, fill the form to get an assistance.


