12/10/2022 Daily Reports
- Euro’s reversal from 0.9750 area earlier on Monday’s US trading session found support tight above the two-week low at 0.9670 and the pair is now trading above 0.9700 again.
- In absence of first-tier macroeconomic events, the sour market mood reflected on the negative stock indexes has been weighing on the pair’s bullish attempts, with the USD underpinned by its safe-haven status. The common currency is ticking up on the daily chart, in an attempt to put an end to a four-day decline.
- In absence of first-tier macroeconomic events, the sour market mood reflected on the negative stock indexes has been weighing on the pair’s bullish attempts, with the USD underpinned by its safe-haven status. The common currency is ticking up on the daily chart, in an attempt to put an end to a four-day decline.
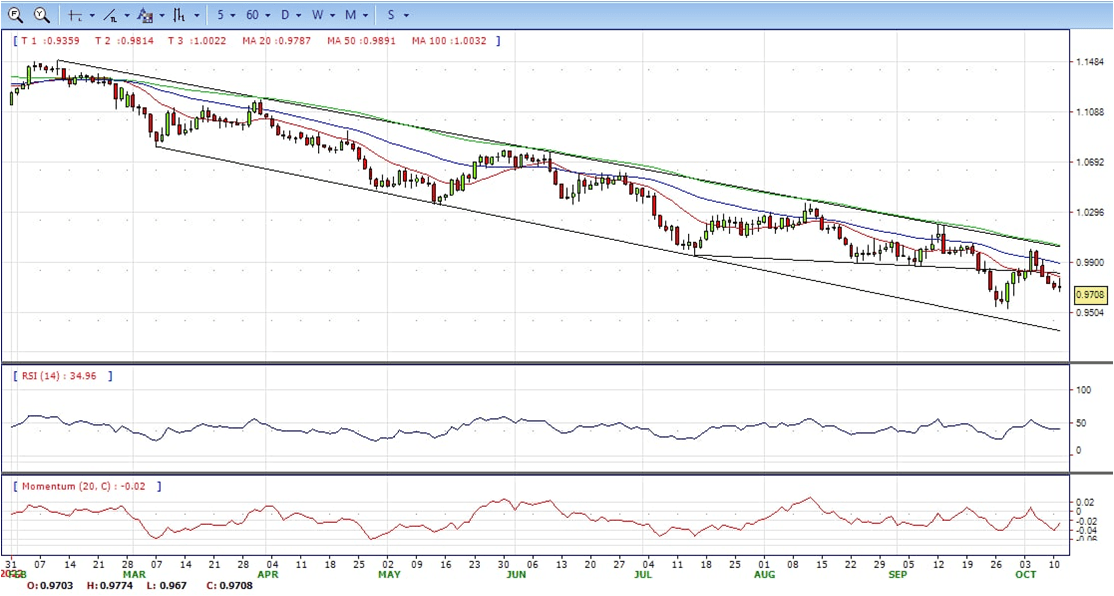
- The EUR/USD pair is trading near the 0.9705, unchanged for the day with the bearish stance in daily chart. The pair stabilized below 20 and 50 SMA, indicates bearish strength. Meanwhile, the 20 SMA continued developing far below longer ones despite it started turning flat, suggests bears not exhausted yet. On upside, the immediate resistance is 0.9820, break above this level will extend the advance to 1.0000.
- Technical readings in the daily chart support the bearish stances. The RSI indicators hovering below the midlines and stabilized around 40. The Momentum indicator stabilized in the negative territory, indicating downward potentials. On downside, the immediate support is 0.9670 and below this level will open the gate to 0.9630.
- The British pound has extended its reversal from session highs near 1.1180 to hit lows at 1.0955 after BoE Governor Andrew Bailey spooked investors, revealing the latest monetary policy measures to stabilize the financial system.
- Bailey has warned about unprecedented volatility in the long end of the gilt market and urged pension fund managers to finish rebalancing their portfolios by Friday when the bow is planning to end its emergency support program for the country’s bond market.
- The Bank expanded the bond-buying program on Tuesday to include inflation-linked debt, two weeks after having launched it in an attempt to manage the turmoil in the bond markets triggered by Prime Minister Liz Truss’s announcement of unfunded tax cuts.
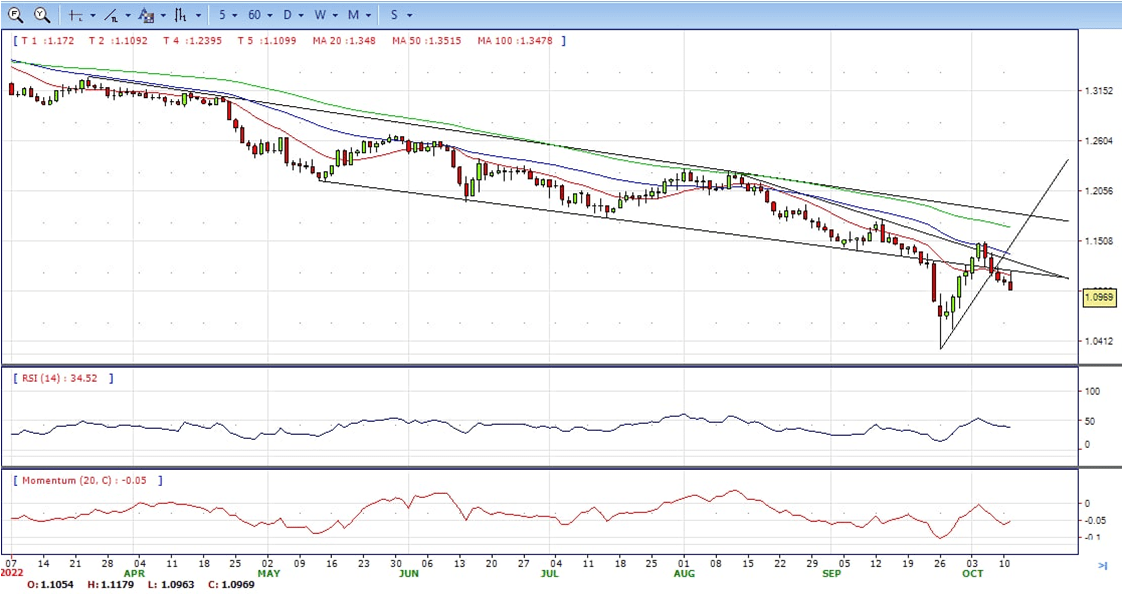
- The GBP/USD offers bearish stance in daily chart, it maintains the downward slope after hit 1.1180 high. Cable now is stabilizing below 20 and 50 SMA, indicating bearish strength in short term. Meanwhile, the 20 SMA continued developing below longer ones despite it started turning flat, suggesting bears not exhausted yet. On upside, The immediate resistance is 1.1180 with a break above it exposing to 1.1225.
- Technical readings in the daily chart support bearish stances. RSI indicator stabilized around 38, while the Momentum indicator stabilized below the midline, suggesting downward potentials. On downside, the immediate support is 1.0920, unable to defend this level will resume the decline to 1.0760.

- Gold price is slightly down during the North American session, due to high US T-bond yields, alongside a strong US dollar, ahead of crucial US inflation figures to be released on Thursday, The pair is trading at $1666, still bearish in the daily chart
- Sentiment remains deteriorated amidst fears that global central bank tightening would slash corporate earnings while dampening the economic outlook. The US 10-year Treasury bond yield is down by four bps but around YTD highs at 3.92%, while the greenback is pairing earlier losses.
- Last week’s US Nonfarm Payrolls report was better than estimated, confirming that the economy added more than 260K jobs. Even though the hiring pace slowed, the Unemployment rate decreased from 3.7% to 3.5%, which is not what the US Federal Reserve needs. Given that the labor market remains tight, further rate hikes by the Fed are expected.
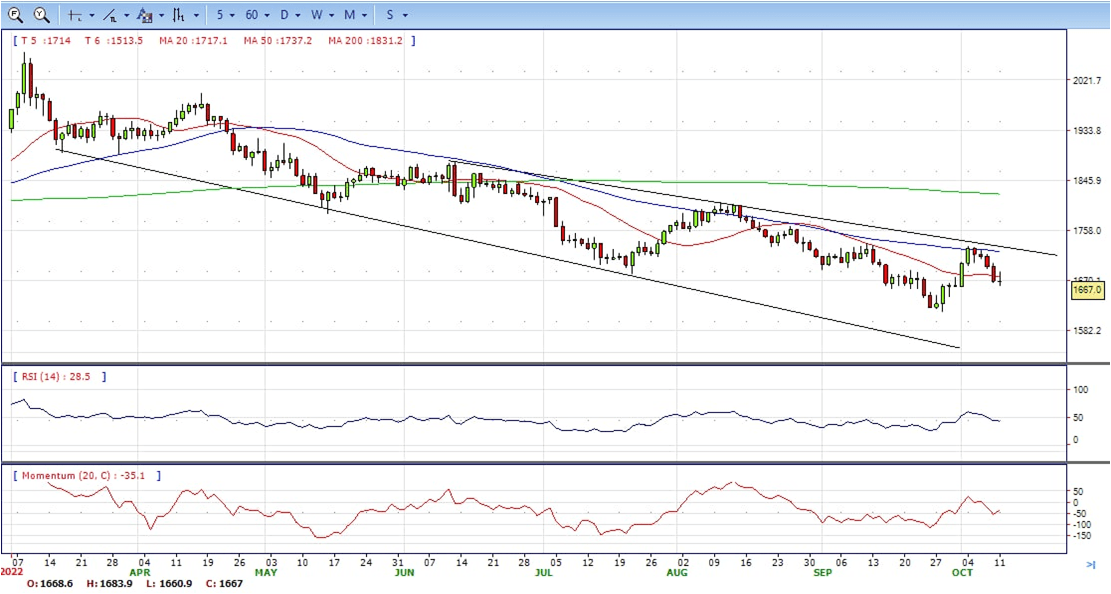
- Gold price stabilized around 1666, down for the day and neutral in the daily chart. The gold price stabilized below 20 and 50 SMA, suggesting bearish strength. Meanwhile, the 20 SMA continued developing far below longer ones despite it started turning flat, indicating bears not exhausted yet. On upside, the immediate resistance is 1684, break above this level will open the gate to extend the advance to 1700 area.
- From a technical perspective, the RSI indicator hold below the midline and stabilized around 43, suggesting bearish strength. The Momentum indicator struggled below the midline, suggests downward potentials. On downside, the immediate support is 1660, below this area may resume the decline to 1641.


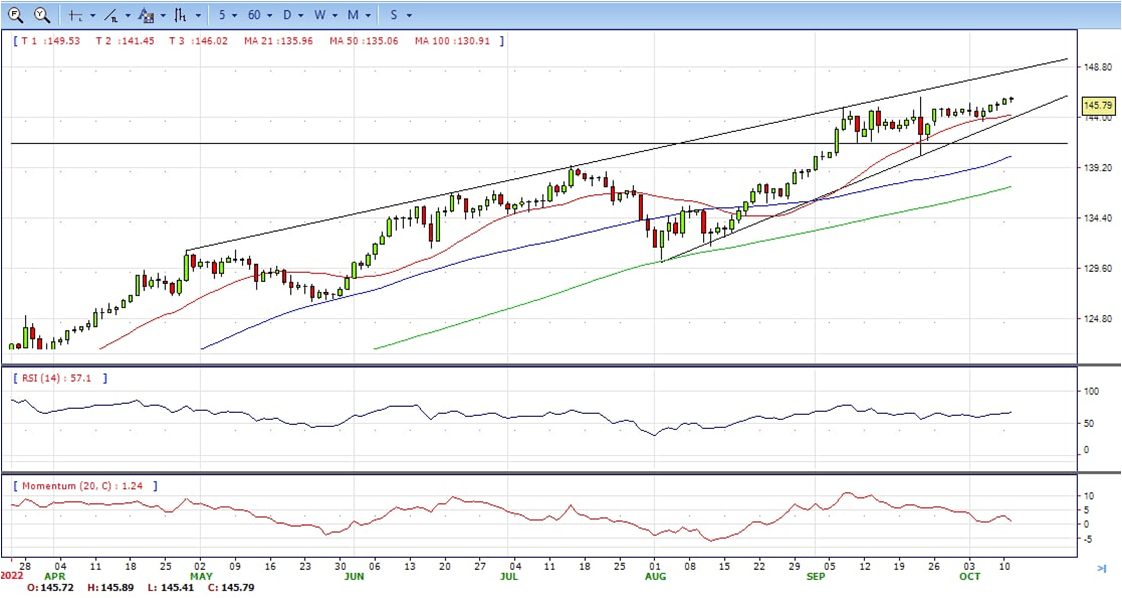
- The USD/JPY pair struggles to capitalize on its modest intraday uptick on Tuesday and retreats a few pips from the vicinity of a 24-year top touched in September. The pair trades near the higher end of its daily range around 145.75, still bullish in the daily chart.
- The USD surrenders its early gains to over a one-week high amid a modest pullback in the US Treasury bond yields, which, in turn, acts as a headwind for the USD/JPY pair. That said, growing acceptance that the Fed will continue to tighten its monetary policy at a faster pace to tame inflation should limit the downside for the US bond yields and the greenback.
- The Bank of Japan, on the other hand, has been lagging behind other major central banks in the process of policy normalisation. Furthermore, Japan’s Prime Minister Fumio Kishida said on Tuesday that the BoJ needs to stick to its ultra-lose policy setting until wages rise. The resultant Fed-BoJ policy divergence could further offer some support to the USD/JPY pair.
- The USD/JPY pair stabilized around 145.75, unchanged for the day and bullish in the daily chart. The price still maintains the upward slope and stabilized above all main SMAs, suggests bullish strength. Meanwhile, 20 SMA continued accelerating north and developing above longer ones, indicating bulls not exhausted in the long term. On upside, overcome 146.00 may encourage bulls to challenge 147.00, break above that level will open the gate to 148.00.
- Technical indicators suggest the bullish strength. RSI stabilized around 67, while the Momentum indicator continued developing above the midline, suggests upward potentials. On downside, the immediate support is 144.80, break below this level will open the gate to 143.50 area.


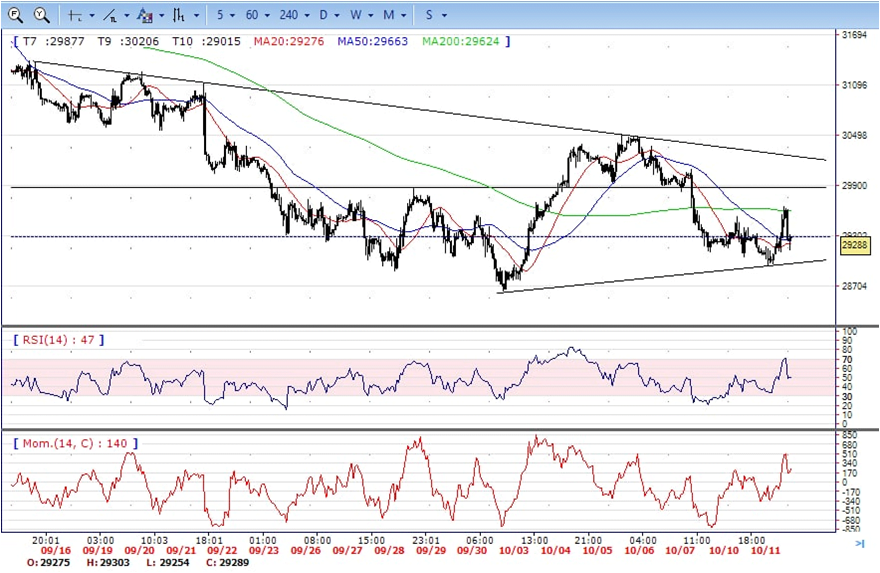
- DJI made a sharp U-turn on the later of US session, retreated from the intraday top 29660 area to intraday low 29140 region. it bounced modestly and ended the day at around 29285, unchanged for the day and neutral to bullish in the hourly chart. It stabilized above all main SMAs, suggests bullish strength. However, 20 SMA continued developing below longer ones despite it started turning flat, suggesting bears not exhausted yet. On upside, overcome 29650 may encourage bulls to challenge 29850, break above this level will open the gate to 30100.
- Technical indicators suggest the neutral strength. RSI stabilized around 50, while the Momentum indicator stabilized above the midline, suggests upward potentials. On downside, the immediate support is 29100, break below this level will open the gate for more decline to 28950 area.
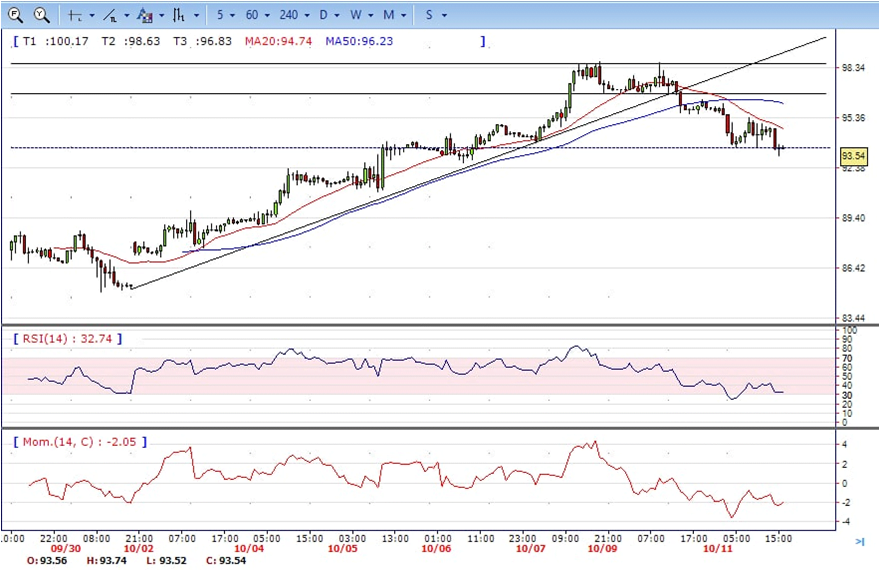
- Brent still under the sell pressure, retreated from intraday high 96.46 to 93.10 region. It hold near the bottom to ended Tuesday, bearish in the hourly chart. The price stabilized below 20 and 50 SMAs, suggests bearish strength in short term. Meanwhile, the 20 SMA continued accelerating south and heading towards longer ones, indicating bears not exhausted yet. On upside, overcome 95.40 may encourage bulls to challenge 96.60, break above this level will open the gate to 98.50.
- Technical indicators suggest the bearish movement, hovering below the midline. RSI stabilized around 33, while the Momentum indicator stabilized in negative territory, suggests downward potentials. On downside, the immediate support is 92.60, break below this level will open the gate for more decline to 91.00 area.