11/10/2022 Daily Reports
- Euro’s reversal from 0.9750 area earlier on Monday’s US trading session found support tight above the two-week low at 0.9680 and the pair is now trading above 0.9700 again.
- On a bigger picture, investors’ concerns about the escalating war in Ukraine, after Russia launched the biggest attack since the start of the war, coupled with the impact of higher oil prices are undermining confidence in the Eurozone economic prospects and weighing on the euro.
- Furthermore, the US dollar remains bid across the board ahead of the Federal Reserve’s monetary policy meeting, due next Wednesday. The buoyant US employment report released last Friday showed that US economy remains solid despite the increasing global uncertainty. In this backdrop, the market is pricing in another aggressive Fed rate hike, which is underpinning demand for the USD.
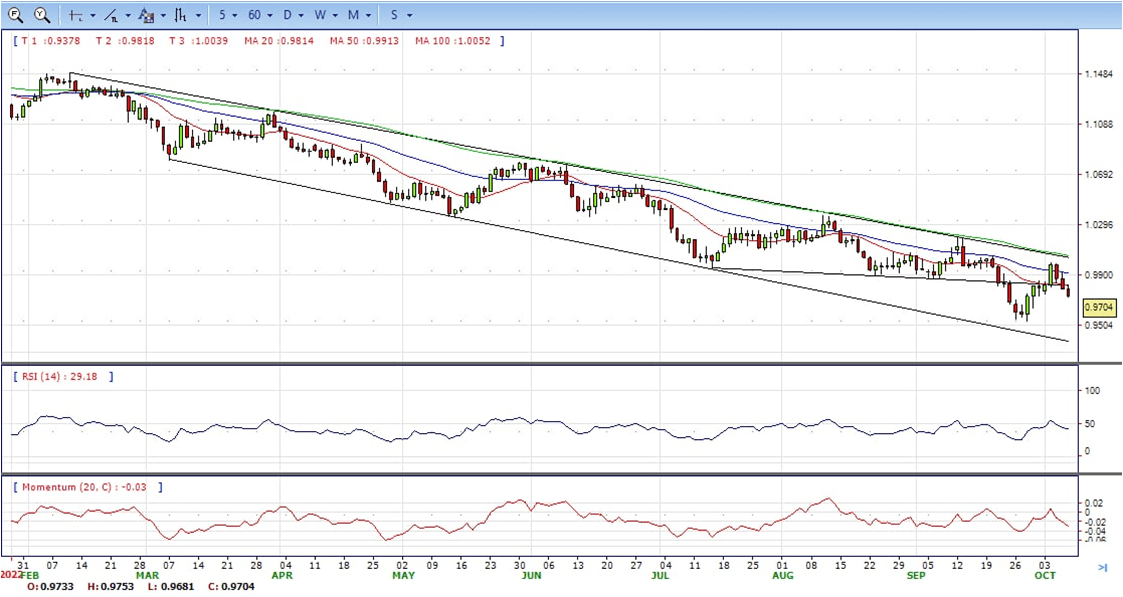
- The EUR/USD pair is trading near the 0.9005, down for the day with the neutral stance in daily chart. The pair stabilized below 20 and 50 SMA, indicates bearish strength. Meanwhile, the 20 SMA continued developing far below longer ones despite it started turning flat, suggests bears not exhausted yet. On upside, the immediate resistance is 0.9820, break above this level will extend the advance to 1.0000.
- Technical readings in the daily chart support the bearish stances. The RSI indicators hovering below the midlines and stabilized around 40. The Momentum indicator stabilized in the negative territory, indicating downward potentials. On downside, the immediate support is 0.9680 and below this level will open the gate to 0.9630.
- The GBP/USD extended its losses to four straight days after reaching an October high of 1.1495. At the time of writing, the GBP/USD is trading at 1.1060 after hitting a daily high of 1.1110, though it is below its opening price by 0.2%.
- Sentiment remains sour, as reflected by US equity markets. Fears that US companies will miss Q3 earnings expectations keep investors on their toes. That, alongside worries that the US Federal Reserve would continue to tighten monetary policy but would not be able to achieve a “soft landing,” added a pinch of salt to the already deteriorated mood.
- On the UK’s side, the Bank of England intervened in the UK’s bond market on Monday. Even though the BoE was expected to buy double September’s 28 GBP 5 billion, they only bought GBP 853 million. Of note is that the Chancellor of the Exchequer, Kwasi Kwarteng, said he would bring forwards his medium-term fiscal plan, including how the tax cuts will be paid for, on October 31, according to Reuters.
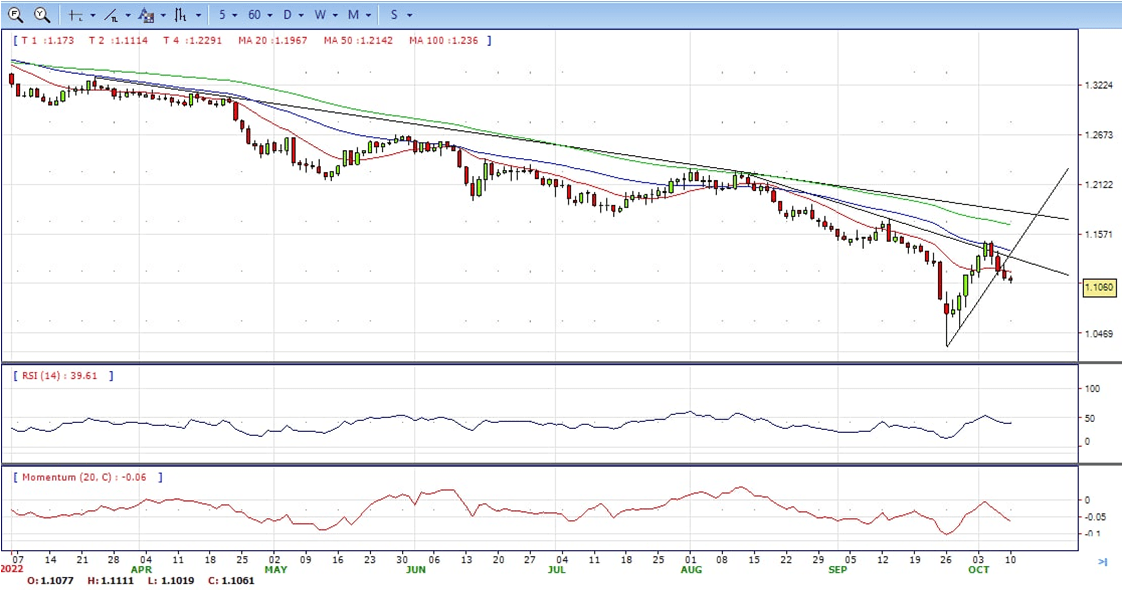
- The GBP/USD offers bearish stance in daily chart, it maintains the downward slope after hit 1.1111 high. Cable now is stabilizing below 20 and 50 SMA, indicating bearish strength in short term. Meanwhile, the 20 SMA continued developing below longer ones despite it started turning flat, suggesting bears not exhausted yet. On upside, The immediate resistance is 1.1150 with a break above it exposing to 1.1220.
- Technical readings in the daily chart support bearish stances. RSI indicator stabilized around 40, while the Momentum indicator stabilized below the midline, suggesting downward potentials. On downside, the immediate support is 1.1020, unable to defend this level will resume the decline to 1.0940.

- The gold price dropped from a high of $1699.91 from the get-go this week, sliding in Asia and not looking back, pausing for only a brief hourly candle in European markets and at the end of New York session at around $1,668, bearish in the daily chart.
- A risk-off impulse keeps the greenback in the driver’s seat, as shown by the US Dollar Index (DXY), up by 0.35%, at 113.142. Since October 5, when the DXY hit 110.05, the buck has recovered 2.75%, though it keeps trailing the YTD high at around 114.778. Most of the commodity prices, US dollar-denominated, are under pressure, with oil down by 0.28% and the precious metals remaining heavy.
- Elsewhere, the US economic calendar will feature further Fed speaking, led by Vice-Chair Lael Brainard. Data-wise, the docket will reveal Wednesday’s Producer Price Index (PPI) for September and FOMC minutes. The next day, traders’ focus will shift to US inflation figures, namely the CPI and unemployment claims. To close the week, US Retail Sales, alongside the University of Michigan Consumer Sentiment, are widely expected.
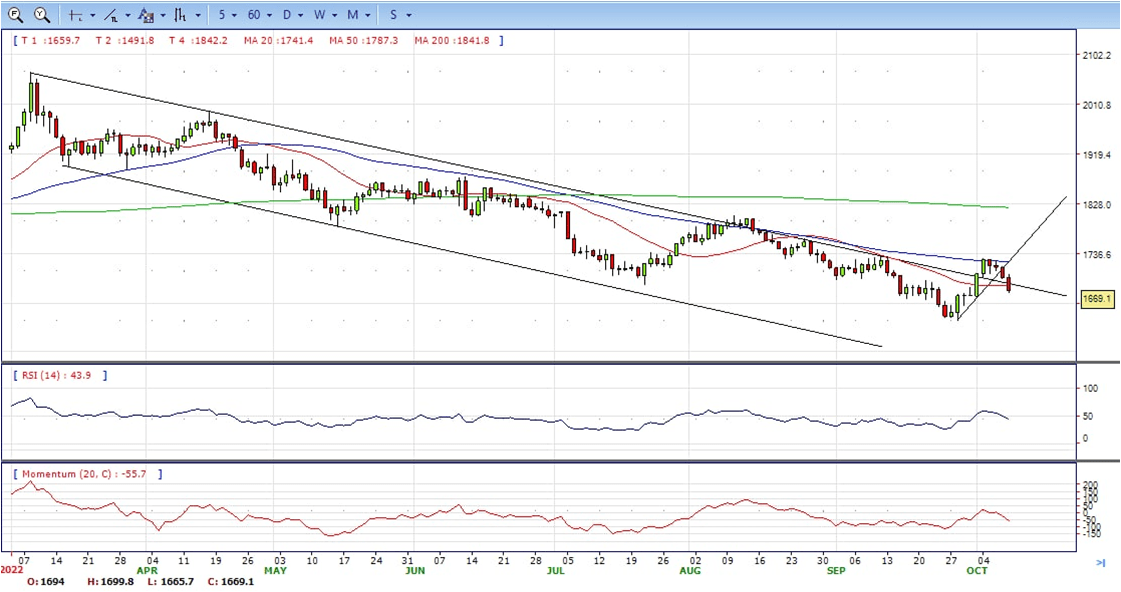
- Gold price stabilized around 1714, down for the day and neutral in the daily chart. The gold price stabilized between 20 and 50 SMA, suggesting neutral strength. Meanwhile, the 20 SMA continued developing far below longer ones despite it started turning flat, indicating bears not exhausted yet. On upside, the immediate resistance is 1700, break above this level will open the gate to extend the advance to 1745 area.
- From a technical perspective, the RSI indicator hold below the midline and stabilized around 43, suggesting bearish strength. The Momentum indicator struggled below the midline, suggests downward potentials. On downside, the immediate support is 1659, below this area may resume the decline to 1641.


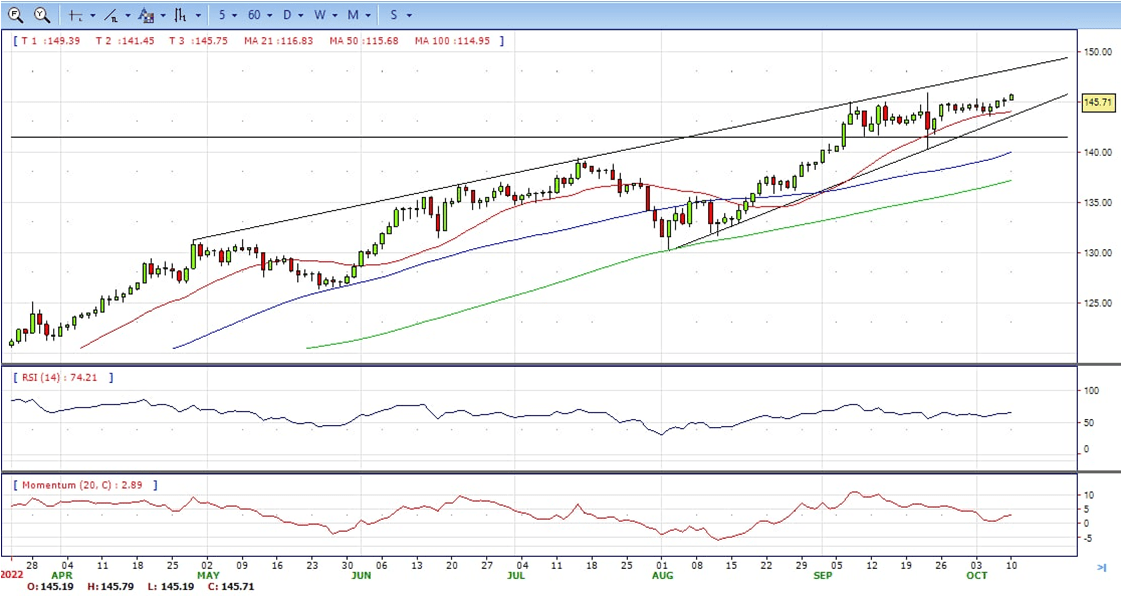
- The USD/JPY is advancing steadily towards the YTD high at around 145.90, increasing the odds of another FX intervention by Japanese authorities to bolster the JPY, which has remained weakening against most G8 currencies, particularly the greenback. At the time of writing, the USD/JPY is trading at around 145.77, up 0.28%, shy of printing a new 24-year high, above 145.90.
- Risk aversion keeps the greenback appreciating against most currencies. The US bond market is closed in observation of the Columbus holiday, with USD/JPY traders leaning on US dollar dynamics and market sentiment.
- Elsewhere, the US Dollar Index, a gauge of the greenback’s value against a basket of rivals, edges up by 0.35% at 113.147, a tailwind for the USD/JPY. Therefore, USD/JPY traders should expect further upside, though fears of another Bank of Japan’s (BoJ) intervention in the FX markets looming might stall the rally at around the 146.00 mark.
- The USD/JPY pair stabilized around 145.70, up for the day and bullish in the daily chart. The price still maintains the upward slope and stabilized above all main SMAs, suggests bullish strength. Meanwhile, 20 SMA continued accelerating north and developing above longer ones, indicating bulls not exhausted in the long term. On upside, overcome 146.00 may encourage bulls to challenge 147.00, break above that level will open the gate to 148.00.
- Technical indicators suggest the bullish strength. RSI stabilized around 66, while the Momentum indicator continued developing above the midline, suggests upward potentials. On downside, the immediate support is 143.50, break below this level will open the gate to 142.50 area.


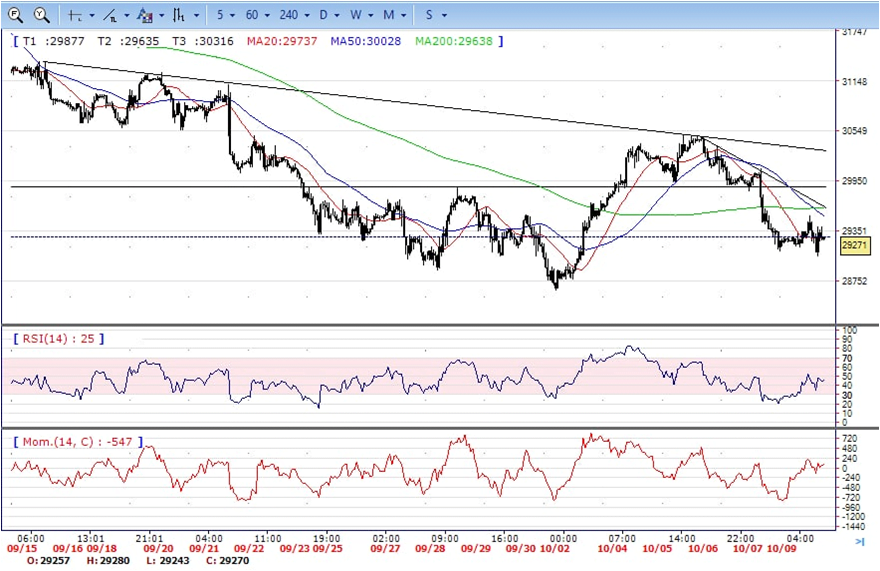
- DJI still under the sell pressure, retreated from the intraday top 29535 area to intraday low 29056 region. it ended the day with modest bounce at around 29275, bearish in the hourly chart. It stabilized below all main SMAs, suggests bearish strength. Meanwhile, the 20 SMA continued accelerating south and heading towards longer ones, suggesting bears not exhausted yet. On upside, overcome 29540 may encourage bulls to challenge 29850, break above this level will open the gate to 30100.
- Technical indicators suggest the bearish strength. RSI stabilized around 46, while the Momentum indicator stabilized near the midline, suggests directionless potentials. On downside, the immediate support is 29000, break below this level will open the gate for more decline to 28600 area.
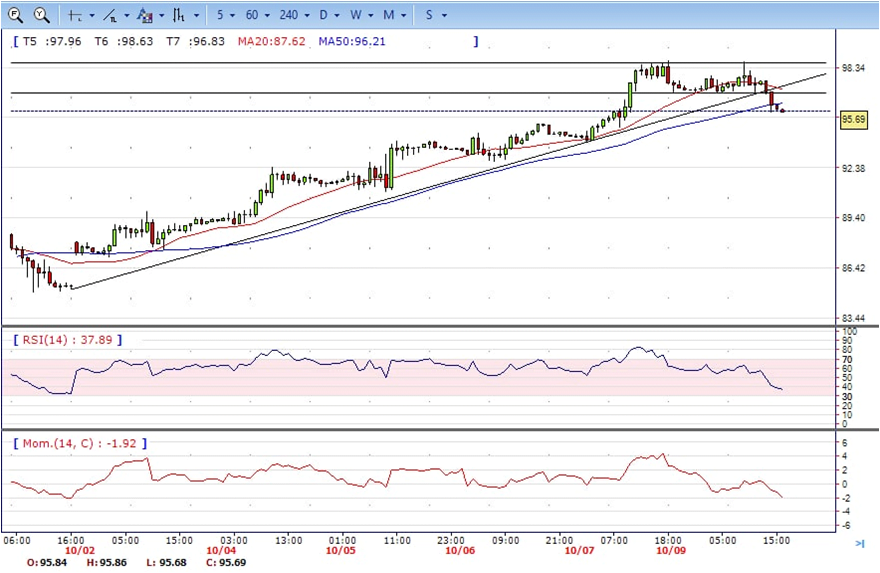
- Brent under the sell pressure, retreated from intraday high 98.66 to 95.70 region. It hold near the bottom to ended Monday, bearish in the hourly chart. The price stabilized below 20 and 50 SMAs, suggests bearish strength in short term. Meanwhile, the 20 SMA continued accelerating south and heading towards longer ones, indicating bears not exhausted yet. On upside, overcome 98.70 may encourage bulls to challenge 100.50, break above this level will open the gate to 102.50.
- Technical indicators suggest the bearish movement, hovering below the midline. RSI stabilized around 38, while the Momentum indicator stabilized in negative territory, suggests downward potentials. On downside, the immediate support is 95.60, break below this level will open the gate for more decline to 94.70 area.