EUR/USD
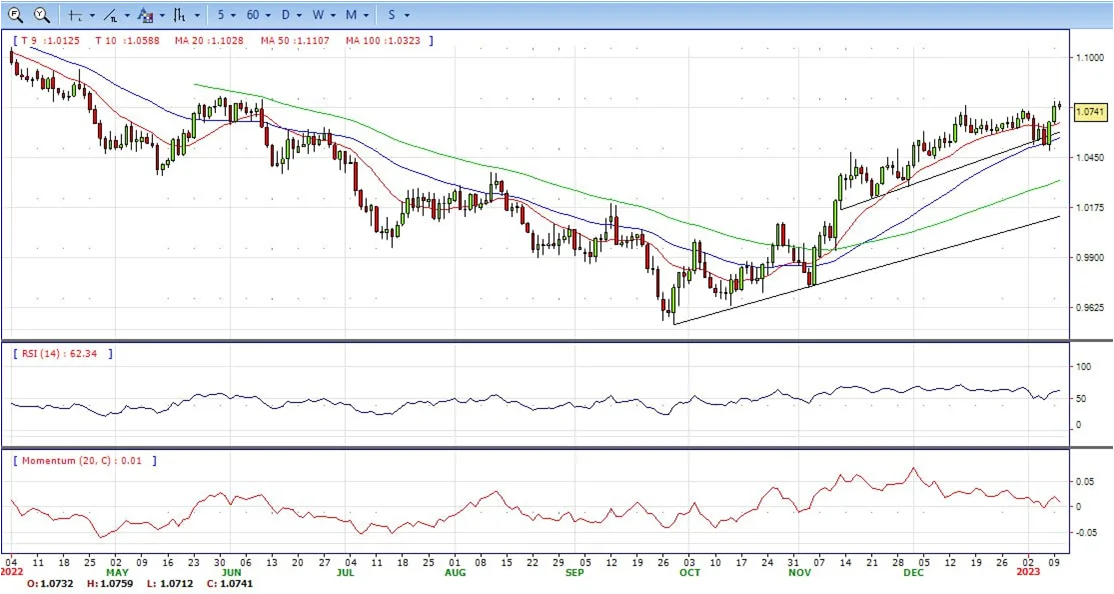
- EUR/USD is extending the bullish rally on Tuesday and has been trying to print a fresh high for this week’s initial balance, taking the US Dollar down to 1.0759 vs. the Single Currency on the bull’s quest for a test towards 1.0800. EUR/USD remains supported above 1.0700. The generalized absence of volatility in the global markets motivates EUR/USD to alternate gains with losses above 1.0700 the figure, while bulls see their aspirations somewhat limited around 1.0760 for the time being.
- The modest uptick in the pair comes in line with the equally humble advance in the German 10-year Bund yields, which add to Monday’s gains near 2.30%. Earlier in the session, Industrial Production in France expanded 0.2% MoM in November, whereas the NFIB Business Optimism Index dropped to 89.8 in December. Later in the US docket comes the IBD/TIPP Economic Optimism Index followed by Wholesale Inventories.
- EUR/USD has embarked on a strong recovery and has already retaken the key barrier at 1.0700 the figure and beyond. In the meantime, the European currency is expected to closely follow dollar dynamics, the impact of the energy crisis on the region and the Fed-ECB divergence. Back to the euro area, the increasing speculation of a potential recession in the bloc emerges as an important domestic headwind facing the euro in the short-term horizon.
- Technical readings in the daily chart support the bullish stance. The RSI indicator is above 50. The Momentum indicator is also above the mid-line, indicating bullish potentials. On downside, the immediate support is 1.0700 and below this level will open the gate to 1.0630.
Open A Demo
CDO has wide range of tools, professional and friendly support for clients to achieve their financial markets trading goals. Open a live account now to enjoy this experience with virtual deposit.
GBP/USD
- The GBP/USD pair edges lower on Tuesday and snaps a two-day winning streak to a nearly three-week high touched the previous day. The pair remains on the defensive through the first half of the European session and is currently flirting with the daily low, around mid-1.2100s.
- A combination of factors assists the US Dollar to stage a modest recovery from a seven-month low set on Monday, which, in turn, is seen exerting some downward pressure on the GBP/USD pair. A goodish pickup in the US Treasury bond yields, along with a softer risk tone, help revive demand for the safe-haven greenback.
- Apart the USD uptick could also be attributed to some repositioning trade ahead of Fed Chair Jerome Powell’s speech, due later during the early North American session. Investors will look for more clarity on the Fed’s rate hike path, which will play a key role in influencing the USD and provide a fresh impetus to the GBP/USD pair. The British Pound, on the other hand, is undermined by a bleak outlook for the UK economy, which has been fueling expectations that the Bank of England (BoE) is nearing the end of the current rate-hiking cycle. This, in turn, supports prospects for a further intraday fall for the GBP/USD pair amid absent relevant macro releases.
- Technical indicators hovering around the mid-lines. RSI indicator is around 50, while the Momentum indicators slightly below 0, which suggesting a near term neutral condition. On downside, the immediate support is 1.2115, unable to defend this level will resume the decline to 1.2075.


CDO TRADER
CDO TRADER, our cutting-edge trading platform, follows the technology from the forefront with new features added continuously. Moreover, CDO TRADER is now available for Android and iOS! So it allows you to trade on the go!
XAU/USD
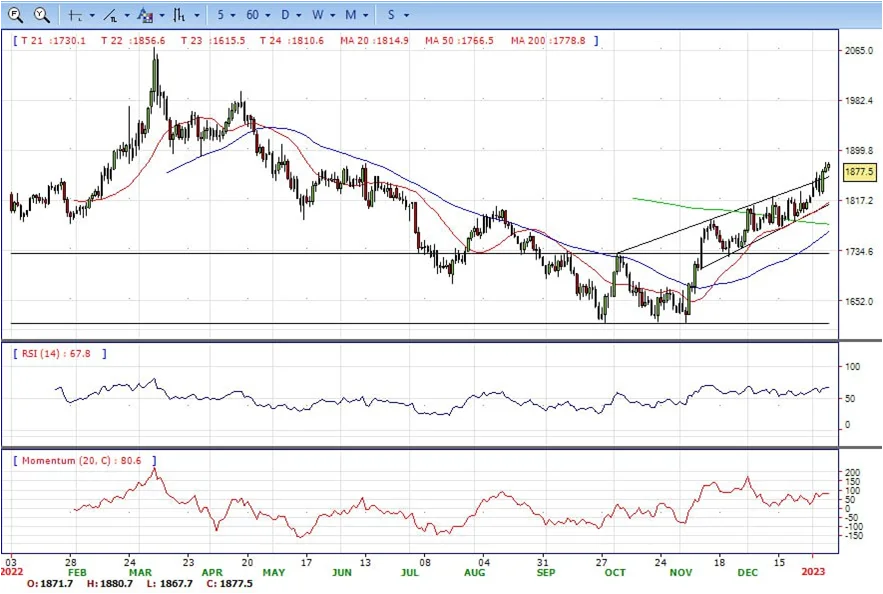
- Gold price (XAU/USD) remains sideways between 1868 to 1880 area on Tuesday. The United States economics and China’s reopening appeared to have previously helped the XAU/USD to rise to the highest level since May 2022. However, comments from the Federal Reserve (Fed) officials appear to challenge the Gold bulls afterward.
- Last week’s United States economics, mainly concerning the wage growth and ISM Services PMI for December, raised speculations that the Federal Reserve (Fed) finally has an upper hand in taming inflation, suggesting a pause to aggressive rate hikes. The same weighed on the US Treasury bond yields and the US Dollar even as the latest comments from the Fed officials restrict the Greenback’s latest downside.
- China’s reopening of the international borders after a three-year halt joined the People’s Bank of China’s (PBOC) quest for more Gold reserves to underpin the XAU/USD upside the previous day. The reason could be linked to the dragon nation’s status as one of the world’s biggest gold consumers. That said, Beijing’s readiness for stimulus and early signals of shopping spree ahead of the Chinese New Year holiday season also seemed to have favored the Gold’s upside. It’s worth noting that a lack of major data and events from elsewhere also allowed Chinese catalysts to gain major attention.
- From a technical perspective, the RSI indicator holds above the mid-line and stabilized around 67, still on a bullish strength. The Momentum indicator continued developing above the mid-line, suggests more upside potentials. On downside, the immediate support is 1860, below this area may resume the decline to 1842.
MetaTrader 4
MT4 has user friendly interface that is providing simplicity and efficiency. The traders can perform trading strategies for different products like Forex and CFD. MetaTrader 4 has over 50 built-in indicators, also it’s the tool that predicts trends and defines the appropriate entry and exit points.

USD/JPY
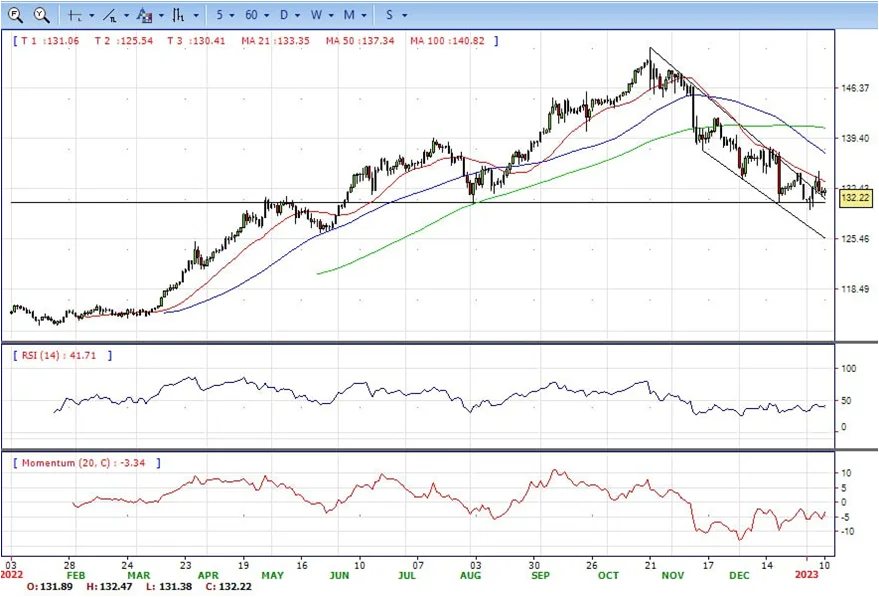
- The USD/JPY clings to gains following the release of the US Federal Reserve (Fed) Chair Jerome Powell’s Speech at Sweeden Riksbank, which did not acknowledge monetary policy, but rather focused on central bank independence. Therefore, risk appetite continues to improve as Wall Street futures shed some losses.
- Investors’ mood was negative ahead of the Fed’s Chair Powell speech. According to newswires, equities pullback was attributed to Fed’s Bostic and Daly comments on Monday, seen as hawkish. Nevertheless, the financial market did not respond to a “reprice” of a less hawkish Fed, meaning that US Treasury bond yields continued to fall, ignoring Fed officials’ comments.
- Data-wise, an absent US economic docket keeps the USD/JPY trading unchanged. However, comments by Fed policymakers emphasizing the central bank’s resolution to curb inflation slightly weighed on investors’ mood. Fed’s Daly and Bostic added that rates would need to be above the 5% range and would need to be held higher for longer, at least until 2024.
- Earlier in the Asian session, a hot Tokyo CPI print on an annual basis, around 4%, failed to underpin the Japanese Yen (JPY). So, in the short term, further USD/JPY upside could be expected.
- Technical indicators still suggest the bearish strength, hovering below the mid-line. RSI fell below 50, while the Momentum indicator continued in negative territory, suggests bear potentials. On downside, the immediately support is 131.3, break below this level will open the gate to 130 area.
DJI
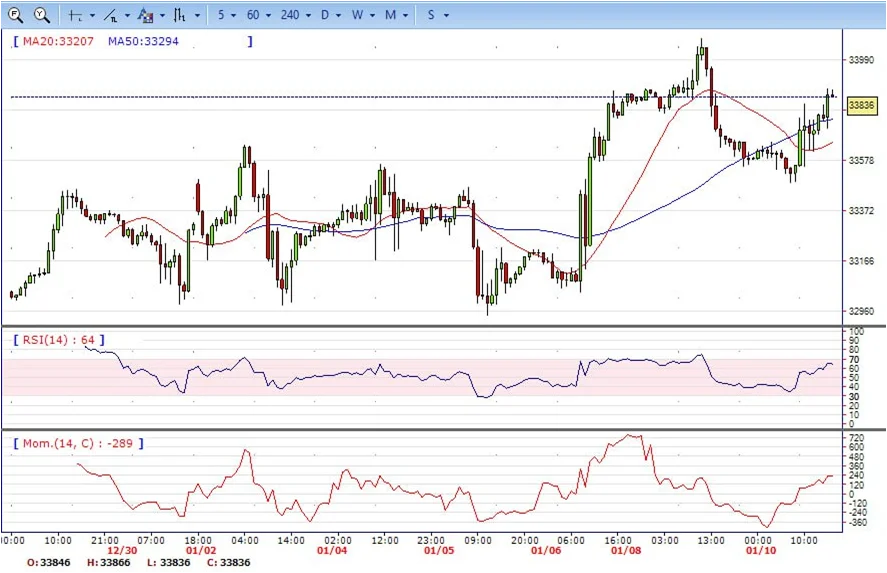
- DJI gained strength on Tuesday, hit intraday high of 33840 area, the market did hit a 3-day low of 33488 early US session and then reversed to major resistance 33800 area. market shows a bullish sign in the hourly chart. It stand above both 20 and 50 MAs, suggests a bullish sign. However, a firm cross between 20 and 50MA will confirm the trend. On upside, overcome 34078 may encourage bulls to challenge 34300, break above that level will open the gate to 34700.
- Technical indicators also suggest the bullish movement, developing above the mid-line. RSI stabilized around 65, while the Momentum indicator hovering well above the mid-line, suggests upside potentials. On downside, the immediately support is 33575, break below this level will open the gate for more decline to 33425 area.
BRENT
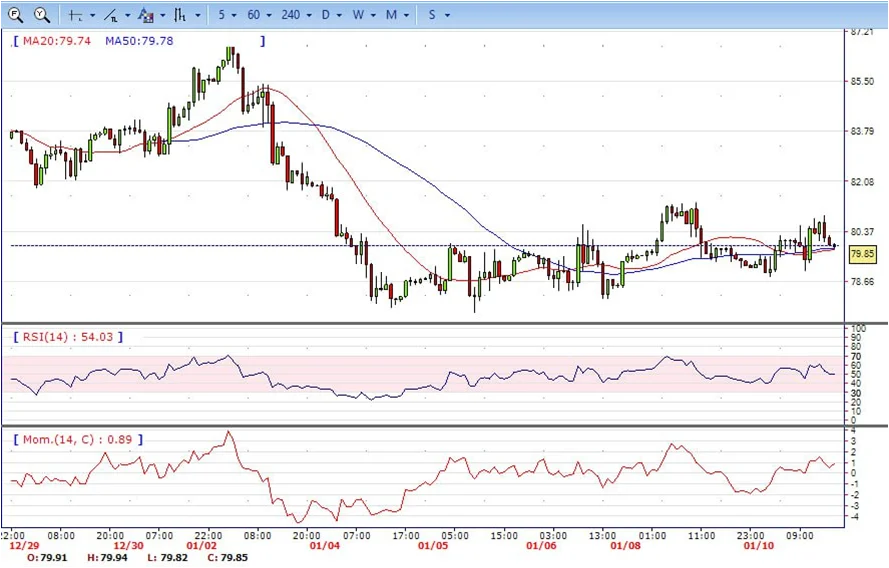
- The Brent continued its narrow range on Tuesday, the prices hit as low as of 79.00 early US session and rebound to as high as 80.90 US afternoon. The market flat for the day and showing slightly bearish to neutral sign in the hourly chart. The prices are standing on both 20 and 50MAs, indicating a neutral position. On upside, overcome 81.37 may encourage bulls to challenge 82.00, break above that level will open the gate to 83.00.
- Technical indicators also suggest neutral movement, hovering around the mid-line. RSI stabilized around 50, while the Momentum index slightly below the mid-line, suggests neutral condition. On downside, the immediately support is 77.60, break below this level will open the gate for more decline to 75.65 area.
Contact Us
Please, fill the form to get an assistance.


